Archive
Duke deans drop the ball on scientific misconduct
Former Duke University cancer researcher Anil Potti was found guilty of research misconduct yesterday by the federal Office of Research Integrity (ORI), after a multi-year investigation. You can read the story in Science, for example. His punishment is that he won’t do research without government-sponsored supervision for the next five years. Not exactly stiff.
This article also covers the ORI decision, and describes some of the people who suffered from poor cancer treatment because of his lies. Here’s an excerpt:
Shoffner, who had Stage 3 breast cancer, said she still has side effects from the wrong chemotherapy given to her in the Duke trial. Her joints were damaged, she said, and she suffered blood clots that prevent her from having knee surgery now. Of the eight patients who sued, Shoffner said, she is one of two survivors.
What’s interesting to me this morning is that both articles above mention the same reason for the initial investigation in his work. Namely, that he had padded his resume, pretending to be a Rhodes Scholar when he wasn’t. That fact was reported by a website called Cancer Letter in 2010.
But here’s the thing, back in 2008 a 3rd-year medical student named Bradford Perez sent the deans at Duke (according to Cancer Letter) a letter explaining that Potti’s lab was fabricating results. And for those of you who can read nerd, please go ahead and read his letter, it is extremely convincing. An excerpt:
Fifty-nine cell line samples with mRNA expression data from NCI-60 with associated radiation sensitivity were split in half to designate sensitive and resistant phenotypes. Then in developing the model, only those samples which fit the model best in cross validation were included. Over half of the original samples were removed. It is very possible that using these methods two samples with very little if any difference in radiation sensitivity could be in separate phenotypic categories. This was an incredibly biased approach which does little more than give the appearance of a successful cross validation.
Instead of taking up the matter seriously, the deans pressured Perez to keep quiet. And nothing more happened for two more years.
The good news: Bradford Perez seems to have gotten a perfectly good job.
The bad news: the deans at Duke suck. Unfortunately I don’t know exactly which deans and what their job titles are, but still: why are they not under investigation? What would deans have to do – or not do – to get in trouble? Is there any kind of accountability here?
Gender And The Harvard Math Department
This is a guest post by Meena Boppana, a junior at Harvard and former president of the Harvard Undergraduate Math Association (HUMA). Meena is passionate about addressing the gender gap in math and has co-lead initiatives including the Harvard math survey and the founding of the Harvard student group Gender Inclusivity in Math (GIIM).
I arrived at Harvard in 2012 head-over-heels in love with math. Encouraged to think mathematically since I was four years old by my feminist mathematician dad, I had even given a TEDx talk in high school declaring my love for the subject. I was certainly qualified and excited enough to be a math major.
Which is why, three years later, I think about how it is that virtually all my female friends with insanely strong math backgrounds (e.g. math competition stars) decided not to major in math (I chose computer science). This year, there were no female students in Math 55a, the most intense freshman math class, and only two female students graduating with a primary concentration in math. There are also a total of zero tenured women faculty in Harvard math.
So, I decided to do some statistical sleuthing and co-directed a survey of Harvard undergraduates in math. I was inspired by the work of Nancy Hopkins and other pioneering female scientists at MIT, who quantified gender inequities at the Institute – even measuring the square footage of their offices – and sparked real change. We got a 1/3 response rate among all math concentrators at Harvard, with 150 people in total (including related STEM concentrations) filling it out.
The main finding of our survey analysis is that the dearth of women in Harvard math is far more than a “pipeline issue” stemming from high school. So, the tale that women are coming in to Harvard knowing less math and consequently not majoring in math is missing much of the picture. Women are dropping out of math during their years at Harvard, with female math majors writing theses and continuing on to graduate school at far lower rates than their male math major counterparts.
And it’s a cultural issue. Our survey indicated that many women would like to be involved in the math department and aren’t, most women feel uncomfortable as a result of the gender gap, and women feel uncomfortable in math department common spaces.

Source: Harvard Math Survey
The simple act of talking about the gender gap has opened the floodgates to great conversations. I had always assumed that because no one was talking about the gender gap, no one cared. But after organizing a panel on gender in the math department which drew 150 people with a roughly equal gender split and students and faculty alike, I realized that my classmates of all genders feel more disempowered than apathetic.
The situation is bad, but certainly not hopeless. Together with a male freshman math major, I am founding a Harvard student group called Gender Inclusivity in Math (GIIM). The club has the two-fold goal of increasing community among women in math, including dinners, retreats, and a women speaker series, and also addressing the gender gap in the math department, continuing the trend of surveys and gender in math discussions. The inclusion of male allies is central to our club mission, and the support from male allies at the student and faculty level that we have received makes me optimistic about the will for change.
Ultimately, it is my continued love for math which has driven me to take action. Mathematics is too beautiful and important to lose 50 percent (or much more when considering racial and class-based inequities) of the potential population of math lovers.
Sharing insurance costs with the sharing economy
One consequence of the “sharing economy” that hasn’t been widely discussed, at least as far as I’ve seen, is how the externalities are being absorbed. Specifically, insurance costs.
Maybe because it’s an ongoing process, but for both Uber and AirBnB, the companies tell individuals who drive that their primary car insurance should be in use, and they tell individual home- or apartment-dwellers that their renters insurance should apply.
In other words, if something goes wrong, the wishful thinking goes, the private, individual insurance plans should kick in.
When people have tried to verify this, however, they responses have been mixed and mostly negative. The insurance companies obviously don’t want to cover a huge number of people for circumstances they didn’t expect when they offered the coverage.
So, if an Uber driver gets into an accident while ferrying a passenger, it’s not clear whether their primary insurance will cover it. It’s even less clear if the driver is using the Uber app and is on their way to get a passenger. Similarly, if an AirBnB guest falls because of a broken staircase, it’s not clear who is supposed to pay for the damages to the person or the staircase. What if the guest burns down the house?
So far I don’t think it’s been fully decided, but I think one of two things could happen.
In the first scenario, the insurance companies will really refuse to cover such things. To do this they will have to have a squad of investigators who somehow make sure the customer in question was or was not hosting a guest or driving a customer. That would involve suspicion and some amount of harassment, which customers don’t like.
In the second scenario, which I think is more likely given the above, the insurance companies will quietly pay for the damages accrued by Uber and AirBnB usage. They won’t advertise this, and if asked, they will discourage any customer from doing stuff like that, but they also won’t actually refuse to pay the costs, which they will simply transfer to the larger pool of customers. It doesn’t really matter to them at all, in fact, as long as they are not the only insurance company with this problem.
That will mean that the quants who figure out the costs of insurance will see their numbers change over time, depending on how much more the insurance is being called into action. I expect this to happen a lot more for Uber drivers, because if you are an Uber driver 40 hours a week, that means you’re always in your car. So our insurance costs will go up in proportion to how many people become Uber drivers. I expect this to happen somewhat more for AirBnB renters, because the house or apartment is in constant use; if it’s being rented by rowdy partiers, all the more. Our renters insurance will go up in proportion to how many people are AirBnB renters.
That reminds me of a story my dad used to like telling, whereby a friend of his rented out his Cambridge house to a Harvard professor, and when he came back it was totally trashed, including what looked like a bonfire pit in the living room. The professor in question was Timothy Leary.
Anyhoo, my overall conclusion is that the new “sharing economy” businesses really will end up sharing something with the rest of us soon, namely the cost of insurance. We will all be paying more for car insurance and home- or renters-insurance if my guess is accurate. Thanks, guys.
Fingers crossed – book coming out next May
As it turns out, it takes a while to write a book, and then another few months to publish it.
I’m very excited today to tentatively announce that my book, which is tentatively entitled Weapons of Math Destruction: How Big Data Increases Inequality and Threatens Democracy, will be published in May 2016, in time to appear on summer reading lists and well before the election.
Fuck yeah! I’m so excited.
p.s. Fight for 15 is happening now.
The arbitrary punishment of New York teacher evaluations
The Value-Added Model for teachers (VAM), currently in use all over the country, is a terrible scoring system, as I’ve described before. It is approximately a random number generator.
Even so, it’s still in use, mostly because it wields power over the teacher unions. Let me explain why I say this.
Cuomo’s new budget negotiations with the teacher’s union came up with the following rules around teacher tenure, as I understand them (readers, correct me if I’m wrong):
- It will take at least 4 years to get tenure,
- A teacher must get at least 3 “effective” or “highly effective” ratings in those three years,
- A teacher’s yearly rating depends directly on their VAM score: they are not allowed to get an “effective” or “highly effective” rating if their VAM score comes out as “ineffective.”
Now, I’m ignoring everything else about the system, because I want to distill the effect of VAM.
Let’s think through the math of how likely it is that you’d be denied tenure based only on this random number generator. We will assume only that you otherwise get good ratings from your principal and outside observations. Indeed, Cuomo’s big complaint is that 98% of teachers get good ratings, so this is a safe assumption.
My analysis depends on what qualifies as an “ineffective” VAM score, i.e. what the cutoff is. For now, let’s assume that 30% of teachers receive “ineffective” in a given year, because it has to be some number. Later on we’ll see how things change if that assumption is changed.
That means that 30% of the time, a teacher will not be able to receive an “effective” score, no matter how else they behave, and no matter what their principals or outside observations report for a given year.
Think of it as a biased coin flip, and 30% of the time – for any teacher and for any year – it lands on “ineffective”, and 70% of the time it lands on “effective.” We will ignore the other categories because they don’t matter.
How about if you look over a four year period? To avoid getting any “ineffective” coin flips, you’d need to get “effective” every year, which would happen 0.70^4 = 24% of the time. In other words, 76% of the time, you’d get at least one “ineffective” rating just by chance.
But remember, you don’t need to get an “effective” rating for all four years, you are allowed one “ineffective rating.” The chances of exactly one “ineffective” coin flip and three “effective” flips is 4 (1-0.70) 0.70^3 = 41%.
Adding those two scenarios together, it means that 65% of the time, over a four year period, you’d get sufficient VAM scores to receive tenure. But it also means that 35% of the time you wouldn’t, through no fault of your own.
This is the political power of a terrible scoring system. More than a third of teachers are being arbitrarily chosen to be punished by this opaque and unaccountable test.
Let’s go back to my assumption, that 30% of teachers are deemed “ineffective.” Maybe I got this wrong. It directly impacts my numbers above. If the overall probability of being deemed “effective” is p, then the overall chance of getting sufficient VAM scores will be
So if I got it totally wrong, and 98% of teachers are described as effective by the VAM model, this would mean almost all teachers get sufficient VAM scores.
On the other hand, remember that the reason VAM is being pushed so hard by people is that they don’t like it when evaluations systems think too many people are effective. In fact, they’d rather see arbitrary and random evaluation than see most people get through unscathed.
In other words, it is definitely more than 2% of teachers that are called “ineffective,” but I don’t know the true cutoff.
If anyone knows the true cutoff, please tell me so I can compute anew the percentage of teachers that are arbitrarily being kept from tenure.
Guest Post: A Discussion Of PARCC Testing
This is a guest post by Eugene Stern, who writes a blog at Sense Made Here, and Kristin Wald, who writes a blog at This Unique* Weblog. Crossposted on their blogs as well.
Today’s post is a discussion of education reform, standardized testing, and PARCC with my friend Kristin Wald, who has been extremely kind to this blog. Kristin taught high school English in the NYC public schools for many years. Today her kids and mine go to school together in Montclair. She has her own blog that gets orders of magnitude more readers than I do.
ES: PARCC testing is beginning in New Jersey this month. There’s been lots of anxiety and confusion in Montclair and elsewhere as parents debate whether to have their kids take the test or opt out. How do you think about it, both as a teacher and as a parent?
KW: My simple answer is that my kids will sit for PARCC. However, and this is where is gets grainy, that doesn’t mean I consider myself a cheerleader for the exam or for the Common Core curriculum in general.
In fact, my initial reaction, a few years ago, was to distance my children from both the Common Core and PARCC. So much so that I wrote to my child’s principal and teacher requesting that no practice tests be administered to him. At that point I had only peripherally heard about the issues and was extending my distaste for No Child Left Behind and, later, Race to the Top. However, despite reading about and discussing the myriad issues, I still believe in change from within and trying the system out to see kinks and wrinkles up-close rather than condemning it full force.
Standards
ES: Why did you dislike NCLB and Race to the Top? What was your experience with them as a teacher?
KW: Back when I taught in NYC, there was wiggle room if students and schools didn’t meet standards. Part of my survival as a teacher was to shut my door and do what I wanted. By the time I left the classroom in 2007 we were being asked to post the standards codes for the New York State Regents Exams around our rooms, similar to posting Common Core standards all around. That made no sense to me. Who was this supposed to be for? Not the students – if they’re gazing around the room they’re not looking at CC RL.9-10 next to an essay hanging on a bulletin board. I also found NCLB naïve in its “every child can learn it all” attitude. I mean, yes, sure, any child can learn. But kids aren’t starting out at the same place or with the same support. And anyone who has experience with children who have not had the proper support up through 11th grade knows they’re not going to do well, or even half-way to well, just because they have a kickass teacher that year.
Regarding my initial aversion to Common Core, especially as a high school English Language Arts teacher, the minimal appearance of fiction and poetry was disheartening. We’d already seen the slant in the NYS Regents Exam since the late 90’s.
However, a couple of years ago, a friend asked me to explain the reason The Bluest Eye, with its abuse and rape scenes, was included in Common Core selections, so I took a closer look. Basically, a right-wing blogger had excerpted lines and scenes from the novel to paint it as “smut” and child pornography, thus condemning the entire Common Core curriculum. My response to my friend ended up as “In Defense of The Bluest Eye.”
That’s when I started looking more closely at the Common Core curriculum. Learning about some of the challenges facing public schools around the country, I had to admit that having a required curriculum didn’t seem like a terrible idea. In fact, in a few cases, the Common Core felt less confining than what they’d had before. And you know, even in NYC, there were English departments that rarely taught women or minority writers. Without a strong leader in a department, there’s such a thing as too much autonomy. Just like a unit in a class, a school and a department should have a focus, a balance.
But your expertise is Mathematics, Eugene. What are your thoughts on the Common Core from that perspective?
ES: They’re a mix. There are aspects of the reforms that I agree with, aspects that I strongly disagree with, and then a bunch of stuff in between.
The main thing I agree with is that learning math should be centered on learning concepts rather than procedures. You should still learn procedures, but with a conceptual underpinning, so you understand what you’re doing. That’s not a new idea: it’s been in the air, and frustrating some parents, for 50 years or more. In the 1960’s, they called it New Math.
Back then, the reforms didn’t go so well because the concepts they were trying to teach were too abstract – too much set theory, in a nutshell, at least in the younger grades. So then there was a retrenchment, back to learning procedures. But these things seem to go in cycles, and now we’re trying to teach concepts better again. This time more flexibly, less abstractly, with more examples. At least that’s the hope, and I share that hope.
I also agree with your point about needing some common standards defining what gets taught at each grade level. You don’t want to be super-prescriptive, but you need to ensure some kind of consistency between schools. Otherwise, what happens when a kid switches schools? Math, especially, is such a cumulative subject that you really need to have some big picture consistency in how you teach it.
Assessment
ES: What I disagree with is the increased emphasis on standardized testing, especially the raised stakes of those tests. I want to see better, more consistent standards and curriculum, but I think that can and should happen without putting this very heavy and punitive assessment mechanism on top of it.
KW: Yes, claiming to want to assess ability (which is a good thing), but then connecting the results to a teacher’s effectiveness in that moment is insincere evaluation. And using a standardized test not created by the teacher with material not covered in class as a hard percentage of a teacher’s evaluation makes little sense. I understand that much of the exam is testing critical thinking, ability to reason and use logic, and so on. It’s not about specific content, and that’s fine. (I really do think that’s fine!) Linking teacher evaluations to it is not.
Students cannot be taught to think critically in six months. As you mentioned about the spiraling back to concepts, those skills need to be revisited again and again in different contexts. And I agree, tests needn’t be the main driver for raising standards and developing curriculum. But they can give a good read on overall strengths and weaknesses. And if PARCC is supposed to be about assessing student strengths and weaknesses, it should be informing adjustments in curriculum.
On a smaller scale, strong teachers and staffs are supposed to work as a team to influence the entire school and district with adjusted curriculum as well. With a wide reach like the Common Core, a worrying issue is that different parts of the USA will have varying needs to meet. Making adjustments for all based on such a wide collection of assessments is counterintuitive. Local districts (and the principals and teachers in them) need to have leeway with applying them to best suit their own students.
Even so, I do like some things about data driven curricula. Teachers and school administrators are some of the most empathetic and caring people there are, but they are still human, and biases exist. Teachers, guidance counselors, administrators can’t help but be affected by personal sympathies and peeves. Having a consistent assessment of skills can be very helpful for those students who sometimes fall through the cracks. Basically, standards: yes. Linking scores to teacher evaluation: no.
ES: Yes, I just don’t get the conventional wisdom that we can only tell that the reforms are working, at both the individual and group level, through standardized test results. It gives us some information, but it’s still just a proxy. A highly imperfect proxy at that, and we need to have lots of others.
I also really like your point that, as you’re rolling out national standards, you need some local assessment to help you see how those national standards are meeting local needs. It’s a safeguard against getting too cookie-cutter.
I think it’s incredibly important that, as you and I talk, we can separate changes we like from changes we don’t. One reason there’s so much noise and confusion now is that everything – standards, curriculum, testing – gets lumped together under “Common Core.” It becomes this giant kitchen sink that’s very hard to talk about in a rational way. Testing especially should be separated out because it’s fundamentally an issue of process, whereas standards and curriculum are really about content.
You take a guy like Cuomo in New York. He’s trying to increase the reliance on standardized tests in teacher evaluations, so that value added models based on test scores count for half of a teacher’s total evaluation. And he says stuff like this: “Everyone will tell you, nationwide, the key to education reform is a teacher evaluation system.” That’s from his State of the State address in January. He doesn’t care about making the content better at all. “Everyone” will tell you! I know for a fact that the people spending all their time figuring out at what grade level kids should start to learn about fractions aren’t going tell you that!
I couldn’t disagree with that guy more, but I’m not going to argue with him based on whether or not I like the problems my kids are getting in math class. I’m going to point out examples, which he should be well aware of by now, of how badly the models work. That’s a totally different discussion, about what we can model accurately and fairly and what we can’t.
So let’s have that discussion. Starting point: if you want to use test scores to evaluate teachers, you need a model because – I think everyone agrees on this – how kids do on a test depends on much more than how good their teacher was. There’s the talent of the kid, what preparation they got outside their teacher’s classroom, whether they got a good night’s sleep the night before, and a good breakfast, and lots of other things. As well as natural randomness: maybe the reading comprehension section was about DNA, and the kid just read a book about DNA last month. So you need a model to break out the impact of the teacher. And the models we have today, even the most state-of-the-art ones, can give you useful aggregate information, but they just don’t work at that level of detail. I’m saying this as a math person, and the American Statistical Association agrees. I’ve written about this here and here and here and here.
Having student test results impact teacher evaluations is my biggest objection to PARCC, by far.
KW: Yep. Can I just cut and paste what you’ve said? However, for me, another distasteful aspect is how technology is tangled up in the PARCC exam.
Technology
ES: Let me tell you the saddest thing I’ve heard all week. There’s a guy named Dan Meyer, who writes very interesting things about math education, both in his blog and on Twitter. He put out a tweet about a bunch of kids coming into a classroom and collectively groaning when they saw laptops on every desk. And the reason was that they just instinctively assumed they were either about to take a test or do test prep.
That feels like such a collective failure to me. Look, I work in technology, and I’m still optimistic that it’s going to have a positive impact on math education. You can use computers to do experiments, visualize relationships, reinforce concepts by having kids code them up, you name it. The new standards emphasize data analysis and statistics much more than any earlier standards did, and I think that’s a great thing. But using computers primarily as a testing tool is an enormous missed opportunity. It’s like, here’s the most amazing tool human beings have ever invented, and we’re going to use it primarily as a paperweight. And we’re going to waste class time teaching kids exactly how to use it as a paperweight. That’s just so dispiriting.
KW: That’s something that hardly occurred to me. My main objection to hosting the PARCC exam on computers – and giving preparation homework and assignments that MUST be done on a computer – is the unfairness inherent in accessibility. It’s one more way to widen the achievement gap that we are supposed to be minimizing. I wrote about it from one perspective here.
I’m sure there are some students who test better on a computer, but the playing field has to be evenly designed and aggressively offered. Otherwise, a major part of what the PARCC is testing is how accurately and quickly children use a keyboard. And in the aggregate, the group that will have scores negatively impacted will be children with less access to the technology used on the PARCC. That’s not an assessment we need to test to know. When I took the practice tests, I found some questions quite clear, but others were difficult not for content but in maneuvering to create a fraction or other concept. Part of that can be solved through practice and comfort with the technology, but then we return to what we’re actually testing.
ES: Those are both great points. The last thing you want to do is force kids to write math on a computer, because it’s really hard! Math has lots of specialized notation that’s much easier to write with pencil and paper, and learning how to write math and use that notation is a big part of learning the subject. It’s not easy, and you don’t want to put artificial obstacles in kids’ way. I want kids thinking about fractions and exponents and what they mean, and how to write them in a mathematical expression, but not worrying about how to put a numerator above a denominator or do a superscript or make a font smaller on a computer. Plus, why in the world would you limit what kids can express on a test to what they can input on a keyboard? A test is a proxy already, and this limits what it can capture even more.
I believe in using technology in education, but we’ve got the order totally backwards. Don’t introduce the computer as a device to administer tests, introduce it as a tool to help in the classroom. Use it for demos and experiments and illustrating concepts.
As far as access and fairness go, I think that’s another argument for using the computer as a teaching tool rather than a testing tool. If a school is using computers in class, then at least everyone has access in the classroom setting, which is a start. Now you might branch out from there to assignments that require a computer. But if that’s done right, and those assignments grow in an organic way out of what’s happening in the classroom, and they have clear learning value, then the school and the community are also morally obligated to make sure that everyone has access. If you don’t have a computer at home, and you need to do computer-based homework, then we have to get you computer access, after school hours, or at the library, or what have you. And that might actually level the playing field a bit. Whereas now, many computer exercises feel like they’re primarily there to get kids used to the testing medium. There isn’t the same moral imperative to give everybody access to that.
I really want to hear more about your experience with the PARCC practice tests, though. I’ve seen many social media threads about unclear questions, both in a testing context and more generally with the Common Core. It sounds like you didn’t think it was so bad?
KW: Well, “not so bad” in that I am a 45 year old who was really trying to take the practice exam honestly, but didn’t feel stressed about the results. However, I found the questions with fractions confusing in execution on the computer (I almost gave up), and some of the questions really had to be read more than once. Now, granted, I haven’t been exposed to the language and technique of the exam. That matters a lot. In the SAT, for example, if you don’t know the testing language and format it will adversely affect your performance. This is similar to any format of an exam or task, even putting together an IKEA nightstand.
There are mainly two approaches to preparation, and out of fear of failing, some school districts are doing hardcore test preparation – much like SAT preparation classes – to the detriment of content and skill-based learning. Others are not altering their classroom approaches radically; in fact, some teachers and parents have told me they hardly notice a difference. My unscientific observations point to a separation between the two that is lined in Socio-Economic Status. If districts feel like they are on the edge or have a lot to lose (autonomy, funding, jobs), if makes sense that they would be reactionary in dealing with the PARCC exam. Ironically, schools that treat the PARCC like a high-stakes test are the ones losing the most.
Opting Out
KW: Despite my misgivings, I’m not in favor of “opting out” of the test. I understand the frustration that has prompted the push some districts are experiencing, but there have been some compromises in New Jersey. I was glad to see that the NJ Assembly voted to put off using the PARCC results for student placement and teacher evaluations for three years. And I was relieved, though not thrilled, that the percentage of PARCC results to be used in teacher evaluations was lowered to 10% (and now put off). I still think it should not be a part of teacher evaluations, but 10% is an improvement.
Rather than refusing the exam, I’d prefer to see the PARCC in action and compare honest data to school and teacher-generated assessments in order to improve the assessment overall. I believe an objective state or national model is worth having; relying only on teacher-based assessment has consistency and subjective problems in many areas. And that goes double for areas with deeply disadvantaged students.
ES: Yes, NJ seems to be stepping back from the brink as far as model-driven teacher evaluation goes. I think I feel the same way you do, but if I lived in NY, where Cuomo is trying to bump up the weight of value added models in evaluations to 50%, I might very well be opting out.
Let me illustrate the contrast – NY vs. NJ, more test prep vs. less — with an example. My family is good friends with a family that lived in NYC for many years, and just moved to Montclair a couple months ago. Their older kid is in third grade, which is the grade level where all this testing starts. In their NYC gifted and talented public school, the test was this big, stressful thing, and it was giving the kid all kinds of test anxiety. So the mom was planning to opt out. But when they got to Montclair, the kid’s teacher was much more low key, and telling the kids not to worry. And once it became lower stakes, the kid wanted to take the test! The mom was still ambivalent, but she decided that here was an opportunity for her kid to get used to tests without anxiety, and that was the most important factor for her.
I’m trying to make two points here. One: whether or not you opt out depends on lots of factors, and people’s situations and priorities can be very different. We need to respect that, regardless of which way people end up going. Two: shame on us, as grown ups, for polluting our kids’ education with our anxieties! We need to stop that, and that extends both to the education policies we put in place and how we collectively debate those policies. I guess what I’m saying is: less noise, folks, please.
KW: Does this very long blog post count as noise, Eugene? I wonder how this will be assessed? There are so many other issues – private profits from public education, teacher autonomy in high performing schools, a lack of educational supplies and family support, and so on. But we have to start somewhere with civil and productive discourse, right? So, thank you for having the conversation.
ES: Kristin, I won’t try to predict anyone else’s assessment, but I will keep mine low stakes and say this has been a pleasure!
Guest post: Be more careful with the vagina stats in teaching
This is a guest post by Courtney Gibbons, an assistant professor of mathematics at Hamilton College. You can see her teaching evaluations on ratemyprofessor.com. She would like you to note that she’s been tagged as “hilarious.” Twice.
Lately, my social media has been blowing up with stories about gender bias in higher ed, especially course evaluations. As a 30-something, female math professor, I’m personally invested in this kind of issue. So I’m gratified when I read about well-designed studies that highlight the “vagina tax” in teaching (I didn’t coin this phrase, but I wish I had).
These kinds of studies bring the conversation about bias to the table in a way that academics can understand. We can geek out on experimental design, the fact that the research is peer-reviewed and therefore passes some basic legitimacy tests.
Indeed, the conversation finally moves out of the realm of folklore, where we have “known” for some time that students expect women to be nurturing in addition to managing the class, while men just need to keep class on track.
Let me reiterate: as a young woman in academia, I want deans and chairs and presidents to take these observed phenomena seriously when evaluating their professors. I want to talk to my colleagues and my students about these issues. Eventually, I’d like to “fix” them, or at least game them to my advantage. (Just kidding. I’d rather fix them.)
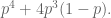
However, let me speak as a mathematician for a minute here: bad interpretations of data don’t advance the cause. There’s beautiful link-bait out there that justifies its conclusions on the flimsy “hey, look at this chart” understanding of big data. Benjamin M. Schmidt created a really beautiful tool to visualize data he scraped from the website ratemyprofessor.com through a process that he sketches on his blog. The best criticisms and caveats come from Schmidt himself.
What I want to examine is the response to the tool, both in the media and among my colleagues. USAToday, HuffPo, and other sites have linked to it, citing it as yet more evidence to support the folklore: students see men as “geniuses” and women as “bossy.” It looks like they found some screenshots (or took a few) and decided to interpret them as provocatively as possible. After playing with the tool for a few minutes, which wasn’t even hard enough to qualify as sleuthing, I came to a very different conclusion.
If you look at the ratings for “genius” and then break them down further to look at positive and negative reviews separately, it occurs predominantly in negative reviews. I found a few specific reviews, and they read, “you have to be a genius to pass” or along those lines.
[Don’t take my word for it — search google for:
rate my professors “you have to be a genius”‘
and you’ll see how students use the word “genius” in reviews of professors. The first page of hits is pretty much all men.]
Here’s the breakdown for “genius”:

So yes, the data shows that students are using the word “genius” in more evaluations of men than women. But there’s not a lot to conclude from this; we can’t tell from the data if the student is praising the professor or damning him. All we can see that it’s a word that occurs in negative reviews more often than positive ones. From the data, we don’t even know if it refers to the professor or not.
Similar results occur with “brilliant”:

Now check out “bossy” and negative reviews:

Okay, wow, look at how far to the right those orange dots are… and now look at the x-axis. We’re talking about fewer than 5 uses per million words of text. Not exactly significant compared to some of the other searches you can do.
I thought that the phrase “terrible teacher” was more illuminating, because it’s more likely in reference to the subject of the review, and we’ve got some meaningful occurrences:
And yes, there is a gender imbalance, but it’s not as great as I had feared. I’m more worried about the disciplinary break down, actually. Check out math — we have the worst teachers, but we spread it out across genders, with men ranking 187 uses of “terrible teacher” per million words; women score 192. Compare to psychology, where profs receive a score of 110. Ouch.
Who’s doing this reporting, and why aren’t we reading these reports more critically? Journalists, get your shit together and report data responsibly. Academics, be a little more skeptical of stories that simply post screenshots of a chart coupled with inciting prose from conclusions drawn, badly, from hastily scanned data.
Is this tool useless? No. Is it fun to futz around with? Yes.
Is it being reported and understood well? Resounding no!
I think even our students would agree with me: that’s just f*cked up.
What would a data-driven Congress look like?
Recently I’ve seen two very different versions of what a more data-driven Congress would look like, both emerging from the recent cruddy Cromnibus bill mess.
First, there’s this Bloomberg article, written by the editors, about using data to produce evidence on whether a given policy is working or not. Given what I know about how data is produced, and how definitions of success are politically manipulated, I don’t have much hope for this idea.
Second, there was a reader’s comments on this New York Times article, also about the Cromnibus bill. Namely, the reader was calling on the New York Times to not only explore a few facts about what was contained in the bill, but lay it out with more numbers and more consistency. I think this is a great idea. What if, when Congress gave us a shitty bill, we could see stuff like:
- how much money is allocated to each thing, both raw dollars and as a percentage of the whole bill,
- who put it in the omnibus bill,
- the history of that proposed spending, and the history of voting,
- which lobbyists were pushing it, and who gets paid by them, and ideally
- all of this would be in an easy-to-use interactive.
That’s the kind of data that I’d love to see. Data journalism is an emerging field, and we might not be there yet, but it’s something to strive for.
Fairness, accountability, and transparency in big data models
As I wrote about already, last Friday I attended a one day workshop in Montreal called FATML: Fairness, Accountability, and Transparency in Machine Learning. It was part of the NIPS conference for computer science, and there were tons of nerds there, and I mean tons. I wanted to give a report on the day, as well as some observations.
First of all, I am super excited that this workshop happened at all. When I left my job at Intent Media in 2011 with the intention of studying these questions and eventually writing a book about them, they were, as far as I know, on nobody’s else’s radar. Now, thanks to the organizers Solon and Moritz, there are communities of people, coming from law, computer science, and policy circles, coming together to exchange ideas and strategies to tackle the problems. This is what progress feels like!
OK, so on to what the day contained and my copious comments.
Hannah Wallach
Sadly, I missed the first two talks, and an introduction to the day, because of two airplane cancellations (boo American Airlines!). I arrived in the middle of Hannah Wallach’s talk, the abstract of which is located here. Her talk was interesting, and I liked her idea of having social scientists partnered with data scientists and machine learning specialists, but I do want to mention that, although there’s a remarkable history of social scientists working within tech companies – say at Bell Labs and Microsoft and such – we don’t see that in finance at all, nor does it seem poised to happen. So in other words, we certainly can’t count on social scientists to be on hand when important mathematical models are getting ready for production.
Also, I liked Hannah’s three categories of models: predictive, explanatory, and exploratory. Even though I don’t necessarily think that a given model will fall neatly into one category or the other, they still give you a way to think about what we do when we make models. As an example, we think of recommendation models as ultimately predictive, but they are (often) predicated on the ability to understand people’s desires as made up of distinct and consistent dimensions of personality (like when we use PCA or something equivalent). In this sense we are also exploring how to model human desire and consistency. For that matter I guess you could say any model is at its heart an exploration into whether the underlying toy model makes any sense, but that question is dramatically less interesting when you’re using linear regression.
Anupam Datta and Michael Tschantz
Next up Michael Tschantz reported on work with Anupam Datta that they’ve done on Google profiles and Google ads. The started with google’s privacy policy, which I can’t find but which claims you won’t receive ads based on things like your health problems. Starting with a bunch of browsers with no cookies, and thinking of each of them as fake users, they did experiments to see what actually happened both to the ads for those fake users and to the google ad profiles for each of those fake users. They found that, at least sometimes, they did get the “wrong” kind of ad, although whether Google can be blamed or whether the advertiser had broken Google’s rules isn’t clear. Also, they found that fake “women” and “men” (who did not differ by any other variable, including their searches) were offered drastically different ads related to job searches, with men being offered way more ads to get $200K+ jobs, although these were basically coaching sessions for getting good jobs, so again the advertisers could have decided that men are more willing to pay for such coaching.
An issue I enjoyed talking about was brought up in this talk, namely the question of whether such a finding is entirely evanescent or whether we can call it “real.” Since google constantly updates its algorithm, and since ad budgets are coming and going, even the same experiment performed an hour later might have different results. In what sense can we then call any such experiment statistically significant or even persuasive? Also, IRL we don’t have clean browsers, so what happens when we have dirty browsers and we’re logged into gmail and Facebook? By then there are so many variables it’s hard to say what leads to what, but should that make us stop trying?
From my perspective, I’d like to see more research into questions like, of the top 100 advertisers on Google, who saw the majority of the ads? What was the economic, racial, and educational makeup of those users? A similar but different (because of the auction) question would be to reverse-engineer the advertisers’ Google ad targeting methodologies.
Finally, the speakers mentioned a failure on Google’s part of transparency. In your advertising profile, for example, you cannot see (and therefore cannot change) your marriage status, but advertisers can target you based on that variable.
Sorelle Friedler, Carlos Scheidegger, and Suresh Venkatasubramanian
Next up we had Sorelle talk to us about her work with two guys with enormous names. They think about how to make stuff fair, the heart of the question of this workshop.
First, if we included race in, a resume sorting model, we’d probably see negative impact because of historical racism. Even if we removed race but included other attributes correlated with race (say zip code) this effect would remain. And it’s hard to know exactly when we’ve removed the relevant attributes, but one thing these guys did was define that precisely.
Second, say now you have some idea of the categories that are given unfair treatment, what can you do? One thing suggested by Sorelle et al is to first rank people in each category – to assign each person a percentile in their given category – and then to use the “forgetful function” and only consider that percentile. So, if we decided at a math department that we want 40% women graduate students, to achieve this goal with this method we’d independently rank the men and women, and we’d offer enough spots to top women to get our quota and separately we’d offer enough spots to top men to get our quota. Note that, although it comes from a pretty fancy setting, this is essentially affirmative action. That’s not, in my opinion, an argument against it. It’s in fact yet another argument for it: if we know women are systemically undervalued, we have to fight against it somehow, and this seems like the best and simplest approach.
Ed Felten and Josh Kroll
After lunch Ed Felton and Josh Kroll jointly described their work on making algorithms accountable. Basically they suggested a trustworthy and encrypted system of paper trails that would support a given algorithm (doesn’t really matter which) and create verifiable proofs that the algorithm was used faithfully and fairly in a given situation. Of course, we’d really only consider an algorithm to be used “fairly” if the algorithm itself is fair, but putting that aside, this addressed the question of whether the same algorithm was used for everyone, and things like that. In lawyer speak, this is called “procedural fairness.”
So for example, if we thought we could, we might want to turn the algorithm for punishment for drug use through this system, and we might find that the rules are applied differently to different people. This algorithm would catch that kind of problem, at least ideally.
David Robinson and Harlan Yu
Next up we talked to David Robinson and Harlan Yu about their work in Washington D.C. with policy makers and civil rights groups around machine learning and fairness. These two have been active with civil rights group and were an important part of both the Podesta Report, which I blogged about here, and also in drafting the Civil Rights Principles of Big Data.
The question of what policy makers understand and how to communicate with them came up several times in this discussion. We decided that, to combat cherry-picked examples we see in Congressional Subcommittee meetings, we need to have cherry-picked examples of our own to illustrate what can go wrong. That sounds bad, but put it another way: people respond to stories, especially to stories with innocent victims that have been wronged. So we are on the look-out.
Closing panel with Rayid Ghani and Foster Provost
I was on the closing panel with Rayid Ghani and Foster Provost, and we each had a few minutes to speak and then there were lots of questions and fun arguments. To be honest, since I was so in the moment during this panel, and also because I was jonesing for a beer, I can’t remember everything that happened.
As I remember, Foster talked about an algorithm he had created that does its best to “explain” the decisions of a complicated black box algorithm. So in real life our algorithms are really huge and messy and uninterpretable, but this algorithm does its part to add interpretability to the outcomes of that huge black box. The example he gave was to understand why a given person’s Facebook “likes” made a black box algorithm predict they were gay: by displaying, in order of importance, which likes added the most predictive power to the algorithm.
[Aside, can anyone explain to me what happens when such an algorithm comes across a person with very few likes? I’ve never understood this very well. I don’t know about you, but I have never “liked” anything on Facebook except my friends’ posts.]
Rayid talked about his work trying to develop a system for teachers to understand which students were at risk of dropping out, and for that system to be fair, and he discussed the extent to which that system could or should be transparent.
Oh yeah, and that reminds me that, after describing my book, we had a pretty great argument about whether credit scoring models should be open source, and what that would mean, and what feedback loops that would engender, and who would benefit.
Altogether a great day, and a fantastic discussion. Thanks again to Solon and Moritz for their work in organizing it.
Video cameras won’t solve the #EricGarner situation, but they will help
As many thoughtful people have pointed out already, Eric Garner’s case proves that video evidence is not a magic bullet to combat and punish undue police brutality. The Grand Jury deemed such evidence insufficient for an indictment, even if the average person watching the video cannot understand that point of view.
Even so, it would be a mistake to dismiss video cameras on police as entirely a bad idea. We shouldn’t assume no progress could be made simply because there’s an example which lets us down. I am no data evangelist, but neither am I someone who dismisses data. It can be powerful and we should use its power when we can.
And before I try to make the general case for video cameras on cops, let me make one other point. The Eric Garner video has already made progress in one arena, namely public opinion. Without the video, we wouldn’t be seeing nationwide marches protesting the outrageous police conduct.
A few of my data nerd thoughts:
- If cops were required to wear cameras, we’d have more data. We should think of that as building evidence, with the potential to use it to sway grand juries, criminal juries, judges, or public opinion.
- One thing I said time after time to my students this summer at the data journalism program I directed is the following: a number by itself is usually meaningless. What we need is to compare that number to a baseline. The baseline could be the average number for a population, or the median, or some range of 5th to 95th percentiles, or how it’s changed over time, or whatnot. But in order to gauge any baseline you need data.
- So in the case of police videotapes, we’d need to see how cops usually handle a situation, or how cops from other precincts handle similar situations, or the extremes of procedures in such situations, or how police have changed their procedures over time. And if we think the entire approach is heavy handed, we can also compare the data to the police manual, or to other countries, or what have you. More data is better for understanding aggregate approaches, and aggregate understanding makes it easier to fit a given situation into context.
- Finally, the cameras might also change their behavior when they are policing, knowing they are being taped. That’s believable but we shouldn’t depend on it.
- And also, we have to be super careful about how we use video evidence, and make sure it isn’t incredibly biased due to careful and unfair selectivity by the police. So, some cops are getting in trouble for turning off their cameras at critical moments, or not turning them on ever.
Let’s take a step back and think about how large-scale data collection and mining works, for example in online advertising. A marketer collects a bunch of data. And knowing a lot about one person doesn’t necessarily help them, but if they know a lot about most people, it statistically speaking does help them sell stuff. A given person might not be in the mood to buy, or might be broke, but if you dangle desirable good in front of a whole slew of people, you make sales. It’s a statistical play which, generally speaking, works.
In this case, we are the marketer, and the police are the customers. We want a lot of information about how they do their job so when the time comes we have some sense of “normal police behavior” and something to compare a given incident to or a given cop to. We want to see how they do or don’t try to negotiate peace, and with whom. We want to see the many examples of good and great policing as well as the few examples of terrible, escalating policing.
Taking another step back, if the above analogy seems weird, there’s a reason for that. In general data is being collected on the powerless, on the consumers, on the citizens, or the job applicants, and we should be pushing for more and better data to be collected instead on the powerful, on the police, on the corporations, and on the politicians. There’s a reason there is a burgeoning privacy industry for rich and powerful people.
For example, we want to know how many people have been killed by the police, but even a statistic that important is incredibly hard to come by (see this and this for more on that issue). However, it’s never been easier for the police to collect data on us and act on suspicions of troublemakers, however that is defined.
Another example – possibly the most extreme example of all – comes this very week from the reports on the CIA and torture. That is data and evidence we should have gotten much earlier, and as the New York Times demands, we should be able to watch videos of waterboarding and decide for ourselves whether it constitutes torture.
So yes, let’s have video cameras on every cop. It is not a panacea, and we should not expect it to solve our problems over night. In fact video evidence, by itself, will not solve any problem. We should think it as a mere evidence collecting device, and use it in the public discussion of how the most powerful among us treat the least powerful. But more evidence is better.
Finally, there’s the very real question of who will have access to the video footage, and whether the public will be allowed to see it at all. It’s a tough question, which will take a while to sort out (FOIL requests!), but until then, everyone should know that it is perfectly legal to videotape police in every place in this country. So go ahead and make a video with your camera when you suspect weird behavior.
De-anonymizing what used to be anonymous: NYC taxicabs
Thanks to Artem Kaznatcheev, I learned yesterday about the recent work of Anthony Tockar in exploring the field of anonymization and deanonymization of datasets.
Specifically, he looked at the 2013 cab rides in New York City, which was provided under a FOIL request, and he stalked celebrities Bradley Cooper and Jessica Alba (and discovered that neither of them tipped the cabby). He also stalked a man who went to a slew of NYC titty bars: found out where the guy lived and even got a picture of him.
Previously, some other civic hackers had identified the cabbies themselves, because the original dataset had scrambled the medallions, but not very well.
The point he was trying to make was that we should not assume that “anonymized” datasets actually protect privacy. Instead we should learn how to use more thoughtful approaches to anonymizing stuff, and he proposes a method called “differential privacy,” which he explains here. It involves adding noise to the data, in a certain way, so that at the end any given person doesn’t risk too much of their own privacy by being included in the dataset versus being not included in the dataset.
Bottomline, it’s actually pretty involved mathematically, and although I’m a nerd and it doesn’t intimidate me, it does give me pause. Here are a few concerns:
- It means that most people, for example the person in charge of fulfilling FOIL requests, will not actually understand the algorithm.
- That means that, if there’s a requirement that such a procedure is used, that person will have to use and trust a third party to implement it. This leads to all sorts of problems in itself.
- Just to name one, depending on what kind of data it is, you have to implement differential privacy differently. There’s no doubt that a complicated mapping of datatype to methodology will be screwed up when the person doing it doesn’t understand the nuances.
- Here’s another: the third party may not be trustworthy and may have created a backdoor.
- Or they just might get it wrong, or do something lazy that doesn’t actually work, and they can get away with it because, again, the user is not an expert and cannot accurately evaluate their work.
Altogether I’m imagining that this is at best an expensive solution for very important datasets, and won’t be used for your everyday FOIL requests like taxicab rides unless the culture around privacy changes dramatically.
Even so, super interesting and important work by Anthony Tockar. Also, if you think that’s cool, take a look at my friend Luis Daniel‘s work on de-anonymizing the Stop & Frisk data.
People hate me, I must be doing something right
Not sure if you’ve seen this recent New York Times article entitled Learning to Love Criticism, but go ahead and read it if you haven’t. The key figures:
…76 percent of the negative feedback given to women included some kind of personality criticism, such as comments that the woman was “abrasive,” “judgmental” or “strident.” Only 2 percent of men’s critical reviews included negative personality comments.
This is so true! I re-re-learned this recently (again) when I started podcasting on Slate and the iTunes reviews of the show included attacks on me personally. For example: “Felix is great but Cathy is just annoying… and is not very interesting on anything” as well as “The only problem seems to be Cathy O’Neill who doesn’t have anything to contribute to the conversation…”
By contrast the men on the show, Jordan and Felix, are never personally attacked, although Felix is sometimes criticized for interrupting people, mostly me. In other words, I have some fans too. I am divisive.
So, what’s going on here?
Well, I have a thick skin already, partly from blogging and partly from being in men’s fields all my life, and partly just because I’m an alpha female. So what that means is that I know that it’s not really about me when people anonymously complain that I’m annoying or dumb. To be honest, when I see something like that, which isn’t a specific criticism that might help me get better but is rather a vague attack on my character, I immediately discount it as sexism if not misogyny, and I feel pity for the women in that guy’s life. Sometimes I also feel pity for the guy too, because he’s stunted and that’s sad.
But there’s one other thing I conclude when I piss people off: that I’m getting under their skin, which means what I’m saying is getting out there, to a wider audience than just people who already agree with me, and if that guy hates me then maybe 100 other people are listening and not quite hating me. They might even be agreeing with me. They might even be changing their minds about some things because of my arguments.
So, I realize this sounds twisted, but when people hate me, I feel like I must be doing something right.
One other thing I’ll say, which the article brings up. It is a luxury indeed to be a woman who can afford to be hated. I am not at risk, or at least I don’t feel at all at risk, when other people hate me. They are entitled to hate me, and I don’t need to bother myself about getting them to like me. It’s a deep and wonderful fact about our civilization that I can say that, and I am very glad to be living here and now, where I can be a provocative and opinionated intellectual woman.
Fuck yes! Let’s do this, people! Let’s have ideas and argue about them and disagree! It’s what freedom is all about.
Women not represented in clinical trials
This recent NYTimes article entitled Health Researchers Will Get $10.1 Million to Counter Gender Bias in Studies spelled out a huge problem that kind of blows me away as a statistician (and as a woman!).
Namely, they have recently decided over at the NIH, which funds medical research in this country, that we should probably check to see how women’s health are affected by drugs, and not just men’s. They’ve decided to give “extra money” to study this special group, namely females.
Here’s the bizarre and telling explanation for why most studies have focused on men and excluded women:
Traditionally many investigators have worked only with male lab animals, concerned that the hormonal cycles of female animals would add variability and skew study results.
Let’s break down that explanation, which I’ve confirmed with a medical researcher is consistent with the culture.
If you are afraid that women’s data would “skew study results,” that means you think the “true result” is the result that works for men. Because adding women’s data would add noise to the true signal, that of the men’s data. What?! It’s an outrageous perspective. Let’s take another look at this reasoning, from the article:
Scientists often prefer single-sex studies because “it reduces variability, and makes it easier to detect the effect that you’re studying,” said Abraham A. Palmer, an associate professor of human genetics at the University of Chicago. “The downside is that if there is a difference between male and female, they’re not going to know about it.”
Ummm… yeah. So instead of testing the effect on women, we just go ahead and optimize stuff for men and let women just go ahead and suffer the side effects of the treatment we didn’t bother to study. After all, women only comprise 50.8% of the population, they won’t mind.
This is even true for migraines, where 2/3rds of migraine sufferers are women.
One reason they like to exclude women: they have periods, and they even sometimes get pregnant, which is confusing for people who like to have clean statistics (on men’s health). In fact my research contact says that traditionally, this bias towards men in clinical trials was said to protect women because they “could get pregnant” and then they’d be in a clinical trial while pregnant. OK.
I’d like to hear more about who is and who isn’t in clinical trials, and why.
The business of public education
I’ve been writing my book, and I’m on chapter 4 right now, which is tentatively entitled Feedback Loops In Education. I’m studying the enormous changes in primary and secondary education that have occurred since the “data-driven” educational reform movement started with No Child Left Behind in 2001.
Here’s the issue I’m having writing this chapter. Things have really changed in the last 13 years, it’s really incredible how much money and politics – and not education – are involved. In fact I’m finding it difficult to write the chapter without sounding like a wingnut conspiracy theorist. Because that’s how freaking nuts things are right now.
On the one hand you have the people who believe in the promise of educational data. They are often pro-charter schools, anti-tenure, anti-union, pro-testing, and are possibly personally benefitting from collecting data about children and then sold to commercial interests. Privacy laws are things to bypass for these people, and the way they think about it is that they are going to improve education with all this amazing data they’re collecting. Because, you know, it’s big data, so it has to be awesome. They see No Child Left Behind and Race To The Top as business opportunities.
On the other hand you have people who do not believe in the promise of educational data. They believe in public education, and are maybe even teachers themselves. They see no proven benefits of testing, or data collection and privacy issues for students, and they often worry about job security, and public shaming and finger-pointing, and the long term consequences on children and teachers of this circus of profit-seeking “educational” reformers. Not to mention that none of this recent stuff is addressing the very real problems we have.
As it currently stands, I’m pretty much part of the second group. There just aren’t enough data skeptics in the first group to warrant my respect, and there’s way too much money and secrecy around testing and “value-added models.” And the politics of the anti-tenure case are ugly and I say that even though I don’t think teacher union leaders are doing themselves many favors.
But here’s the thing, it’s not like there could never be well-considered educational experiments that use data and have strict privacy measures in place, the results of which are not saved to individual records but are lessons learned for educators, and, it goes without saying, are strictly non-commercial. There is a place for testing, but not as a punitive measure but rather as a way of finding where there are problems and devoting resources to it. The current landscape, however, is so split and so acrimonious, it’s kind of impossible to imagine something reasonable happening.
It’s too bad, this stuff is important.
Christian Rudder’s Dataclysm
Here’s what I’ve spent the last couple of days doing: alternatively reading Christian Rudder’s new book Dataclysm and proofreading a report by AAPOR which discusses the benefits, dangers, and ethics of using big data, which is mostly “found” data originally meant for some other purpose, as a replacement for public surveys, with their carefully constructed data collection processes and informed consent. The AAPOR folk have asked me to provide tangible examples of the dangers of using big data to infer things about public opinion, and I am tempted to simply ask them all to read Dataclysm as exhibit A.
Rudder is a co-founder of OKCupid, an online dating site. His book mainly pertains to how people search for love and sex online, and how they represent themselves in their profiles.
Here’s something that I will mention for context into his data explorations: Rudder likes to crudely provoke, as he displayed when he wrote this recent post explaining how OKCupid experiments on users. He enjoys playing the part of the somewhat creepy detective, peering into what OKCupid users thought was a somewhat private place to prepare themselves for the dating world. It’s the online equivalent of a video camera in a changing booth at a department store, which he defended not-so-subtly on a recent NPR show called On The Media, and which was written up here.
I won’t dwell on that aspect of the story because I think it’s a good and timely conversation, and I’m glad the public is finally waking up to what I’ve known for years is going on. I’m actually happy Rudder is so nonchalant about it because there’s no pretense.
Even so, I’m less happy with his actual data work. Let me tell you why I say that with a few examples.
Who are OKCupid users?
I spent a lot of time with my students this summer saying that a standalone number wouldn’t be interesting, that you have to compare that number to some baseline that people can understand. So if I told you how many black kids have been stopped and frisked this year in NYC, I’d also need to tell you how many black kids live in NYC for you to get an idea of the scope of the issue. It’s a basic fact about data analysis and reporting.
When you’re dealing with populations on dating sites and you want to conclude things about the larger culture, the relevant “baseline comparison” is how well the members of the dating site represent the population as a whole. Rudder doesn’t do this. Instead he just says there are lots of OKCupid users for the first few chapters, and then later on after he’s made a few spectacularly broad statements, on page 104 he compares the users of OKCupid to the wider internet users, but not to the general population.
It’s an inappropriate baseline, made too late. Because I’m not sure about you but I don’t have a keen sense of the population of internet users. I’m pretty sure very young kids and old people are not well represented, but that’s about it. My students would have known to compare a population to the census. It needs to happen.
How do you collect your data?
Let me back up to the very beginning of the book, where Rudder startles us by showing us that the men that women rate “most attractive” are about their age whereas the women that men rate “most attractive” are consistently 20 years old, no matter how old the men are.
Actually, I am projecting. Rudder never actually specifically tells us what the rating is, how it’s exactly worded, and how the profiles are presented to the different groups. And that’s a problem, which he ignores completely until much later in the book when he mentions that how survey questions are worded can have a profound effect on how people respond, but his target is someone else’s survey, not his OKCupid environment.
Words matter, and they matter differently for men and women. So for example, if there were a button for “eye candy,” we might expect women to choose more young men. If my guess is correct, and the term in use is “most attractive”, then for men it might well trigger a sexual concept whereas for women it might trigger a different social construct; indeed I would assume it does.
Since this isn’t a porn site, it’s a dating site, we are not filtering for purely visual appeal; we are looking for relationships. We are thinking beyond what turns us on physically and asking ourselves, who would we want to spend time with? Who would our family like us to be with? Who would make us be attractive to ourselves? Those are different questions and provoke different answers. And they are culturally interesting questions, which Rudder never explores. A lost opportunity.
Next, how does the recommendation engine work? I can well imagine that, once you’ve rated Profile A high, there is an algorithm that finds Profile B such that “people who liked Profile A also liked Profile B”. If so, then there’s yet another reason to worry that such results as Rudder described are produced in part as a result of the feedback loop engendered by the recommendation engine. But he doesn’t explain how his data is collected, how it is prompted, or the exact words that are used.
Here’s a clue that Rudder is confused by his own facile interpretations: men and women both state that they are looking for relationships with people around their own age or slightly younger, and that they end up messaging people slightly younger than they are but not many many years younger. So forty year old men do not message twenty year old women.
Is this sad sexual frustration? Is this, in Rudder’s words, the difference between what they claim they want and what they really want behind closed doors? Not at all. This is more likely the difference between how we live our fantasies and how we actually realistically see our future.
Need to control for population
Here’s another frustrating bit from the book: Rudder talks about how hard it is for older people to get a date but he doesn’t correct for population. And since he never tells us how many OKCupid users are older, nor does he compare his users to the census, I cannot infer this.
Here’s a graph from Rudder’s book showing the age of men who respond to women’s profiles of various ages:

We’re meant to be impressed with Rudder’s line, “for every 100 men interested in that twenty year old, there are only 9 looking for someone thirty years older.” But here’s the thing, maybe there are 20 times as many 20-year-olds as there are 50-year-olds on the site? In which case, yay for the 50-year-old chicks? After all, those histograms look pretty healthy in shape, and they might be differently sized because the population size itself is drastically different for different ages.
Confounding
One of the worst examples of statistical mistakes is his experiment in turning off pictures. Rudder ignores the concept of confounders altogether, which he again miraculously is aware of in the next chapter on race.
To be more precise, Rudder talks about the experiment when OKCupid turned off pictures. Most people went away when this happened but certain people did not:

Some of the people who stayed on went on a “blind date.” Those people, which Rudder called the “intrepid few,” had a good time with people no matter how unattractive they were deemed to be based on OKCupid’s system of attractiveness. His conclusion: people are preselecting for attractiveness, which is actually unimportant to them.
But here’s the thing, that’s only true for people who were willing to go on blind dates. What he’s done is select for people who are not superficial about looks, and then collect data that suggests they are not superficial about looks. That doesn’t mean that OKCupid users as a whole are not superficial about looks. The ones that are just got the hell out when the pictures went dark.
Race
This brings me to the most interesting part of the book, where Rudder explores race. Again, it ends up being too blunt by far.
Here’s the thing. Race is a big deal in this country, and racism is a heavy criticism to be firing at people, so you need to be careful, and that’s a good thing, because it’s important. The way Rudder throws it around is careless, and he risks rendering the term meaningless by not having a careful discussion. The frustrating part is that I think he actually has the data to have a very good discussion, but he just doesn’t make the case the way it’s written.
Rudder pulls together stats on how men of all races rate women of all races on an attractiveness scale of 1-5. It shows that non-black men find their own race attractive and non-black men find black women, in general, less attractive. Interesting, especially when you immediately follow that up with similar stats from other U.S. dating sites and – most importantly – with the fact that outside the U.S., we do not see this pattern. Unfortunately that crucial fact is buried at the end of the chapter, and instead we get this embarrassing quote right after the opening stats:
And an unintentionally hilarious 84 percent of users answered this match question:
Would you consider dating someone who has vocalized a strong negative bias toward a certain race of people?
in the absolute negative (choosing “No” over “Yes” and “It depends”). In light of the previous data, that means 84 percent of people on OKCupid would not consider dating someone on OKCupid.
Here Rudder just completely loses me. Am I “vocalizing” a strong negative bias towards black women if I am a white man who finds white women and asian women hot?
Especially if you consider that, as consumers of social platforms and sites like OKCupid, we are trained to rank all the products we come across to ultimately get better offerings, it is a step too far for the detective on the other side of the camera to turn around and point fingers at us for doing what we’re told. Indeed, this sentence plunges Rudder’s narrative deeply into the creepy and provocative territory, and he never fully returns, nor does he seem to want to. Rudder seems to confuse provocation for thoughtfulness.
This is, again, a shame. A careful conversation about the issues of what we are attracted to, what we can imagine doing, and how we might imagine that will look to our wider audience, and how our culture informs those imaginings, are all in play here, and could have been drawn out in a non-accusatory and much more useful way.
Student evaluations: very noisy data
I’ve been sent this recent New York Times article by a few people (thanks!). It’s called Grading Teachers, With Data From Class, and it’s about how standardized tests are showing themselves to be inadequate to evaluate teachers, so a Silicon Valley-backed education startup called Panorama is stepping into the mix with a data collection process focused on student evaluations.
Putting aside for now how much this is a play for collecting information about the students themselves, I have a few words to say about the signal which one gets from student evaluations. It’s noisy.
So, for example, I was a calculus teacher at Barnard, teaching students from all over the Columbia University community (so, not just women). I taught the same class two semesters in a row: first in Fall, then in Spring.
Here’s something I noticed. The students in the Fall were young (mostly first semester frosh), eager, smart, and hard-working. They loved me and gave me high marks on all categories, except of course for the few students who just hated math, who would typically give themselves away by saying “I hate math and this class is no different.”
The students in the Spring were older, less eager, probably just as smart, but less hard-working. They didn’t like me or the class. In particular, they didn’t like how I expected them to work hard and challenge themselves. The evaluations came back consistently less excited, with many more people who hated math.
I figured out that many of the students had avoided this class and were taking it for a requirement, didn’t want to be there, and it showed. And the result was that, although my teaching didn’t change remarkably between the two semesters, my evaluations changed considerably.
Was there some way I could have gotten better evaluations from that second group? Absolutely. I could have made the class easier. That class wanted calculus to be cookie-cutter, and didn’t particularly care about the underlying concepts and didn’t want to challenge themselves. The first class, by contrast, had loved those things.
My conclusion is that, once we add “get good student evaluations” to the mix of requirements for our country’s teachers, we are asking for them to conform to their students’ wishes, which aren’t always good. Many of the students in this country don’t like doing homework (in fact most!). Only some of them like to be challenged to think outside their comfort zone. We think teachers should do those things, but by asking them to get good student evaluations we might be preventing them from doing those things. A bad feedback loop would result.
I’m not saying teachers shouldn’t look at student evaluations; far from it, I always did and I found them useful and illuminating, but the data was very noisy. I’d love to see teachers be allowed to see these evaluations without there being punitive consequences.
The bad teacher conspiracy
Any time I see an article about the evaluation system for teachers in New York State, I wince. People get it wrong so very often. Yesterday’s New York Times article written by Elizabeth Harris was even worse than usual.
First, her wording. She mentioned a severe drop in student reading and math proficiency rates statewide and attributed it to a change in the test to the Common Core, which she described as “more rigorous.”
The truth is closer to “students were tested on stuff that wasn’t in their curriculum.” And as you can imagine, if you are tested on stuff you didn’t learn, your score will go down (the Common Core has been plagued by a terrible roll-out, and the timing of this test is Exhibit A). Wording like this matters, because Harris is setting up her reader to attribute the falling scores to bad teachers.
Harris ends her piece with a reference to a teacher-tenure lawsuit: ‘In one of those cases, filed in Albany in July, court documents contrasted the high positive teacher ratings with poor student performance, and called the new evaluation system “deficient and superficial.” The suit said those evaluations were the “most highly predictive measure of whether a teacher will be awarded tenure.”’
In other words, Harris is painting a picture of undeserving teachers sneaking into tenure in spite of not doing their job. It’s ironic, because I actually agree with the statement that the new evaluation system is “deficient and superficial,” but in my case I think it is overly punitive to teachers – overly random, really, since it incorporates the toxic VAM model – but in her framing she is implying it is insufficiently punitive.
Let me dumb Harris’s argument down even further: How can we have 26% English proficiency among students and 94% effectiveness among teachers?! Let’s blame the teachers and question the legitimacy of tenure.
Indeed, after reading the article I felt like looking into whether Harris is being paid by David Welch, the Silicon Valley dude who has vowed to fight teacher tenure nationwide. More likely she just doesn’t understand education and is convinced by simplistic reasoning.
In either case, she clearly needs to learn something about statistics. For that matter, so do other people who drag out this “blame the teacher” line whenever they see poor performance by students.
Because here’s the thing. Beyond obvious issues like switching the content of the tests away from the curriculum, standardized test scores everywhere are hugely dependent on the poverty levels of students. Some data:

It’s not just in this country, either:

Considering how many poor kids we have in the U.S., we are actually doing pretty well.
The conclusion is that, unless you think bad teachers have somehow taken over poor schools everywhere and booted out the good teachers, and good teachers have taken over rich schools everywhere and booted out the bad teachers (which is supposed to be impossible, right?), poverty has much more of an effect than teachers.
Just to clarify this reasoning, let me give you another example: we could blame bad journalists for lower rates of newspaper readership at a given paper, but since newspaper readership is going down everywhere we’d be blaming journalists for what is a cultural issue.
Or, we could develop a process by which we congratulate specific policemen for a reduced crime rate, but then we’d have to admit that crime is down all over the country.
I’m not saying there aren’t bad teachers, because I’m sure there are. But by only focusing on rooting out bad teachers, we are ignoring an even bigger and harder problem. And no, it won’t be solved by privatizing and corporatizing public schools. We need to address childhood poverty. Here’s one more visual for the road:

A decision tree for decision trees
For a while now I’ve been thinking I should build a decision tree for deciding which algorithm to use on a given data project. And yes, I think it’s kind of cool that “decision tree” would be an outcome on my decision tree. Kind of like a nerd pun.
I’m happy to say that I finally started work on my algorithm decision tree, thanks to this website called gliffy.com which allows me to build flowcharts with an easy online tool. It was one of those moments when I said to myself, this morning at 6am, “there should be a start-up that allows me to build a flowchart online! Let me google for that” and it totally worked. I almost feel like I willed gliffy.com into existence.
So here’s how far I’ve gotten this morning:

Not far! But I also learned how to use the tool.
I looked around the web to see if I’m doing something that’s already been done and I came up with this:
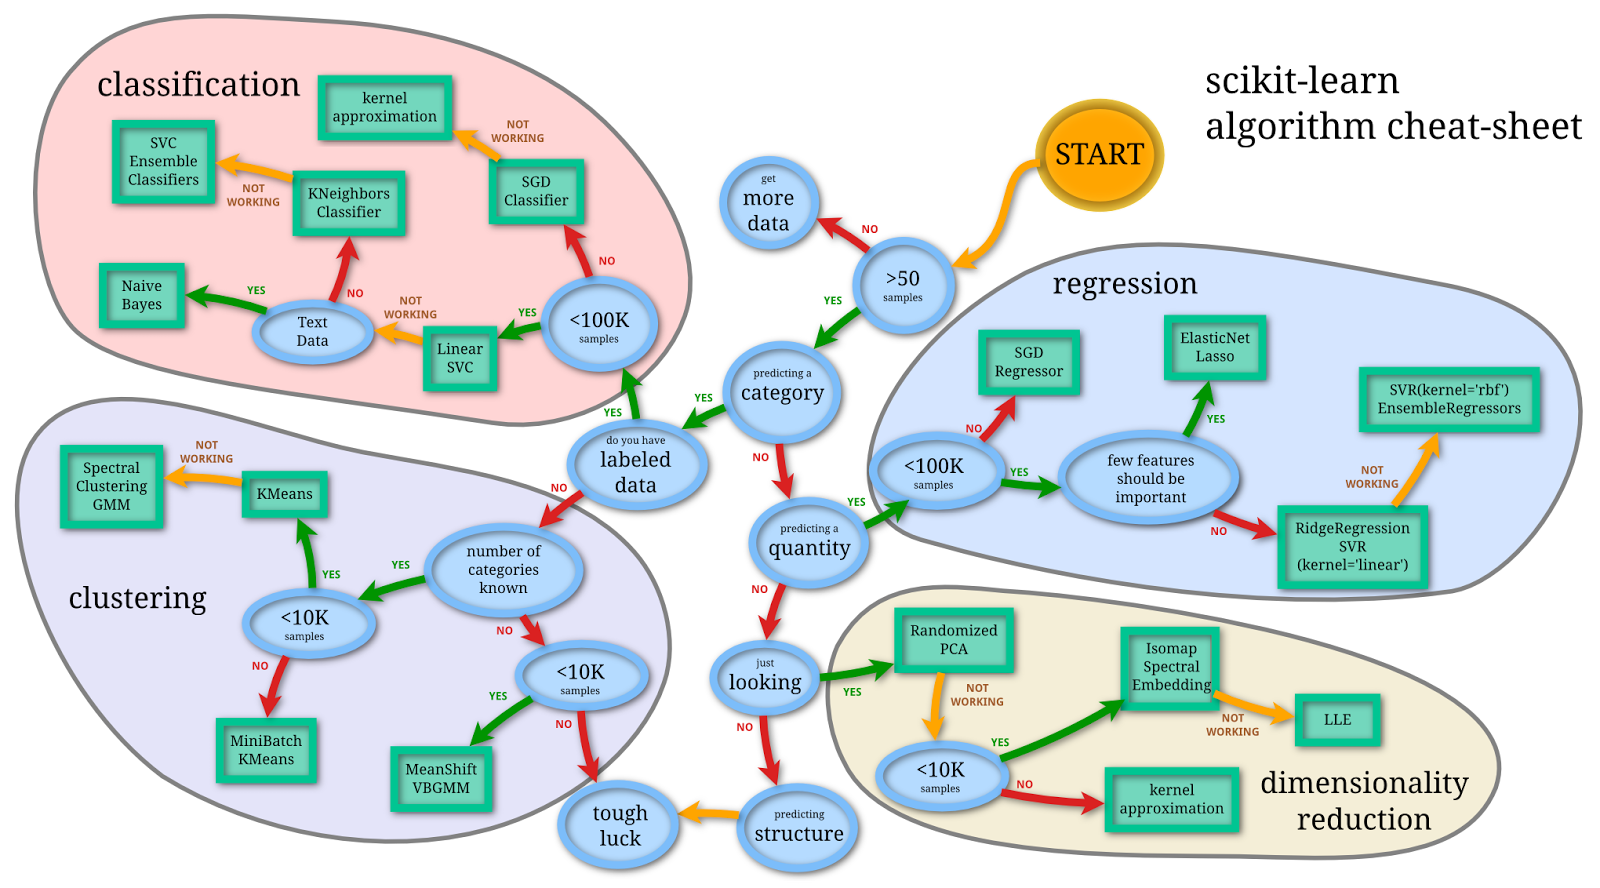
I appreciate the effort but this is way more focused on the size of the data than I intend to be, at least for now. And here’s another one that’s even less like the one I want to build but is still impressive.
Because here’s what I want to focus on: what kind of question are you answering with which algorithm? For example, with clustering algorithms you are, you know, grouping similar things together. That one’s easy, kind of, although plenty of projects have ended up being clustering or classifying algorithms whose motivating questions did not originally take on the form “how would we group these things together?”.
In other words, the process of getting at algorithms from questions is somewhat orthogonal to the normal way algorithms are introduced, and for that reason taking me some time to decide what the questions are that I need to ask in my decision tree. Right about now I’m wishing I had taken notes when my Lede Program students asked me to help them with their projects, because embedded in those questions were some great examples of data questions in search of an algorithm.
Please give me advice!
Love StackOverflow and MathOverflow? Now there’s StemForums!
Everyone I know who codes uses stackoverflow.com for absolutely everything.
Just yesterday I met a cool coding chick who was learning python and pandas (of course!) with the assistance of stackoverflow. It is exactly what you need to get stuff working, and it’s better than having a friend to ask, even a highly knowledgable friend, because your friend might be busy or might not know the answer, or even if your friend knew the answer her answer isn’t cut-and-paste-able.
If you are someone who has never used stackoverflow for help, then let me explain how it works. Say you want to know how to load a JSON file into python but you don’t want to write a script for that because you’re pretty sure someone already has. You just search for “import json into python” and you get results with vote counts:

Also, every math nerd I know uses and contributes to mathoverflow.net. It’s not just for math facts and questions, either, there are interesting discussions going on there all the time. Here’s an example of a comment in response to understanding the philosophy behind the claimed proof of the ABC Conjecture:

OK well hold on tight because now there’s a new online forum, but not about coding and not about math. It’s about all the other STEM subjects, which since we’ve removed math might need to be called STE subjects, which is not catchy.
It’s called stemforums.com, and it is being created by a team led by Gary Cornell, mathematician, publisher at Apress, and beloved Black Oak bookstore owner.
So far only statistics is open, but other stuff is coming very soon. Specifically it covers, or soon will cover, the following fields:
- Statistics
- Biology
- Chemistry
- Cognitive Sciences
- Computer Sciences
- Earth and Planetary Sciences
- Economics
- Science & Math Education
- Engineering
- History of Science and Mathematics
- Applied Mathematics, and
- Physics
I’m super excited for this site, it has serious potential to make peoples’ lives better. I wish it had a category for Data Sciences, and for Data Journalism, because I’d probably be more involved in those categories than most of the above, but then again most data science-y questions could be inserted into one of the above. I’ll try to be patient on this one.
Here’s a screen shot of an existing Stats question on the site:
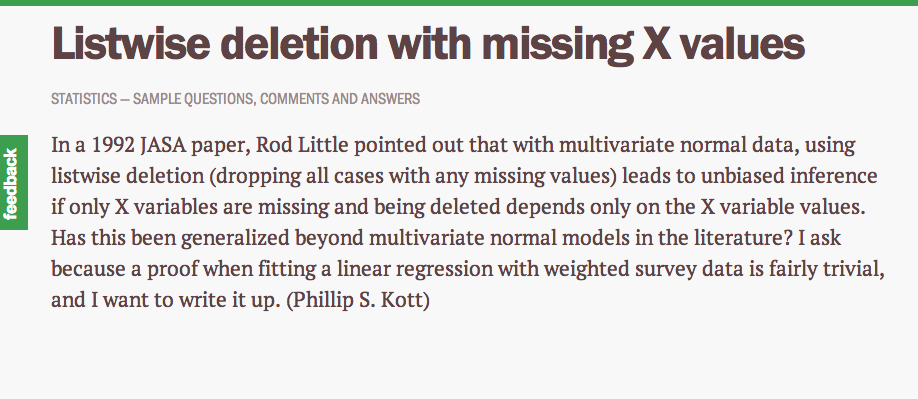 The site doesn’t have many questions, and even fewer answers, but as I understand it the first few people to get involved are eligible for Springer books, so go check it out.
The Platform starts today
Hey my class starts today, I’m totally psyched!
The syllabus is up on github here and I prepared an iPython notebook here showing how to do basic statistics in python, and culminating in an attempt to understand what a statistically significant but tiny difference means, in the context of the Facebook Emotion study. Here’s a useless screenshot which I’m including because I’m proud:

If you want to follow along install anaconda on your machine and type “ipython notebook –pylab inline” into a terminal. Then you can just download this notebook and run it!
Most of the rest of the classes will feature an awesome guest lecturer, and I’m hoping to blog about those talks with their permission, so stay tuned.


