Archive
A Pointed note on Martin Luther King, Jr Day

Three years ago I was out for a walk in Haiti when I met this boy who asked me to photograph him pointing to God. Aggrieved by the president’s recent disrespectful comments about Haiti, I am posting this as a reminder of what even the youngest of Haitian children know: There is a power higher than that of any president.
The Chef Shortage, Explained
This is a guest post by Sam Kanson-Benanav, a chef who has managed restaurants in Minnesota, Wisconsin, and New York City. He spent two years in the studying global resource marketplaces in the Amazon rainforest, and his favorite food is a french omelet.
Despite my desperate attempts at a career change, I’ve become fairly inured to the fact I work in one of the most job secure industries in America. And I’m not a tenured professor.
I am a professional restaurant person – cook, manager, server, and bartender (on nights when a bartender doesn’t show up). As a recent Washington Post article highlights: it has become increasingly more difficult for kitchens to staff their teams with proper talent. We could ponder a litany of reasons why talented cooks are not flocking to the kitchens, but if you prefer to stop reading now, just reference Mathbabe’s entirely accurate post on labor shortages.
Or, we could just pay cooks more. As it turns out, money is a very effective motivator, but restaurants employ two cannibalizing labor models based on fundamentally contrasting motivators: tipping and wages. I’ll take these on separately.
Tipping servers suppress wages for the kitchen
We already know tipping is a bad system, which bears less correlation to the actual quality of service you receive than to the color or gender of your server. It’s an external rewards based system akin to paying your employees a negligible wage with a constant cash bonus, a historically awful way to run a business.
In other words, restaurant owners are able to pass off the cost of labor for employing servers onto their consumers. That means they factor into their menu prices only the cost of labor for the kitchen, which remains considerable in the labor-intensive low margin restaurant world. Thankfully, we are all alcoholics and willing to pay 400% markups on our beer and only a 30% markup on our burgers. Nevertheless, the math here rarely works in a cook’s favor.
For a restaurant to remain a viable business, a cook (and dishwasher’s) hourly wage must be low, even as bartenders and servers walk away with considerable more cash.
In the event that a restaurant, under this conventional model, would like to raise its prices and better compensate its cooks, it cannot do so without also raising wages for its servers. Every dollar increase in the price of line item on your receipt increases a consumers cost by $1.20 , the server happily pocketing the difference.
Unfair? Yes. Inefficient? Certainly. Is change possible? Probably not.
Let’s assume change is possible
Some restaurants are doing away with this trend, in a worthy campaign to better price the cost of your meal, and compensate cooks more for their work. These restaurants charge a 20% administration fee, which becomes part of their combined revenue—the total pool of cash from which they can pay all their employees at set hourly rates.
That’s different then an automatic service fee you might find at the end of your bill at a higher end restaurant or when dining with a large group. It’s a pre tax charge that repackages the cost of a meal by charging a combined 30% tax on the consumer (8% sales tax on 20% service tax) allowing business owners to allocate funds for labor at their discretion rather than obligate them to give it all to service staff.
Under this model cooks now may make a stunning $15-18 an hour, up from $12-$13, and servers $20-30, which is yes, down from their previous wages. That’s wealth redistribution in the restaurant world! For unscrupulous business owners, it could also incentive further wealth suppression by minimizing the amount a 20% administration fee that is utilized for labor, as busier nights no longer translate into higher tips for the service staff.
I am a progressive minded individual who recognizes the virtue of (sorry server, but let’s face it) fairer wages. Nevertheless, I’m concerned the precedents we’ve set for ourselves will make unilateral redistribution a lofty task.
There is not much incentive for an experienced server to take a considerable pay cut. The outcome is likelier to blur the lines between who is a server and who is a cook, or, a dilution in the level of service generally.
Wage Growth
Indeed wages are rising in the food industry, but at a paltry average of $12.48 an hour, there’s considerable room for growth before cooking becomes a viable career choice for the creative minded and educated talent the industry thirsts for. Celebrity chefs may glamorize the industry, but their presence in the marketplace is more akin to celebrity than chef, and their salaries have little bearing on real wage growth of labor force.
Unlike most other industries, a cook’s best chance and long term financial security is to work their way into ownership. Cooking is not an ideal position to age into: the physicality of the work and hours only become more grueling, and your wages will not increase substantially with time. This all to say – if the restaurant industry wants more cooks, it needs to be willing to pay a higher price upfront for them. This is not just a New York problem complicated by sky high rents. It’s as real in Wisconsin as it is Manhattan.
Ultimately paying cooks more is a question of reconciling two contrasting payment models. That’s a question of redistribution.
But “whoa Sam – you are a not an economist, this is purely speculative!” you say?
Possibly, and so far at least a couple of restaurants have been able to maintain normal operations under these alternative models, but their actions alone are unlikely to fill the labor shortage we see. Whether we are ultimately willing to pay servers less or pay considerably more for our meals remains to be seen, but, for what its worth, I’m currently looking for a serving job and I can tell you a few places I’m not applying to.
Guest post: Open-Source Loan-Level Analysis of Fannie and Freddie
This is a guest post by Todd Schneider. You can read the full post with additional analysis on Todd’s personal site.
[M]ortgages were acknowledged to be the most mathematically complex securities in the marketplace. The complexity arose entirely out of the option the homeowner has to prepay his loan; it was poetic that the single financial complexity contributed to the marketplace by the common man was the Gordian knot giving the best brains on Wall Street a run for their money. Ranieri’s instincts that had led him to build an enormous research department had been right: Mortgages were about math.
The money was made, therefore, with ever more refined tools of analysis.
—Michael Lewis, Liar’s Poker (1989)
Fannie Mae and Freddie Mac began reporting loan-level credit performance data in 2013 at the direction of their regulator, the Federal Housing Finance Agency. The stated purpose of releasing the data was to “increase transparency, which helps investors build more accurate credit performance models in support of potential risk-sharing initiatives.”
The GSEs went through a nearly $200 billion government bailout during the financial crisis, motivated in large part by losses on loans that they guaranteed, so I figured there must be something interesting in the loan-level data. I decided to dig in with some geographic analysis, an attempt to identify the loan-level characteristics most predictive of default rates, and more. The code for processing and analyzing the data is all available on GitHub.
The “medium data” revolution
In the not-so-distant past, an analysis of loan-level mortgage data would have cost a lot of money. Between licensing data and paying for expensive computers to analyze it, you could have easily incurred costs north of a million dollars per year. Today, in addition to Fannie and Freddie making their data freely available, we’re in the midst of what I might call the “medium data” revolution: personal computers are so powerful that my MacBook Air is capable of analyzing the entire 215 GB of data, representing some 38 million loans, 1.6 billion observations, and over $7.1 trillion of origination volume. Furthermore, I did everything with free, open-source software.
What can we learn from the loan-level data?
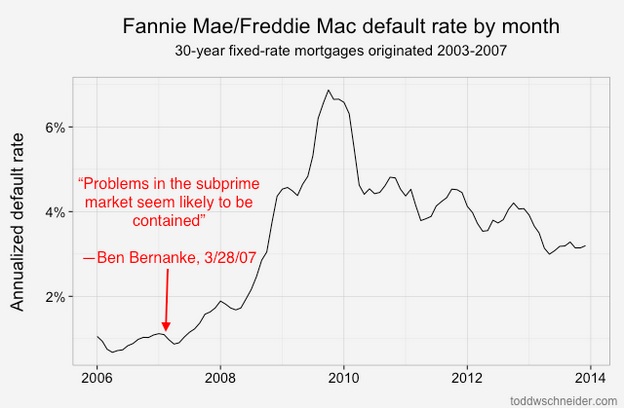
Loans originated from 2005-2008 performed dramatically worse than loans that came before them! That should be an extraordinarily unsurprising statement to anyone who was even slightly aware of the U.S. mortgage crisis that began in 2007:
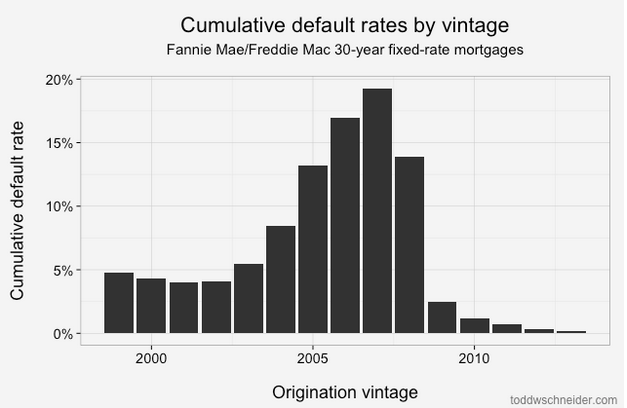
About 4% of loans originated from 1999 to 2003 became seriously delinquent at some point in their lives. The 2004 vintage showed some performance deterioration, and then the vintages from 2005 through 2008 show significantly worse performance: more than 15% of all loans originated in those years became distressed.
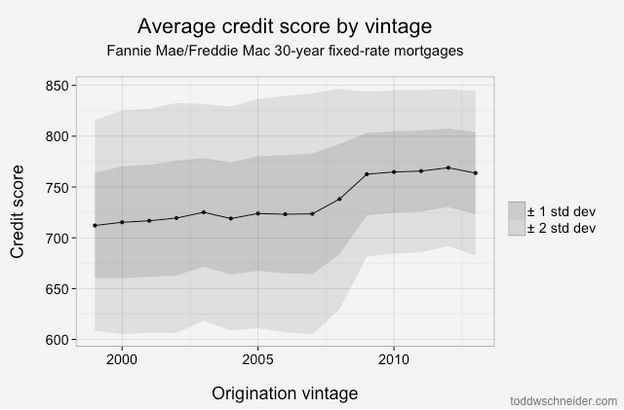
From 2009 through present, the performance has been much better, with fewer than 2% of loans defaulting. Of course part of that is that it takes time for a loan to default, so the most recent vintages will tend to have lower cumulative default rates while their loans are still young. But there has also been a dramatic shift in lending standards so that the loans made since 2009 have been much higher credit quality: the average FICO score used to be 720, but since 2009 it has been more like 765. Furthermore, if we look 2 standard deviations from the mean, we see that the low end of the FICO spectrum used to reach down to about 600, but since 2009 there have been very few loans with FICO less than 680:
Tighter agency standards, coupled with a complete shutdown in the non-agency mortgage market, including both subprime and Alt-A lending, mean that there is very little credit available to borrowers with low credit scores (a far more difficult question is whether this is a good or bad thing!).
Geographic performance
Default rates increased everywhere during the bubble years, but some states fared far worse than others. I took every loan originated between 2005 and 2007, broadly considered to be the height of reckless mortgage lending, bucketed loans by state, and calculated the cumulative default rate of loans in each state:
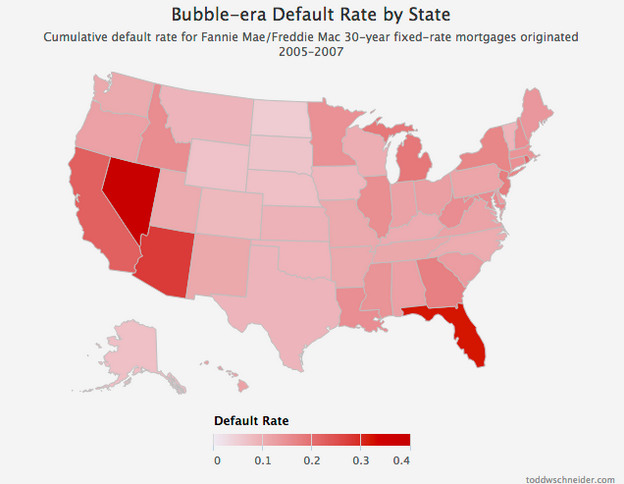
4 states in particular jump out as the worst performers: California, Florida, Arizona, and Nevada. Just about every state experienced significantly higher than normal default rates during the mortgage crisis, but these 4 states, often labeled the “sand states”, experienced the worst of it.
Read more
If you’re interested in more technical discussion, including an attempt to identify which loan-level variables are most correlated to default rates (the number one being the home price adjusted loan to value ratio), read the full post on toddwschneider.com, and be sure to check out the project on GitHub if you’d like to do your own data analysis.
Gender And The Harvard Math Department
This is a guest post by Meena Boppana, a junior at Harvard and former president of the Harvard Undergraduate Math Association (HUMA). Meena is passionate about addressing the gender gap in math and has co-lead initiatives including the Harvard math survey and the founding of the Harvard student group Gender Inclusivity in Math (GIIM).
I arrived at Harvard in 2012 head-over-heels in love with math. Encouraged to think mathematically since I was four years old by my feminist mathematician dad, I had even given a TEDx talk in high school declaring my love for the subject. I was certainly qualified and excited enough to be a math major.
Which is why, three years later, I think about how it is that virtually all my female friends with insanely strong math backgrounds (e.g. math competition stars) decided not to major in math (I chose computer science). This year, there were no female students in Math 55a, the most intense freshman math class, and only two female students graduating with a primary concentration in math. There are also a total of zero tenured women faculty in Harvard math.
So, I decided to do some statistical sleuthing and co-directed a survey of Harvard undergraduates in math. I was inspired by the work of Nancy Hopkins and other pioneering female scientists at MIT, who quantified gender inequities at the Institute – even measuring the square footage of their offices – and sparked real change. We got a 1/3 response rate among all math concentrators at Harvard, with 150 people in total (including related STEM concentrations) filling it out.
The main finding of our survey analysis is that the dearth of women in Harvard math is far more than a “pipeline issue” stemming from high school. So, the tale that women are coming in to Harvard knowing less math and consequently not majoring in math is missing much of the picture. Women are dropping out of math during their years at Harvard, with female math majors writing theses and continuing on to graduate school at far lower rates than their male math major counterparts.
And it’s a cultural issue. Our survey indicated that many women would like to be involved in the math department and aren’t, most women feel uncomfortable as a result of the gender gap, and women feel uncomfortable in math department common spaces.

Source: Harvard Math Survey
The simple act of talking about the gender gap has opened the floodgates to great conversations. I had always assumed that because no one was talking about the gender gap, no one cared. But after organizing a panel on gender in the math department which drew 150 people with a roughly equal gender split and students and faculty alike, I realized that my classmates of all genders feel more disempowered than apathetic.
The situation is bad, but certainly not hopeless. Together with a male freshman math major, I am founding a Harvard student group called Gender Inclusivity in Math (GIIM). The club has the two-fold goal of increasing community among women in math, including dinners, retreats, and a women speaker series, and also addressing the gender gap in the math department, continuing the trend of surveys and gender in math discussions. The inclusion of male allies is central to our club mission, and the support from male allies at the student and faculty level that we have received makes me optimistic about the will for change.
Ultimately, it is my continued love for math which has driven me to take action. Mathematics is too beautiful and important to lose 50 percent (or much more when considering racial and class-based inequities) of the potential population of math lovers.
Nick Kristof is not Smarter than an 8th Grader
This is a post by Eugene Stern, originally posted on his blog sensemadehere.wordpress.com.
About a week ago, Nick Kristof published this op-ed in the New York Times. Entitled Are You Smarter than an 8th Grader, the piece discusses American kids’ underperformance in math compared with students from other countries, as measured by standardized test results. Kristof goes over several questions from the 2011 TIMSS (Trends in International Mathematics and Science Study) test administered to 8th graders, and highlights how American students did worse than students from Iran, Indonesia, Ghana, Palestine, Turkey, and Armenia, as well as traditional high performers like Singapore. “We all know Johnny can’t read,” says Kristof, in that finger-wagging way perfected by the current cohort of New York Times op-ed columnists; “it appears that Johnny is even worse at counting.”
The trouble with this narrative is that it’s utterly, demonstrably false.
My friend Jordan Ellenberg pointed me to this blog post, which highlights the problem. In spite of Kristof’s alarmism, it turns out that American eighth graders actually did quite well on the 2011 TIMSS. You can see the complete results here. Out of 42 countries tested, the US placed 9th. If you look at the scores by country, you’ll see a large gap between the top 5 (Korea, Singapore, Taiwan, Hong Kong, and Japan) and everyone else. After that gap comes Russia, in 6th place, then another gap, then a group of 9 closely bunched countries: Israel, Finland, the US, England, Hungary, Australia, Slovenia, Lithuania, and Italy. Those made up, more or less, the top third of all the countries that took the test. Our performance isn’t mind-blowing, but it’s not terrible either. So what the hell is Kristof talking about?
You’ll find the answer here, in a list of 88 publicly released questions from the test (not all questions were published, but this appears to be a representative sample). For each question, a performance breakdown by country is given. When I went through the questions, I found that the US placed in the top third (top 14 out of 42 countries) on 45 of them, the middle third on 39, and the bottom third on 4. This seems typical of the kind of variance usually seen on standardized tests. US kids did particularly well on statistics, data interpretation, and estimation, which have all gotten more emphasis in the math curriculum lately. For example, 80% of US eighth graders answered this question correctly:
Which of these is the best estimate of (7.21 × 3.86) / 10.09?
(A) (7 × 3) / 10 (B) (7 × 4) / 10 (C) (7 × 3) / 11 (D) (7 × 4) / 11
More American kids knew that the correct answer was (B) than Russians, Finns, Japanese, English, or Israelis. Nice job, kids! And let’s give your teachers some credit too!
But Kristof isn’t willing to do either. He has a narrative of American underperformance in mind, and if the overall test results don’t fit his story, he’ll just go and find some results that do! Thus, the examples in his column. Kristof literally went and picked the two questions out of 88 on which the US did the worst, and highlighted those in the column. (He gives a third example too, a question in which the US was in the middle of the pack, but the pack did poorly, so the US’s absolute score looks bad.) And, presto! — instead of a story about kids learning stuff and doing decently on a test, we have yet another hysterical screed about Americans “struggling to compete with citizens of other countries.”
Kristof gives no suggestions for what we can actually do better, by the way. But he does offer this helpful advice:
Numeracy isn’t a sign of geekiness, but a basic requirement for intelligent discussions of public policy. Without it, politicians routinely get away with using statistics, as Mark Twain supposedly observed, the way a drunk uses a lamppost: for support rather than illumination.
So do op-ed columnists, apparently.
Guest Post: A Discussion Of PARCC Testing
This is a guest post by Eugene Stern, who writes a blog at Sense Made Here, and Kristin Wald, who writes a blog at This Unique* Weblog. Crossposted on their blogs as well.
Today’s post is a discussion of education reform, standardized testing, and PARCC with my friend Kristin Wald, who has been extremely kind to this blog. Kristin taught high school English in the NYC public schools for many years. Today her kids and mine go to school together in Montclair. She has her own blog that gets orders of magnitude more readers than I do.
ES: PARCC testing is beginning in New Jersey this month. There’s been lots of anxiety and confusion in Montclair and elsewhere as parents debate whether to have their kids take the test or opt out. How do you think about it, both as a teacher and as a parent?
KW: My simple answer is that my kids will sit for PARCC. However, and this is where is gets grainy, that doesn’t mean I consider myself a cheerleader for the exam or for the Common Core curriculum in general.
In fact, my initial reaction, a few years ago, was to distance my children from both the Common Core and PARCC. So much so that I wrote to my child’s principal and teacher requesting that no practice tests be administered to him. At that point I had only peripherally heard about the issues and was extending my distaste for No Child Left Behind and, later, Race to the Top. However, despite reading about and discussing the myriad issues, I still believe in change from within and trying the system out to see kinks and wrinkles up-close rather than condemning it full force.
Standards
ES: Why did you dislike NCLB and Race to the Top? What was your experience with them as a teacher?
KW: Back when I taught in NYC, there was wiggle room if students and schools didn’t meet standards. Part of my survival as a teacher was to shut my door and do what I wanted. By the time I left the classroom in 2007 we were being asked to post the standards codes for the New York State Regents Exams around our rooms, similar to posting Common Core standards all around. That made no sense to me. Who was this supposed to be for? Not the students – if they’re gazing around the room they’re not looking at CC RL.9-10 next to an essay hanging on a bulletin board. I also found NCLB naïve in its “every child can learn it all” attitude. I mean, yes, sure, any child can learn. But kids aren’t starting out at the same place or with the same support. And anyone who has experience with children who have not had the proper support up through 11th grade knows they’re not going to do well, or even half-way to well, just because they have a kickass teacher that year.
Regarding my initial aversion to Common Core, especially as a high school English Language Arts teacher, the minimal appearance of fiction and poetry was disheartening. We’d already seen the slant in the NYS Regents Exam since the late 90’s.
However, a couple of years ago, a friend asked me to explain the reason The Bluest Eye, with its abuse and rape scenes, was included in Common Core selections, so I took a closer look. Basically, a right-wing blogger had excerpted lines and scenes from the novel to paint it as “smut” and child pornography, thus condemning the entire Common Core curriculum. My response to my friend ended up as “In Defense of The Bluest Eye.”
That’s when I started looking more closely at the Common Core curriculum. Learning about some of the challenges facing public schools around the country, I had to admit that having a required curriculum didn’t seem like a terrible idea. In fact, in a few cases, the Common Core felt less confining than what they’d had before. And you know, even in NYC, there were English departments that rarely taught women or minority writers. Without a strong leader in a department, there’s such a thing as too much autonomy. Just like a unit in a class, a school and a department should have a focus, a balance.
But your expertise is Mathematics, Eugene. What are your thoughts on the Common Core from that perspective?
ES: They’re a mix. There are aspects of the reforms that I agree with, aspects that I strongly disagree with, and then a bunch of stuff in between.
The main thing I agree with is that learning math should be centered on learning concepts rather than procedures. You should still learn procedures, but with a conceptual underpinning, so you understand what you’re doing. That’s not a new idea: it’s been in the air, and frustrating some parents, for 50 years or more. In the 1960’s, they called it New Math.
Back then, the reforms didn’t go so well because the concepts they were trying to teach were too abstract – too much set theory, in a nutshell, at least in the younger grades. So then there was a retrenchment, back to learning procedures. But these things seem to go in cycles, and now we’re trying to teach concepts better again. This time more flexibly, less abstractly, with more examples. At least that’s the hope, and I share that hope.
I also agree with your point about needing some common standards defining what gets taught at each grade level. You don’t want to be super-prescriptive, but you need to ensure some kind of consistency between schools. Otherwise, what happens when a kid switches schools? Math, especially, is such a cumulative subject that you really need to have some big picture consistency in how you teach it.
Assessment
ES: What I disagree with is the increased emphasis on standardized testing, especially the raised stakes of those tests. I want to see better, more consistent standards and curriculum, but I think that can and should happen without putting this very heavy and punitive assessment mechanism on top of it.
KW: Yes, claiming to want to assess ability (which is a good thing), but then connecting the results to a teacher’s effectiveness in that moment is insincere evaluation. And using a standardized test not created by the teacher with material not covered in class as a hard percentage of a teacher’s evaluation makes little sense. I understand that much of the exam is testing critical thinking, ability to reason and use logic, and so on. It’s not about specific content, and that’s fine. (I really do think that’s fine!) Linking teacher evaluations to it is not.
Students cannot be taught to think critically in six months. As you mentioned about the spiraling back to concepts, those skills need to be revisited again and again in different contexts. And I agree, tests needn’t be the main driver for raising standards and developing curriculum. But they can give a good read on overall strengths and weaknesses. And if PARCC is supposed to be about assessing student strengths and weaknesses, it should be informing adjustments in curriculum.
On a smaller scale, strong teachers and staffs are supposed to work as a team to influence the entire school and district with adjusted curriculum as well. With a wide reach like the Common Core, a worrying issue is that different parts of the USA will have varying needs to meet. Making adjustments for all based on such a wide collection of assessments is counterintuitive. Local districts (and the principals and teachers in them) need to have leeway with applying them to best suit their own students.
Even so, I do like some things about data driven curricula. Teachers and school administrators are some of the most empathetic and caring people there are, but they are still human, and biases exist. Teachers, guidance counselors, administrators can’t help but be affected by personal sympathies and peeves. Having a consistent assessment of skills can be very helpful for those students who sometimes fall through the cracks. Basically, standards: yes. Linking scores to teacher evaluation: no.
ES: Yes, I just don’t get the conventional wisdom that we can only tell that the reforms are working, at both the individual and group level, through standardized test results. It gives us some information, but it’s still just a proxy. A highly imperfect proxy at that, and we need to have lots of others.
I also really like your point that, as you’re rolling out national standards, you need some local assessment to help you see how those national standards are meeting local needs. It’s a safeguard against getting too cookie-cutter.
I think it’s incredibly important that, as you and I talk, we can separate changes we like from changes we don’t. One reason there’s so much noise and confusion now is that everything – standards, curriculum, testing – gets lumped together under “Common Core.” It becomes this giant kitchen sink that’s very hard to talk about in a rational way. Testing especially should be separated out because it’s fundamentally an issue of process, whereas standards and curriculum are really about content.
You take a guy like Cuomo in New York. He’s trying to increase the reliance on standardized tests in teacher evaluations, so that value added models based on test scores count for half of a teacher’s total evaluation. And he says stuff like this: “Everyone will tell you, nationwide, the key to education reform is a teacher evaluation system.” That’s from his State of the State address in January. He doesn’t care about making the content better at all. “Everyone” will tell you! I know for a fact that the people spending all their time figuring out at what grade level kids should start to learn about fractions aren’t going tell you that!
I couldn’t disagree with that guy more, but I’m not going to argue with him based on whether or not I like the problems my kids are getting in math class. I’m going to point out examples, which he should be well aware of by now, of how badly the models work. That’s a totally different discussion, about what we can model accurately and fairly and what we can’t.
So let’s have that discussion. Starting point: if you want to use test scores to evaluate teachers, you need a model because – I think everyone agrees on this – how kids do on a test depends on much more than how good their teacher was. There’s the talent of the kid, what preparation they got outside their teacher’s classroom, whether they got a good night’s sleep the night before, and a good breakfast, and lots of other things. As well as natural randomness: maybe the reading comprehension section was about DNA, and the kid just read a book about DNA last month. So you need a model to break out the impact of the teacher. And the models we have today, even the most state-of-the-art ones, can give you useful aggregate information, but they just don’t work at that level of detail. I’m saying this as a math person, and the American Statistical Association agrees. I’ve written about this here and here and here and here.
Having student test results impact teacher evaluations is my biggest objection to PARCC, by far.
KW: Yep. Can I just cut and paste what you’ve said? However, for me, another distasteful aspect is how technology is tangled up in the PARCC exam.
Technology
ES: Let me tell you the saddest thing I’ve heard all week. There’s a guy named Dan Meyer, who writes very interesting things about math education, both in his blog and on Twitter. He put out a tweet about a bunch of kids coming into a classroom and collectively groaning when they saw laptops on every desk. And the reason was that they just instinctively assumed they were either about to take a test or do test prep.
That feels like such a collective failure to me. Look, I work in technology, and I’m still optimistic that it’s going to have a positive impact on math education. You can use computers to do experiments, visualize relationships, reinforce concepts by having kids code them up, you name it. The new standards emphasize data analysis and statistics much more than any earlier standards did, and I think that’s a great thing. But using computers primarily as a testing tool is an enormous missed opportunity. It’s like, here’s the most amazing tool human beings have ever invented, and we’re going to use it primarily as a paperweight. And we’re going to waste class time teaching kids exactly how to use it as a paperweight. That’s just so dispiriting.
KW: That’s something that hardly occurred to me. My main objection to hosting the PARCC exam on computers – and giving preparation homework and assignments that MUST be done on a computer – is the unfairness inherent in accessibility. It’s one more way to widen the achievement gap that we are supposed to be minimizing. I wrote about it from one perspective here.
I’m sure there are some students who test better on a computer, but the playing field has to be evenly designed and aggressively offered. Otherwise, a major part of what the PARCC is testing is how accurately and quickly children use a keyboard. And in the aggregate, the group that will have scores negatively impacted will be children with less access to the technology used on the PARCC. That’s not an assessment we need to test to know. When I took the practice tests, I found some questions quite clear, but others were difficult not for content but in maneuvering to create a fraction or other concept. Part of that can be solved through practice and comfort with the technology, but then we return to what we’re actually testing.
ES: Those are both great points. The last thing you want to do is force kids to write math on a computer, because it’s really hard! Math has lots of specialized notation that’s much easier to write with pencil and paper, and learning how to write math and use that notation is a big part of learning the subject. It’s not easy, and you don’t want to put artificial obstacles in kids’ way. I want kids thinking about fractions and exponents and what they mean, and how to write them in a mathematical expression, but not worrying about how to put a numerator above a denominator or do a superscript or make a font smaller on a computer. Plus, why in the world would you limit what kids can express on a test to what they can input on a keyboard? A test is a proxy already, and this limits what it can capture even more.
I believe in using technology in education, but we’ve got the order totally backwards. Don’t introduce the computer as a device to administer tests, introduce it as a tool to help in the classroom. Use it for demos and experiments and illustrating concepts.
As far as access and fairness go, I think that’s another argument for using the computer as a teaching tool rather than a testing tool. If a school is using computers in class, then at least everyone has access in the classroom setting, which is a start. Now you might branch out from there to assignments that require a computer. But if that’s done right, and those assignments grow in an organic way out of what’s happening in the classroom, and they have clear learning value, then the school and the community are also morally obligated to make sure that everyone has access. If you don’t have a computer at home, and you need to do computer-based homework, then we have to get you computer access, after school hours, or at the library, or what have you. And that might actually level the playing field a bit. Whereas now, many computer exercises feel like they’re primarily there to get kids used to the testing medium. There isn’t the same moral imperative to give everybody access to that.
I really want to hear more about your experience with the PARCC practice tests, though. I’ve seen many social media threads about unclear questions, both in a testing context and more generally with the Common Core. It sounds like you didn’t think it was so bad?
KW: Well, “not so bad” in that I am a 45 year old who was really trying to take the practice exam honestly, but didn’t feel stressed about the results. However, I found the questions with fractions confusing in execution on the computer (I almost gave up), and some of the questions really had to be read more than once. Now, granted, I haven’t been exposed to the language and technique of the exam. That matters a lot. In the SAT, for example, if you don’t know the testing language and format it will adversely affect your performance. This is similar to any format of an exam or task, even putting together an IKEA nightstand.
There are mainly two approaches to preparation, and out of fear of failing, some school districts are doing hardcore test preparation – much like SAT preparation classes – to the detriment of content and skill-based learning. Others are not altering their classroom approaches radically; in fact, some teachers and parents have told me they hardly notice a difference. My unscientific observations point to a separation between the two that is lined in Socio-Economic Status. If districts feel like they are on the edge or have a lot to lose (autonomy, funding, jobs), if makes sense that they would be reactionary in dealing with the PARCC exam. Ironically, schools that treat the PARCC like a high-stakes test are the ones losing the most.
Opting Out
KW: Despite my misgivings, I’m not in favor of “opting out” of the test. I understand the frustration that has prompted the push some districts are experiencing, but there have been some compromises in New Jersey. I was glad to see that the NJ Assembly voted to put off using the PARCC results for student placement and teacher evaluations for three years. And I was relieved, though not thrilled, that the percentage of PARCC results to be used in teacher evaluations was lowered to 10% (and now put off). I still think it should not be a part of teacher evaluations, but 10% is an improvement.
Rather than refusing the exam, I’d prefer to see the PARCC in action and compare honest data to school and teacher-generated assessments in order to improve the assessment overall. I believe an objective state or national model is worth having; relying only on teacher-based assessment has consistency and subjective problems in many areas. And that goes double for areas with deeply disadvantaged students.
ES: Yes, NJ seems to be stepping back from the brink as far as model-driven teacher evaluation goes. I think I feel the same way you do, but if I lived in NY, where Cuomo is trying to bump up the weight of value added models in evaluations to 50%, I might very well be opting out.
Let me illustrate the contrast – NY vs. NJ, more test prep vs. less — with an example. My family is good friends with a family that lived in NYC for many years, and just moved to Montclair a couple months ago. Their older kid is in third grade, which is the grade level where all this testing starts. In their NYC gifted and talented public school, the test was this big, stressful thing, and it was giving the kid all kinds of test anxiety. So the mom was planning to opt out. But when they got to Montclair, the kid’s teacher was much more low key, and telling the kids not to worry. And once it became lower stakes, the kid wanted to take the test! The mom was still ambivalent, but she decided that here was an opportunity for her kid to get used to tests without anxiety, and that was the most important factor for her.
I’m trying to make two points here. One: whether or not you opt out depends on lots of factors, and people’s situations and priorities can be very different. We need to respect that, regardless of which way people end up going. Two: shame on us, as grown ups, for polluting our kids’ education with our anxieties! We need to stop that, and that extends both to the education policies we put in place and how we collectively debate those policies. I guess what I’m saying is: less noise, folks, please.
KW: Does this very long blog post count as noise, Eugene? I wonder how this will be assessed? There are so many other issues – private profits from public education, teacher autonomy in high performing schools, a lack of educational supplies and family support, and so on. But we have to start somewhere with civil and productive discourse, right? So, thank you for having the conversation.
ES: Kristin, I won’t try to predict anyone else’s assessment, but I will keep mine low stakes and say this has been a pleasure!
Guest post: Be more careful with the vagina stats in teaching
This is a guest post by Courtney Gibbons, an assistant professor of mathematics at Hamilton College. You can see her teaching evaluations on ratemyprofessor.com. She would like you to note that she’s been tagged as “hilarious.” Twice.
Lately, my social media has been blowing up with stories about gender bias in higher ed, especially course evaluations. As a 30-something, female math professor, I’m personally invested in this kind of issue. So I’m gratified when I read about well-designed studies that highlight the “vagina tax” in teaching (I didn’t coin this phrase, but I wish I had).
These kinds of studies bring the conversation about bias to the table in a way that academics can understand. We can geek out on experimental design, the fact that the research is peer-reviewed and therefore passes some basic legitimacy tests.
Indeed, the conversation finally moves out of the realm of folklore, where we have “known” for some time that students expect women to be nurturing in addition to managing the class, while men just need to keep class on track.
Let me reiterate: as a young woman in academia, I want deans and chairs and presidents to take these observed phenomena seriously when evaluating their professors. I want to talk to my colleagues and my students about these issues. Eventually, I’d like to “fix” them, or at least game them to my advantage. (Just kidding. I’d rather fix them.)
However, let me speak as a mathematician for a minute here: bad interpretations of data don’t advance the cause. There’s beautiful link-bait out there that justifies its conclusions on the flimsy “hey, look at this chart” understanding of big data. Benjamin M. Schmidt created a really beautiful tool to visualize data he scraped from the website ratemyprofessor.com through a process that he sketches on his blog. The best criticisms and caveats come from Schmidt himself.
What I want to examine is the response to the tool, both in the media and among my colleagues. USAToday, HuffPo, and other sites have linked to it, citing it as yet more evidence to support the folklore: students see men as “geniuses” and women as “bossy.” It looks like they found some screenshots (or took a few) and decided to interpret them as provocatively as possible. After playing with the tool for a few minutes, which wasn’t even hard enough to qualify as sleuthing, I came to a very different conclusion.
If you look at the ratings for “genius” and then break them down further to look at positive and negative reviews separately, it occurs predominantly in negative reviews. I found a few specific reviews, and they read, “you have to be a genius to pass” or along those lines.
[Don’t take my word for it — search google for:
rate my professors “you have to be a genius”‘
and you’ll see how students use the word “genius” in reviews of professors. The first page of hits is pretty much all men.]
Here’s the breakdown for “genius”:

So yes, the data shows that students are using the word “genius” in more evaluations of men than women. But there’s not a lot to conclude from this; we can’t tell from the data if the student is praising the professor or damning him. All we can see that it’s a word that occurs in negative reviews more often than positive ones. From the data, we don’t even know if it refers to the professor or not.
Similar results occur with “brilliant”:

Now check out “bossy” and negative reviews:

Okay, wow, look at how far to the right those orange dots are… and now look at the x-axis. We’re talking about fewer than 5 uses per million words of text. Not exactly significant compared to some of the other searches you can do.
I thought that the phrase “terrible teacher” was more illuminating, because it’s more likely in reference to the subject of the review, and we’ve got some meaningful occurrences:
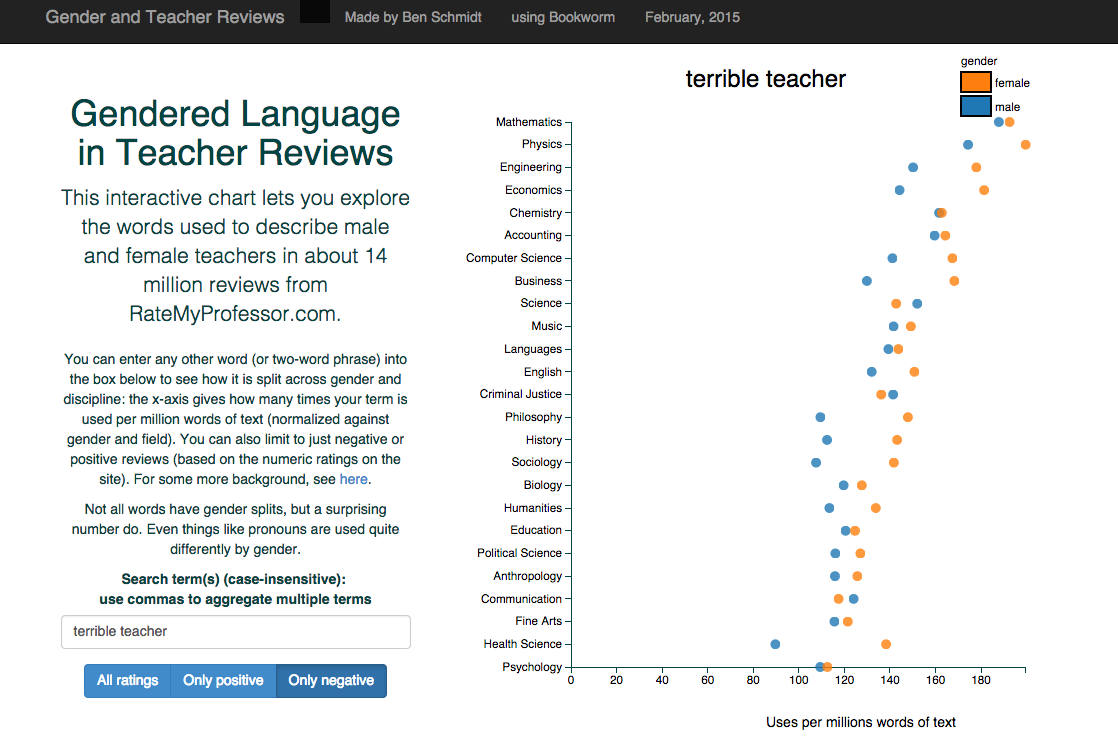
And yes, there is a gender imbalance, but it’s not as great as I had feared. I’m more worried about the disciplinary break down, actually. Check out math — we have the worst teachers, but we spread it out across genders, with men ranking 187 uses of “terrible teacher” per million words; women score 192. Compare to psychology, where profs receive a score of 110. Ouch.
Who’s doing this reporting, and why aren’t we reading these reports more critically? Journalists, get your shit together and report data responsibly. Academics, be a little more skeptical of stories that simply post screenshots of a chart coupled with inciting prose from conclusions drawn, badly, from hastily scanned data.
Is this tool useless? No. Is it fun to futz around with? Yes.
Is it being reported and understood well? Resounding no!
I think even our students would agree with me: that’s just f*cked up.
Nerd catcalling
This is a guest post by Becky Jaffe.
It has come to my attention that I am a nerd. I take this on good authority from my students, my friends, and, as of this morning, strangers in a coffee shop. I was called a nerd three times today before 10:30 am, while I was standing in line for coffee – which is to say, before I was caffeinated, and therefore utterly defenseless. I asked my accusers for suggestions on how to be less nerdy. Here was their helpful advice:
Guy in coffee shop: “Wear makeup and high heels.”
Another helpful interlocutor: “Use smaller words.”
My student, later in the day: “Care less about ideas.”
A friend: “Think less like NPR and more like C-SPAN.”
What I wish someone had said: “Is that a dictionary in your pocket or are you happy to see me?”
What I learned today is that if I want to avoid being called a nerd, I should be more like Barbie. And I don’t mean the Professor Barbie version, which – get this – does not exist. When I googled “Professor Barbie,” I got “Fashion Professor Barbie.”

So many lessons in gender conformity for one day! This nerd is taking notes.
Guest post: Clustering and predicting NYC taxi activity
This is a guest post by Deepak Subburam, a data scientist who works at Tessellate.

from NYCTaxi.info
Greetings fellow Mathbabers! At Cathy’s invitation, I am writing here about NYCTaxi.info, a public service web app my co-founder and I have developed. It overlays on a Google map around you estimated taxi activity, as expected number of passenger pickups and dropoffs this current hour. We modeled these estimates from the recently released 2013 NYC taxi trips dataset comprising 173 million trips, the same dataset that Cathy’s post last week on deanonymization referenced. Our work will not help you stalk your favorite NYC celebrity, but guide your search for a taxi and maybe save some commute time. My writeup below shall take you through the four broad stages our work proceeded through: data extraction and cleaning , clustering, modeling, and visualization.
We extract three columns from the data: the longitude and latitude GPS coordinates of the passenger pickup or dropoff location, and the timestamp. We make no distinction between pickups and dropoffs, since both of these events imply an available taxicab at that location. The data was generally clean, with a very small fraction of a percent of coordinates looking bad, e.g. in the middle of the Hudson River. These coordinate errors get screened out by the clustering step that follows.
We cluster the pickup and dropoff locations into areas of high density, i.e. where many pickups and dropoffs happen, to determine where on the map it is worth making and displaying estimates of taxi activity. We rolled our own algorithm, a variation on heatmap generation, after finding existing clustering algorithms such as K-means unsuitable—we are seeking centroids of areas of high density rather than cluster membership per se. See figure below which shows the cluster centers as identified by our algorithm on a square-mile patch of Manhattan. The axes represent the longitude and latitude of the area; the small blue crosses a random sample of pickups and dropoffs; and the red numbers the identified cluster centers, in descending order of activity.

Taxi activity clusters
We then model taxi activity at each cluster. We discretize time into hourly intervals—for each cluster, we sum all pickups and dropoffs that occur each hour in 2013. So our datapoints now are triples of the form [<cluster>, <hour>, <activity>], with <hour> being some hour in 2013 and <activity> being the number of pickups and dropoffs that occurred in hour <hour> in cluster <cluster>. We then regress each <activity> against neighboring clusters’ and neighboring times’ <activity> values. This regression serves to smooth estimates across time and space, smoothing out effects of special events or weather in the prior year that don’t repeat this year. It required some tricky choices on arranging and aligning the various data elements; not technically difficult or maybe even interesting, but nevertheless likely better part of an hour at a whiteboard to explain. In other words, typical data science. We then extrapolate these predictions to 2014, by mapping each hour in 2014 to the most similar hour in 2013. So we now have a prediction at each cluster location, for each hour in 2014, the number of passenger pickups and dropoffs.
We display these predictions by overlaying them on a Google maps at the corresponding cluster locations. We round <activity> to values like 20, 30 to avoid giving users number dyslexia. We color the labels based on these values, using the black body radiation color temperatures for the color scale, as that is one of two color scales where the ordering of change is perceptually intuitive.
If you live in New York, we hope you find NYCTaxi.info useful. Regardless, we look forward to receiving any comments.

Guest post: The dangers of evidence-based sentencing
This is a guest post by Luis Daniel, a research fellow at The GovLab at NYU where he works on issues dealing with tech and policy. He tweets @luisdaniel12. Crossposted at the GovLab.
What is Evidence-based Sentencing?
For several decades, parole and probation departments have been using research-backed assessments to determine the best supervision and treatment strategies for offenders to try and reduce the risk of recidivism. In recent years, state and county justice systems have started to apply these risk and needs assessment tools (RNA’s) to other parts of the criminal process.
Of particular concern is the use of automated tools to determine imprisonment terms. This relatively new practice of applying RNA information into the sentencing process is known as evidence-based sentencing (EBS).
What the Models Do
The different parameters used to determine risk vary by state, and most EBS tools use information that has been central to sentencing schemes for many years such as an offender’s criminal history. However, an increasing amount of states have been utilizing static factors such as gender, age, marital status, education level, employment history, and other demographic information to determine risk and inform sentencing. Especially alarming is the fact that the majority of these risk assessment tools do not take an offender’s particular case into account.
This practice has drawn sharp criticism from Attorney General Eric Holder who says “using static factors from a criminal’s background could perpetuate racial bias in a system that already delivers 20% longer sentences for young black men than for other offenders.” In the annual letter to the US Sentencing Commission, the Attorney General’s Office states that “utilizing such tools for determining prison sentences to be served will have a disparate and adverse impact on offenders from poor communities already struggling with social ills.” Other concerns cite the probable unconstitutionality of using group-based characteristics in risk assessments.
Where the Models Are Used
It is difficult to precisely quantify how many states and counties currently implement these instruments, although at least 20 states have implemented some form of EBS. Some of the states or states with counties that have implemented some sort of EBS (any type of sentencing: parole, imprisonment, etc) are: Pennsylvania, Tennessee, Vermont, Kentucky, Virginia, Arizona, Colorado, California, Idaho, Indiana, Missouri, Nebraska, Ohio, Oregon, Texas, and Wisconsin.
The Role of Race, Education, and Friendship
Overwhelmingly states do not include race in the risk assessments since there seems to be a general consensus that doing so would be unconstitutional. However, even though these tools do not take race into consideration directly, many of the variables used such as economic status, education level, and employment correlate with race. African-Americans and Hispanics are already disproportionately incarcerated and determining sentences based on these variables might cause further racial disparities.
The very socioeconomic characteristics such as income and education level used in risk assessments are the characteristics that are already strong predictors of whether someone will go to prison. For example, high school dropouts are 47 times more likely to be incarcerated than people in their similar age group who received a four-year college degree. It is reasonable to suspect that courts that include education level as a risk predictor will further exacerbate these disparities.
Some states, such as Texas, take into account peer relations and considers associating with other offenders as a “salient problem”. Considering that Texas is in 4th place in the rate of people under some sort of correctional control (parole, probation, etc) and that the rate is 1 in 11 for black males in the United States it is likely that this metric would disproportionately affect African-Americans.
Sonja Starr’s paper
Even so, in some cases, socioeconomic and demographic variables receive significant weight. In her forthcoming paper in the Stanford Law Review, Sonja Starr provides a telling example of how these factors are used in presentence reports. From her paper:
For instance, in Missouri, pre-sentence reports include a score for each defendant on a scale from -8 to 7, where “4-7 is rated ‘good,’ 2-3 is ‘above average,’ 0-1 is ‘average’, -1 to -2 is ‘below average,’ and -3 to -8 is ‘poor.’ Unlike most instruments in use, Missouri’s does not include gender. However, an unemployed high school dropout will score three points worse than an employed high school graduate—potentially making the difference between “good” and “average,” or between “average” and “poor.” Likewise, a defendant under age 22 will score three points worse than a defendant over 45. By comparison, having previously served time in prison is worth one point; having four or more prior misdemeanor convictions that resulted in jail time adds one point (three or fewer adds none); having previously had parole or probation revoked is worth one point; and a prison escape is worth one point. Meanwhile, current crime type and severity receive no weight.
Starr argues that such simple point systems may “linearize” a variable’s effect. In the underlying regression models used to calculate risk, some of the variable’s effects do not translate linearly into changes in probability of recidivism, but they are treated as such by the model.
Another criticism Starr makes is that they often make predictions on an individual based on averages of a group. Starr says these predictions can predict with reasonable precision the average recidivism rate for all offenders who share the same characteristics as the defendant, but that does not make it necessarily useful for individual predictions.
The Future of EBS Tools
The Model Penal Code is currently in the process of being revised and is set to include these risk assessment tools in the sentencing process. According to Starr, this is a serious development because it reflects the increased support of these practices and because of the Model Penal Code’s great influence in guiding penal codes in other states. Attorney General Eric Holder has already spoken against the practice, but it will be interesting to see whether his successor will continue this campaign.
Even if EBS can accurately measure risk of recidivism (which is uncertain according to Starr), does that mean that a greater prison sentence will result in less future offenses after the offender is released? EBS does not seek to answer this question. Further, if knowing there is a harsh penalty for a particular crime is a deterrent to commit said crime, wouldn’t adding more uncertainty to sentencing (EBS tools are not always transparent and sometimes proprietary) effectively remove this deterrent?
Even though many questions remain unanswered and while several people have been critical of the practice, it seems like there is great support for the use of these instruments. They are especially easy to support when they are overwhelmingly regarded as progressive and scientific, something Starr refutes. While there is certainly a place for data analytics and actuarial methods in the criminal justice system, it is important that such research be applied with the appropriate caution. Or perhaps not at all. Even if the tools had full statistical support, the risk of further exacerbating an already disparate criminal justice system should be enough to halt this practice.
Both Starr and Holder believe there is a strong case to be made that the risk prediction instruments now in use are unconstitutional. But EBS has strong advocates, so it’s a difficult subject. Ultimately, evidence-based sentencing is used to determine a person’s sentencing not based on what the person has done, but who that person is.
Guest post: New Federal Banking Regulations Undermine Obama Infrastructure Stance
This is a guest post by Marc Joffe, a former Senior Director at Moody’s Analytics, who founded Public Sector Credit Solutions in 2011 to educate the public about the risk – or lack of risk – in government securities. Marc published an open source government bond rating tool in 2012 and launched a transparent credit scoring platform for California cities in 2013. Currently, Marc blogs for Bitvore, a company which sifts the internet to provide market intelligence to municipal bond investors.
Obama administration officials frequently talk about the need to improve the nation’s infrastructure. Yet new regulations published by the Federal Reserve, FDIC and OCC run counter to this policy by limiting the market for municipal bonds.
On Wednesday, bank regulators published a new rule requiring large banks to hold a minimum level of high quality liquid assets (HQLAs). This requirement is intended to protect banks during a financial crisis, and thus reduce the risk of a bank failure or government bailout. Just about everyone would agree that that’s a good thing.
The problem is that regulators allow banks to use foreign government securities, corporate bonds and even stocks as HQLAs, but not US municipal bonds. Unless this changes, banks will have to unload their municipal holdings and won’t be able to purchase new state and local government bonds when they’re issued. The new regulation will thereby reduce the demand for bonds needed to finance roads, bridges, airports, schools and other infrastructure projects. Less demand for these bonds will mean higher interest rates.
Municipal bond issuance is already depressed. According to data from SIFMA, total municipal bonds outstanding are lower now than in 2009 – and this is in nominal dollar terms. Scary headlines about Detroit and Puerto Rico, rating agency downgrades and negative pronouncements from market analysts have scared off many investors. Now with banks exiting the market, the premium that local governments have to pay relative to Treasury bonds will likely increase.
If the new rule had limited HQLA’s to just Treasuries, I could have understood it. But since the regulators are letting banks hold assets that are as risky as or even riskier than municipal bonds, I am missing the logic. Consider the following:
- No state has defaulted on a general obligation bond since 1933. Defaults on bonds issued by cities are also extremely rare – affecting about one in one thousand bonds per year. Other classes of municipal bonds have higher default rates, but not radically different from those of corporate bonds.
- Bonds issued by foreign governments can and do default. For example, private investors took a 70% haircut when Greek debt was restructured in 2012.
- Regulators explained their decision to exclude municipal bonds because of thin trading volumes, but this is also the case with corporate bonds. On Tuesday, FINRA reported a total of only 6446 daily corporate bond trades across a universe of perhaps 300,000 issues. So, in other words, the average corporate bond trades less than once per day. Not very liquid.
- Stocks are more liquid, but can lose value very rapidly during a crisis as we saw in 1929, 1987 and again in 2008-2009. Trading in individual stocks can also be halted.
Perhaps the most ironic result of the regulation involves municipal bond insurance. Under the new rules, a bank can purchase bonds or stock issued by Assured Guaranty or MBIA – two major municipal bond insurers – but they can’t buy state and local government bonds insured by those companies. Since these insurance companies would have to pay interest and principal on defaulted municipal securities before they pay interest and dividends to their own investors, their securities are clearly more risky than the insured municipal bonds.
Regulators have expressed a willingness to tweak the new HQLA regulations now that they are in place. I hope this is one area they will reconsider. Mandating that banks hold safe securities is a good thing; now we need a more data-driven definition of just what safe means. By including municipal securities in HQLA, bank regulators can also get on the same page as the rest of the Obama administration.
Guest Post: Bring Back The Slide Rule!
This is a guest post by Gary Cornell, a mathematician, writer, publisher, and recent founder of StemForums.
I was was having a wonderful ramen lunch with the mathbabe and, as is all too common when two broad minded Ph.D.’s in math get together, we started talking about the horrible state math education is in for both advanced high school students and undergraduates.
One amusing thing we discovered pretty quickly is that we had independently come up with the same (radical) solution to at least part of the problem: throw out the traditional sequence which goes through first and second year calculus and replace it with a unified probability, statistics, calculus course where the calculus component was only for the smoothest of functions and moreover the applications of calculus are only to statistics and probability. Not only is everything much more practical and easier to motivate in such a course, students would hopefully learn a skill that is essential nowadays: how to separate out statistically good information from the large amount of statistical crap that is out there.
Of course, the downside is that the (interesting) subtleties that come from the proofs, the study of non-smooth functions and for that matter all the other stuff interesting to prospective physicists like DiffEQ’s would have to be reserved for different courses. (We also were in agreement that Gonick’s beyond wonderful“Cartoon Guide To Statistics” should be required reading for all the students in these courses, but I digress…)
The real point of this blog post is based on what happened next: but first you have to know I’m more or less one generation older than the mathbabe. This meant I was both able and willing to preface my next point with the words: “You know when I was young, in one way students were much better off because…” Now it is well known that using this phrase to preface a discussion often poisons the discussion but occasionally, as I hope in this case, some practices from days gone by ago can if brought back, help solve some of today’s educational problems.
By the way, and apropos of nothing, there is a cure for people prone to too frequent use of this phrase: go quickly to YouTube and repeatedly make them watch Monty Python’s Four Yorkshireman until cured:
Anyway, the point I made was that I am a member of the last generation of students who had to use slide rules. Another good reference is: here. Both these references are great and I recommend them. (The latter being more technical.) For those who have never heard of them, in a nutshell, a slide rule is an analog device that uses logarithms under the hood to do (sufficiently accurate in most cases) approximate multiplication, division, roots etc.
The key point is that using a slide rule requires the user to keep track of the “order of magnitude” of the answers— because slide rules only give you four or so significant digits. This meant students of my generation when taking science and math courses were continuously exposed to order of magnitude calculations and you just couldn’t escape from having to make order of magnitude calculations all the time—students nowadays, not so much. Calculators have made skill at doing order of magnitude calculations (or Fermi calculations as they are often lovingly called) an add-on rather than a base line skill and that is a really bad thing. (Actually my belief that bringing back slide rules would be a good thing goes back a ways: when that when I was a Program Director at the NSF in the 90’s, I actually tried to get someone to submit a proposal which would have been called “On the use of a hand held analog device to improve science and math education!” Didn’t have much luck.)
Anyway, if you want to try a slide rule out, alas, good vintage slide rules have become collectible and so expensive— because baby boomers like me are buying the ones we couldn’t afford when we were in high school – but the nice thing is there are lots of sites like this one which show you how to make your own.
Finally, while I don’t think they will ever be as much fun as using a slide rule, you could still allow calculators in classrooms.
Why? Because it would be trivial to have a mode in the TI calculator or the Casio calculator that all high school students seem to use, called “significant digits only.” With the right kind of problems this mode would require students to do order of magnitude calculations because they would never be able to enter trailing or leading zeroes and we could easily stick them with problems having a lot of them!
But calculators really bug me in classrooms and, so I can’t resist pointing out one last flaw in their omnipresence: it makes students believe in the possibility of ridiculously high precision results in the real world. After all, nothing they are likely to encounter in their work (and certainly not in their lives) will ever need (or even have) 14 digits of accuracy and, more to the point, when you see a high precision result in the real world, it is likely to be totally bogus when examined under the hood.
A simple mathematical model of congressional geriatric penis pumps
This is a guest post written by Stephanie Yang and reposted from her blog. Stephanie and I went to graduate school at Harvard together. She is now a quantitative analyst living in New York City, and will be joining the data science team at Foursquare next month.
 Last week’s hysterical report by the Daily Show’s Samantha Bee on federally funded penis pumps contained a quote which piqued our quantitative interest. Listen carefully at the 4:00 mark, when Ilyse Hogue proclaims authoritatively:
“Statistics show that probably some our members of congress have a vested interested in having penis pumps covered by Medicare!”
Ilya’s wording is vague, and intentionally so. Statistically, a lot of things are “probably” true, and many details are contained in the word “probably”. In this post we present a simple statistical model to clarify what Ilya means.
First we state our assumptions. We assume that penis pumps are uniformly distributed among male Medicare recipients and that no man has received two pumps. These are relatively mild assumptions. We also assume that what Ilya refers to as “members of Congress [with] a vested interested in having penis pumps covered by Medicare,” specifically means male member of congress who received a penis pump covered by federal funds. Of course, one could argue that female members congress could also have a vested interested in penis pumps as well, but we do not want to go there.
Now the number crunching. According to the report, Medicare has spent a total of $172 million supplying penis pumps to recipients, at “360 bucks a pop.” This means a total of 478,000 penis pumps bought from 2006 to 2011.
45% of the current 49,435,610 Medicare recipients are male. In other words, Medicare bought one penis pump for every 46.5 eligible men. Inverting this, we can say that 2.15% of male Medicare recipients received a penis pump.
There are currently 128 members of congress (32 senators plus 96 representatives) who are males over the age of 65 and therefore Medicare-eligible. The probability that none of them received a federally funded penis pump is:

In other words, the chances of at least one member of congress having said penis pumps is 93.8%, which is just shy of the 95% confidence that most statisticians agree on as significant. In order to get to 95% confidence, we need a total of 138 male members of congress who are over the age of 65, and this has not happened yet as of 2014. Nevertheless, the estimate is close enough for us to agree with Ilya that there is probably someone member of congress who has one.
Is it possible that there two or more penis pump recipients in congress? We did notice that Ilya’s quote refers to plural members of congress. Under the assumptions laid out above, the probability of having at least two federally funded penis pumps in congress is:

Again, we would say this is probably true, though not nearly with the same amount of confidence as before. In order to reach 95% confidence that there are two or moreq congressional federally funded penis pump, we would need 200 or more Medicare-eligible males in congress, which is unlikely to happen anytime soon.
Note: As a corollary to these calculations, I became the first developer in the history of mankind to type the following command: git merge --squash penispump.
Guest rant about rude kids
Today’s guest post was written by Amie, who describes herself as a mom of a 9 and a 14-year-old, mathematician, and bigmouth.
Nota bene: this was originally posted on Facebook as a spontaneous rant. Please don’t miscontrue it as an academic argument.
Time for a rant. I’ll preface this by saying that while my kids are creative, beautiful souls, so are many (perhaps all) children I’ve met, and it would be the height of arrogance to take credit for that as a parent. But one thing my husband and I can take credit for are their good manners, because that took work to develop.
The first phrase I taught me daughter was “thank you,” and it’s been put to good use over the years. I’m also loathe to tell other parents what to do, but this is an exception: teach your fucking kids to say “please” and “thank you”. If you are fortunate to visit another country, teach them to say “please” and “thank you” in the native language.
After a week in paradise at a Club Med in Mexico, I’m at some kind of breaking point with rude rich people and their spoiled kids. And that includes the Europeans. Maybe especially the Europeans. What is it that when you’re in France everyone’s all “thank you and have a nice day” but when these petit bourgeois assholes come to Cancun they treat Mexicans like nonhumans? My son held the door for a face-lifted Russian lady today who didn’t even say thank you.
Anyway, back to kids: I’m not saying that you should suppress your kids’ nature joie de vivre and boisterous, rambunctious energy (though if that’s what they’re like, please keep them away from adults who are not in the mood for it). Just teach them to treat other people with basic respect and courtesy. That means prompting them to say “please,” “thank you,” and “nice to meet you” when they interact with other people.
Jordan Ellenberg just posted how a huge number of people accepted to the math Ph.D. program at the University of Wisconsin never wrote to tell him that they had accepted other offers. When other people are on a wait list!
Whose fault is this? THE PARENTS’ FAULT. Damn parents. Come on!!
P.S. Those of you who have put in the effort to raise polite kids: believe me, I’ve noticed. So has everyone else.
Ya’ make your own luck, n’est-ce pas?
This is a guest post by Leopold Dilg.
There’s little chance we can underestimate our American virtues, since our overlords so seldom miss an opportunity to point them out. A case in point – in fact, le plus grand du genre, though my fingers tremble as I type that French expression, for reasons I’ll explain soon enough – is the Cadillac commercial that interrupted the broadcast of the Olympics every few minutes.
A masterpiece of casting and directing and location scouting, the ad follows a middle-aged man, muscular enough but not too proud to show a little paunch – manifestly a Master of the Universe – strutting around his chillingly modernist $10 million vacation house (or is it his first or fifth home? no matter), every pore oozing the manly, smirky bearing that sent Republican country-club women swooning over W.
It starts with Our Hero, viewed from the back, staring down his infinity pool. He pivots and stares down the viewer. He shows himself to be one of the more philosophical species of the MotU genus. “Why do we work so hard?” he puzzles. “For this? For stuff?….” We’re thrown off balance: Will this son of Goldman Sachs go all Walden Pond on us? Fat chance.
Now, still barefooted in his shorts and polo shirt, he’s prowling his sleak living room (his two daughters and stay-at-home wife passively reading their magazines and ignoring the camera, props in his world no less than his unused pool and The Car yet to be seen) spitting bile at those foreign pansies who “stop by the café” after work and “take August off!….OFF!” Those French will stop at nothing.
“Why aren’t YOU like that,” he says, again staring us down and we yield to the intimidation. (Well gee, sir, of course I’m not. Who wants a month off? Not me, absolutely, no way.) “Why aren’t WE like that” he continues – an irresistible demand for totalizing merger. He’s got us now, we’re goose-stepping around the TV, chanting “USA! USA! No Augusts off! No Augusts off!”
No, he sneers, we’re “crazy, hardworking believers.” But those Frogs – the weaklings who called for a double-check about the WMDs before we Americans blasted Iraqi children to smithereens (woops, someone forgot to tell McDonalds, the official restaurant of the U.S. Olympic team, about the Freedom Fries thing; the offensive French Fries are THERE, right in our faces in the very next commercial, when the athletes bite gold medals and the awe-struck audience bites chicken nuggets, the Lunch of Champions) – might well think we’re “nuts.”
“Whatever,” he shrugs, end of discussion, who cares what they think. “Were the Wright Brothers insane? Bill Gates? Les Paul?… ALI?” He’s got us off-balance again – gee, after all, we DO kinda like Les Paul’s guitar, and we REALLY like Ali.
Of course! Never in a million years would the hip jazz guitarist insist on taking an August holiday. And the imprisoned-for-draft-dodging boxer couldn’t possibly side with the café-loafers on the WMD thing. Gee, or maybe…. But our MotU leaves us no time for stray dissenting thoughts. Throwing lunar dust in our eyes, he discloses that WE were the ones who landed on the moon. “And you know what we got?” Oh my god, that X-ray stare again, I can’t look away. “BORED. So we left.” YEAH, we’re chanting and goose-stepping again, “USA! USA! We got bored! We got bored!”
Gosh, I think maybe I DID see Buzz Aldrin drumming his fingers on the lunar module and looking at his watch. “But…” – he’s now heading into his bedroom, but first another stare, and pointing to the ceiling – “…we got a car up there, and left the keys in it. You know why? Because WE’re the only ones goin’ back up there, THAT’s why.” YES! YES! Of COURSE! HE’S going back to the moon, I’M going back to the moon, YOU’RE going back to the moon, WE’RE ALL going back to the moon. EVERYONE WITH A U.S. PASSPORT is going back to the moon!!
Damn, if only the NASA budget wasn’t cut after all that looting by the Wall Street boys to pay for their $10 million vacation homes, WE’D all be going to get the keys and turn the ignition on the rover that’s been sitting 45 years in the lunar garage waiting for us. But again – he must be reading our mind – he’s leaving us no time for dissent, he pops immediately out of his bedroom in his $12,000 suit, gives us the evil eye again, yanks us from the edge of complaint with a sharp, “But I digress!” and besides he’s got us distracted with the best tailoring we’ve ever seen.
Finally, he’s out in the driveway, making his way to the shiny car that’ll carry him to lower Manhattan. (But where’s the chauffer? And don’t those MotUs drive Mazerattis and Bentleys? Is this guy trying to pull one over on the suburban rubes who buy Cadillacs stupidly thinking they’ve made it to the big time?)
Now the climax: “You work hard, you create your own luck, and you gotta believe anything is possible,” he declaims.
Yes, we believe that! The 17 million unemployed and underemployed, the 47 million who need food stamps to keep from starving, the 8 million families thrown out of their homes – WE ALL BELIEVE. From all the windows in the neighborhood, from all the apartments across Harlem, from Sandy-shattered homes in Brooklyn and Staten Island, from the barren blast furnaces of Bethlehem and Youngstown, from the foreclosed neighborhoods in Detroit and Phoenix, from the 70-year olds doing Wal-mart inventory because their retirement went bust, from all the kitchens of all the families carrying $1 trillion in college debt, I hear the national chant, “YOU MAKE YOUR OWN LUCK! YOU MAKE YOUR OWN LUCK!”
And finally – the denouement – from the front seat of his car, our Master of the Universe answers the question we’d all but forgotten. “As for all the stuff? That’s the upside of taking only two weeks off in August.” Then the final cold-blooded stare and – too true to be true – a manly wink, the kind of wink that makes us all collaborators and comrades-in-arms, and he inserts the final dagger: “N’est-ce pas?”
N’est-ce pas?
Guest Post: Beauty, even in the teaching of mathematics
This is a guest post by Manya Raman-Sundström.
Mathematical Beauty
If you talk to a mathematician about what she or he does, pretty soon it will surface that one reason for working those long hours on those difficult problems has to do with beauty.
Whatever we mean by that term, whether it is the way things hang together, or the sheer simplicity of a result found in a jungle of complexity, beauty – or aesthetics more generally—is often cited as one of the main rewards for the work, and in some cases the main motivating factor for doing this work. Indeed, the fact that a proof of known theorem can be published just because it is more elegant is one evidence of this fact.
Mathematics is beautiful. Any mathematician will tell you that. Then why is it that when we teach mathematics we tend not to bring out the beauty? We would consider it odd to teach music via scales and theory without ever giving children a chance to listen to a symphony. So why do we teach mathematics in bits and pieces without exposing students to the real thing, the full aesthetic experience?
Of course there are marvelous teachers out there who do manage to bring out the beauty and excitement and maybe even the depth of mathematics, but aesthetics is not something we tend to value at a curricular level. The new Common Core Standards that most US states have adopted as their curricular blueprint do not mention beauty as a goal. Neither do the curriculum guidelines of most countries, western or eastern (one exception is Korea).
Mathematics teaching is about achievement, not about aesthetic appreciation, a fact that test-makers are probably grateful for – can you imagine the makeover needed for the SAT if we started to try to measure aesthetic appreciation?
Why Does Beauty Matter?
First, it should be a bit troubling that our mathematics classrooms do not mirror practice. How can young people make wise decisions about whether they should continue to study mathematics if they have never really seen mathematics?
Second, to overlook the aesthetic components of mathematical thought might be to preventing our children from developing their intellectual capacities.
In the 1970s Seymour Papert , a well-known mathematician and educator, claimed that scientific thought consisted of three components: cognitive, affective, and aesthetic (for some discussion on aesthetics, see here).
At the time, research in education was almost entirely cognitive. In the last couple decades, the role of affect in thinking has become better understood, and now appears visibly in national curriculum documents. Enjoying mathematics, it turns out, is important for learning it. However, aesthetics is still largely overlooked.
Recently Nathalie Sinclair, of Simon Frasier University, has shown that children can develop aesthetic appreciation, even at a young age, somewhat analogously to mathematicians. But this kind of research is very far, currently, from making an impact on teaching on a broad scale.
Once one starts to take seriously the aesthetic nature of mathematics, one quickly meets some very tough (but quite interesting!) questions. What do we mean by beauty? How do we characterise it? Is beauty subjective, or objective (or neither? or both?) Is beauty something that can be taught, or does it just come to be experienced over time?
These questions, despite their allure, have not been fully explored. Several mathematicians (Hardy, Poincare, Rota) have speculated, but there is no definite answer even on the question of what characterizes beauty.
Example
To see why these questions might be of interest to anyone but hard-core philosophers, let’s look at an example. Consider the famous question, answered supposedly by Gauss, of the sum of the first n integers. Think about your favorite proof of this. Probably the proof that did NOT come to your mind first was a proof by induction:
Prove that S(n) = 1 + 2 + 3 … + n = n (n+1) /2
S(k + 1) = S(k) + (k + 1)
= k(k + 1)/2 + 2(k + 1)/2
= k(k + 1)/2 + 2(k + 1)/2
= (k + 1)(k + 2)/2.
Now compare this proof to another well known one. I will give the picture and leave the details to you:

Does one of these strike you as nicer, or more explanatory, or perhaps even more beautiful than the other? My guess is that you will find the second one more appealing once you see that it is two sequences put together, giving an area of n (n+1), so S(n) = n (n+1)/2.
Note: another nice proof of this theorem, of course, is the one where S(n) is written both forwards and backwards and added. That proof also involves a visual component, as well as an algebraic one. See here for this and a few other proofs.
Beauty vs. Explanation
How often do we, as teachers, stop and think about the aesthetic merits of a proof? What is it, exactly, that makes the explanatory proof more attractive? In what way does the presentation of the proof make the key ideas accessible, and does this accessibility affect our sense of understanding, and what underpins the feeling that one has found exactly the right proof or exactly the right picture or exactly the right argument?
Beauty and explanation, while not obvious related (see here), might at least be bed-fellows. It may be the case that what lies at the bottom of explanation — a feeling of understanding, or a sense that one can ”see” what is going on — is also related to the aesthetic rewards we get when we find a particularly good solution.
Perhaps our minds are drawn to what is easiest to grasp, which brings us back to central questions of teaching and learning: how do we best present mathematics in a way that makes it understandable, clear, and perhaps even beautiful? These questions might all be related.
Workshop on Math Beauty
This March 10-12, 2014 in Umeå, Sweden, a group will gather to discuss this topic. Specifically, we will look at the question of whether mathematical beauty has anything to do with mathematical explanation. And if so, whether the two might have anything to do with visualization.
If this discussion peaks your interest at all, you are welcome to check out my blog on math beauty. There you will find a link to the workshop, with a fantastic lineup of philosophers, mathematicians, and mathematics educators who will come together to try to make some progress on these hard questions.
Thanks to Cathy, the always fabulous mathbabe, for letting me take up her space to share the news of this workshop (and perhaps get someone out there excited about this research area). Perhaps she, or you if you have read this far, would be willing to share your own favorite examples of beautiful mathematics. Some examples have already been collected here, please add yours.
Citigroup is the real reason we need the Volcker Rule
This is a guest post by Tom Adams, who spent over 20 years in the securitization business and now works as an attorney and consultant and expert witness on MBS, CDO and securitization related issues. Jointly posted with Naked Capitalism.
Volcker Rule
Last week, the rules for the Volcker Rule – that provision of the Dodd-Frank Legislation that was intended to prevent (reduce?) proprietary trading by banks – were finalized. As a consequence, there has been a lot of chatter among financial types around the internet about what the rule does and doesn’t do and how it is good or bad, etc. Much of the conversation falls into the category of noise and distraction about unintended consequences, impacts on liquidity and broad views of regulatory effectiveness.
Citigroup
I call it noise, because in my view the real purpose of the Volcker Rule is to prevent another Citigroup bailout and therefore the measure of its effectiveness is whether the rule would accomplish this.
As you may recall, Citigroup required the largest bailout in government history in 2008, going back to the government well for more bailout funds several times. The source of Citigroup’s pain was almost entirely due to its massive investment in the ABS CDO machine. Of course, at the time of Citi’s bailout, there was a lot of noise about the potential financial system collapse and the risk posed by numerous other banks and institutions, so Citi as the main target of the TARP bailout, and ABS CDOs as the main cause of Citi’s pain, often gets lost in the folds of history.
The CDO market
In the years leading up to the financial crisis, Citi was an active underwriter for CDO’s backed by mortgage backed securities. Selling these securities was a lucrative business for Citi and other banks – far more lucrative than the selling of the underlying MBS. The hard part of selling was finding someone to take the highest risk piece (called the equity) of the CDO, but that problem got solved when Magnetar and other hedge funds came along with their ingenious shorting scheme.
The next hardest part was finding someone to take the risk of the very large senior class of the CDO, often known as the super-senior class (it was so named because it was enhanced at levels above that needed for a AAA rating).
For a time, Citi relied on a few overseas buyers and some insurance companies – like AIG and monoline bond insurers – to take on that risk. In addition, the MBS market became heavily reliant upon CDOs to buy up the lower rated bonds from MBS securitizations.
As the frenzy of MBS selling escalated, though, the number of parties willing to take on the super-seniors was unable to match the volume of CDOs being created (AIG, for instance, pulled back from insuring the bonds in 2006). Undeterred, Citi began to take down the super-senior bonds from the deals they were selling and holding them as “investments” which required very little capital because they were AAA.
This approach enabled Citi to continue the vey lucrative business of selling CDOs (to themselves!), which also enhanced their ability to create and sell MBS (to their CDOs), which enabled Citi to keep the music playing and the dance going, to paraphrase their then CEO Chuck Prince.
The CDO music stopped in July, 2007 with the rating agency downgrades of hundreds of the MBS bonds underlying the CDOs that had been created over the prior 24 months. MBS and CDO issuance effectively shut down the following month and remained shut throughout the crisis. The value of CDOs almost immediately began to plummet, leading to large mark-to-market losses for the parties that insured CDOs, such as Ambac and MBIA.
Citi managed to ignore the full extent of the declines in the value of the CDOs for nearly a year, until AIG ran into its troubles (itself a result of the mark-to-market declines in the values of its CDOs). When, in the fall of 2008, Citi finally fessed up to the problems it was facing, it turned out it was holding super-senior CDOs with a face value of about $150 billion which were now worth substantially less.
How much less? The market opinion at the time was probably around 10-20 cents on the dollar. Some of that value recovered in the last two years, but the bonds were considered fairly worthless for several years. Citi’s difficulty in determining exactly how little the CDOs were worth and how many they held was the primary reason for the repeated requests for additional bailout money.
Citi’s bailout is everyone’s bailout
The Citi bailout was a huge embarrassment for the company and the regulators that oversaw the company (including the Federal Reserve) for failing to prevent such a massive aid package. Some effort was made, at the time TARP money was distributed, to obscure Citi’s central role in the need for TARP and the panic the potential for a Citi failure was causing in the market and at the Treasury Department (see for example this story and the SIGTARP report). By any decent measure, Citi should have been broken up after this fiasco, but at least some effort should be made from a large bank ever needing such a bailout again, right?
Volcker’s Rule is Citi’s rule
So the test for whether the Volcker Rule is effective is fairly simple: will it prevent Citi, or some other large institution, from getting in this situation again? The rule is relatively complex and armies of lawyers are dissecting it for ways to arbitrage its words as we speak.
However, some evidence has emerged that the Volcker Rule would be effective in preventing another Citi fiasco. While the bulk of the rules don’t become effective until 2015, banks are required to move all “covered assets” from held to maturity to held for sale, which requires them to move the assets to a fair market valuation from… whatever they were using before.
Just this week, for example, Zions Bank announced that they were taking a substantial impairment because of that rule and moving a big chunk of CDOs (trust preferred securities, or TRUPS, were the underlying asset, although the determination would apparently apply to all CDOs) to fair market accounting from… whatever valuation they were using previously (not fair market?).
Here’s the key point. Had Citi been forced to do this as they acquired their CDOs, there is a decent chance they would have run into CDO capacity problems much sooner – they may not have been able to rely on the AAA ratings, they might have had to sell off some of the bonds before the market imploded, and they might have had to justify their valuations with actual data rather than self-serving models.
As a secondary consequence, they probably would have had to stop buying and originating mortgage loans and buying and selling MBS, because they wouldn’t have been able to help create CDOs to dump them into.
Given the size of Citi’s CDO portfolio, and the leverage that those CDOs had as it relates to underlying mortgage loans (one $1 billion CDO was backed by MBS from about $10 billion mortgages, $150 billion of CDOs would have been backed by MBS from about $1.5 trillion of mortgage loans, theoretically), if Citi had slowed their buying of CDOs, it might have had a substantial cooling effect on the mortgage market before the crisis hit.
Guest post: Rage against the algorithms
This is a guest post by Nicholas Diakopoulos, a Tow Fellow at the Columbia University Graduate School of Journalism where he is researching the use of data and algorithms in the news. You can find out more about his research and other projects on his website or by following him on Twitter. Crossposted from engenhonetwork with permission from the author.

How can we know the biases of a piece of software? By reverse engineering it, of course.
When was the last time you read an online review about a local business or service on a platform like Yelp? Of course you want to make sure the local plumber you hire is honest, or that even if the date is dud, at least the restaurant isn’t lousy. A recent survey found that 76 percent of consumers check online reviews before buying, so a lot can hinge on a good or bad review. Such sites have become so important to local businesses that it’s not uncommon for scheming owners to hire shills to boost themselves or put down their rivals.
To protect users from getting duped by fake reviews Yelp employs an algorithmic review reviewer which constantly scans reviews and relegates suspicious ones to a “filtered reviews” page, effectively de-emphasizing them without deleting them entirely. But of course that algorithm is not perfect, and it sometimes de-emphasizes legitimate reviews and leaves actual fakes intact—oops. Some businesses have complained, alleging that the filter can incorrectly remove all of their most positive reviews, leaving them with a lowly one- or two-stars average.
This is just one example of how algorithms are becoming ever more important in society, for everything from search engine personalization, discrimination, defamation, and censorship online, to how teachers are evaluated, how markets work, how political campaigns are run, and even how something like immigration is policed. Algorithms, driven by vast troves of data, are the new power brokers in society, both in the corporate world as well as in government.
They have biases like the rest of us. And they make mistakes. But they’re opaque, hiding their secrets behind layers of complexity. How can we deal with the power that algorithms may exert on us? How can we better understand where they might be wronging us?
Transparency is the vogue response to this problem right now. The big “open data” transparency-in-government push that started in 2009 was largely the result of an executive memo from President Obama. And of course corporations are on board too; Google publishes a biannual transparency report showing how often they remove or disclose information to governments. Transparency is an effective tool for inculcating public trust and is even the way journalists are now trained to deal with the hole where mighty Objectivity once stood.
But transparency knows some bounds. For example, though the Freedom of Information Act facilitates the public’s right to relevant government data, it has no legal teeth for compelling the government to disclose how that data was algorithmically generated or used in publicly relevant decisions (extensions worth considering).
Moreover, corporations have self-imposed limits on how transparent they want to be, since exposing too many details of their proprietary systems may undermine a competitive advantage (trade secrets), or leave the system open to gaming and manipulation. Furthermore, whereas transparency of data can be achieved simply by publishing a spreadsheet or database, transparency of an algorithm can be much more complex, resulting in additional labor costs both in creation as well as consumption of that information—a cognitive overload that keeps all but the most determined at bay. Methods for usable transparency need to be developed so that the relevant aspects of an algorithm can be presented in an understandable way.
Given the challenges to employing transparency as a check on algorithmic power, a new and complementary alternative is emerging. I call it algorithmic accountability reporting. At its core it’s really about reverse engineering—articulating the specifications of a system through a rigorous examination drawing on domain knowledge, observation, and deduction to unearth a model of how that system works.
As interest grows in understanding the broader impacts of algorithms, this kind of accountability reporting is already happening in some newsrooms, as well as in academic circles. At the Wall Street Journal a team of reporters probed e-commerce platforms to identify instances of potential price discrimination in dynamic and personalized online pricing. By polling different websites they were able to spot several, such as Staples.com, that were adjusting prices dynamically based on the location of the person visiting the site. At the Daily Beast, reporter Michael Keller dove into the iPhone spelling correction feature to help surface patterns of censorship and see which words, like “abortion,” the phone wouldn’t correct if they were misspelled. In my own investigation for Slate, I traced the contours of the editorial criteria embedded in search engine autocomplete algorithms. By collecting hundreds of autocompletions for queries relating to sex and violence I was able to ascertain which terms Google and Bing were blocking or censoring, uncovering mistakes in how these algorithms apply their editorial criteria.
All of these stories share a more or less common method. Algorithms are essentially black boxes, exposing an input and output without betraying any of their inner organs. You can’t see what’s going on inside directly, but if you vary the inputs in enough different ways and pay close attention to the outputs, you can start piecing together some likeness for how the algorithm transforms each input into an output. The black box starts to divulge some secrets.
Algorithmic accountability is also gaining traction in academia. At Harvard, Latanya Sweeney has looked at how online advertisements can be biased by the racial association of names used as queries. When you search for “black names” as opposed to “white names” ads using the word “arrest” appeared more often for online background check service Instant Checkmate. She thinks the disparity in the use of “arrest” suggests a discriminatory connection between race and crime. Her method, as with all of the other examples above, does point to a weakness though: Is the discrimination caused by Google, by Instant Checkmate, or simply by pre-existing societal biases? We don’t know, and correlation does not equal intention. As much as algorithmic accountability can help us diagnose the existence of a problem, we have to go deeper and do more journalistic-style reporting to understand the motivations or intentions behind an algorithm. We still need to answer the question of why.
And this is why it’s absolutely essential to have computational journalists not just engaging in the reverse engineering of algorithms, but also reporting and digging deeper into the motives and design intentions behind algorithms. Sure, it can be hard to convince companies running such algorithms to open up in detail about how their algorithms work, but interviews can still uncover details about larger goals and objectives built into an algorithm, better contextualizing a reverse-engineering analysis. Transparency is still important here too, as it adds to the information that can be used to characterize the technical system.
Despite the fact that forward thinkers like Larry Lessig have been writing for some time about how code is a lever on behavior, we’re still in the early days of developing methods for holding that code and its influence accountable. “There’s no conventional or obvious approach to it. It’s a lot of testing or trial and error, and it’s hard to teach in any uniform way,” noted Jeremy Singer-Vine, a reporter and programmer who worked on the WSJ price discrimination story. It will always be a messy business with lots of room for creativity, but given the growing power that algorithms wield in society it’s vital to continue to develop, codify, and teach more formalized methods of algorithmic accountability. In the absence of new legal measures, it may just provide a novel way to shed light on such systems, particularly in cases where transparency doesn’t or can’t offer much clarity.
Don’t Fly During Ramadan
Crossposted from /var/null, a blog written by Aditya Mukerjee. Aditya graduated from Columbia with a degree in CS and statistics, was a hackNY Fellow, worked in data at OkCupid, and on the server team at foursquare. He currently serves as the Hacker-in-Residence at Quotidian Ventures.
A couple of weeks ago, I was scheduled to take a trip from New York (JFK) to Los Angeles on JetBlue. Every year, my family goes on a one-week pilgrimage, where we put our work on hold and spend time visiting temples, praying, and spending time with family and friends. To my Jewish friends, I often explain this trip as vaguely similar to the Sabbath, except we take one week of rest per year, rather than one day per week.
Our family is not Muslim, but by coincidence, this year, our trip happened to be during the last week of Ramadan.
By further coincidence, this was also the same week that I was moving out of my employer-provided temporary housing (at NYU) and moving into my new apartment. The night before my trip, I enlisted the help of two friends and we took most of my belongings, in a couple of suitcases, to my new apartment. The apartment was almost completely unfurnished – I planned on getting new furniture upon my return – so I dropped my few bags (one containing an air mattress) in the corner. Even though I hadn’t decorated the apartment yet, in accordance with Hindu custom, I taped a single photograph to the wall in my bedroom — a long-haired saint with his hands outstretched in pronam (a sign of reverence and respect).
The next morning, I packed the rest of my clothes into a suitcase and took a cab to the airport. I didn’t bother to eat breakfast, figuring I would grab some yogurt in the terminal while waiting to board.
I got in line for security at the airport and handed the agent my ID. Another agent came over and handed me a paper slip, which he said was being used to track the length of the security lines. He said, “just hand this to someone when your stuff goes through the x-ray machines, and we’ll know how long you were in line.’ I looked at the timestamp on the paper: 10:40.
When going through the security line, I opted out (as I always used to) of the millimeter wave detectors. I fly often enough, and have opted out often enough, that I was prepared for what comes next: a firm pat-down by a TSA employee wearing non-latex gloves, who uses the back of his hand when patting down the inside of the thighs.
After the pat-down, the TSA agent swabbed his hands with some cotton-like material and put the swab in the machine that supposedly checks for explosive residue. The machine beeped. “We’re going to need to pat you down again, this time in private,” the agent said.
Having been selected before for so-called “random” checks, I assumed that this was another such check.
“What do you mean, ‘in private’? Can’t we just do this out here?”
“No, this is a different kind of pat-down, and we can’t do that in public.” When I asked him why this pat-down was different, he wouldn’t tell me. When I asked him specifically why he couldn’t do it in public, he said “Because it would be obscene.”
Naturally, I balked at the thought of going somewhere behind closed doors where a person I just met was going to touch me in “obscene” ways. I didn’t know at the time (and the agent never bothered to tell me) that the TSA has a policy that requires two agents to be present during every private pat-down. I’m not sure if that would make me feel more or less comfortable.
Noticing my hesitation, the agent offered to have his supervisor explain the procedure in more detail. He brought over his supervisor, a rather harried man who, instead of explaining the pat-down to me, rather rudely explained to me that I could either submit immediately to a pat-down behind closed-doors, or he could call the police.
At this point, I didn’t mind having to leave the secure area and go back through security again (this time not opting out of the machines), but I didn’t particularly want to get the cops involved. I told him, “Okay, fine, I’ll leave”.
“You can’t leave here.”
“Are you detaining me, then?” I’ve been through enough “know your rights” training to know how to handle police searches; however, TSA agents are not law enforcement officials. Technically, they don’t even have the right to detain you against your will.
“We’re not detaining you. You just can’t leave.” My jaw dropped.
“Either you’re detaining me, or I’m free to go. Which one is it?” I asked.
He glanced for a moment at my backpack, then snatched it out of the conveyor belt. “Okay,” he said. “You can leave, but I’m keeping your bag.”
I was speechless. My bag had both my work computer and my personal computer in it. The only way for me to get it back from him would be to snatch it back, at which point he could simply claim that I had assaulted him. I was trapped.
While we waited for the police to arrive, I took my phone and quickly tried to call my parents to let them know what was happening. Unfortunately, my mom’s voicemail was full, and my dad had never even set his up.
“Hey, what’s he doing?” One of the TSA agents had noticed I was touching my phone. “It’s probably fine; he’s leaving anyway,” another said.
The cops arrived a few minutes later, spoke with the TSA agents for a moment, and then came over and gave me one last chance to submit to the private examination. “Otherwise, we have to escort you out of the building.” I asked him if he could be present while the TSA agent was patting me down.
“No,” he explained, “because when we pat people down, it’s to lock them up.”
I only realized the significance of that explanation later. At this point, I didn’t particularly want to miss my flight. Foolishly, I said, “Fine, I’ll do it.”
The TSA agents and police escorted me to a holding room, where they patted me down again – this time using the front of their hands as they passed down the front of my pants. While they patted me down, they asked me some basic questions.
“What’s the purpose of your travel?”
“Personal,” I responded, (as opposed to business).
“Are you traveling with anybody?”
“My parents are on their way to LA right now; I’m meeting them there.”
“How long is your trip?”
“Ten days.”
“What will you be doing?”
Mentally, I sighed. There wasn’t any other way I could answer this next question.
“We’ll be visiting some temples.” He raised his eyebrow, and I explained that the next week was a religious holiday, and that I was traveling to LA to observe it with my family.
After patting me down, they swabbed not only their hands, but also my backpack, shoes, wallet, and belongings, and then walked out of the room to put it through the machine again. After more than five minutes, I started to wonder why they hadn’t said anything, so I asked the police officer who was guarding the door. He called over the TSA agent, who told me,
“You’re still setting off the alarm. We need to call the explosives specialist”.
I waited for about ten minutes before the specialist showed up. He walked in without a word, grabbed the bins with my possessions, and started to leave. Unlike the other agents I’d seen, he wasn’t wearing a uniform, so I was a bit taken aback.
“What’s happening?” I asked.
“I’m running it through the x-ray again,” he snapped. “Because I can. And I’m going to do it again, and again, until I decide I’m done”. He then asked the TSA agents whether they had patted me down. They said they had, and he just said, “Well, try again”, and left the room. Again I was told to stand with my legs apart and my hands extended horizontally while they patted me down all over before stepping outside.
The explosives specialist walked back into the room and asked me why my clothes were testing positive for explosives. I told him, quite truthfully, “I don’t know.” He asked me what I had done earlier in the day.
“Well, I had to pack my suitcase, and also clean my apartment.”
“And yesterday?”
“I moved my stuff from my old apartment to my new one”.
“What did you eat this morning?”
“Nothing,” I said. Only later did I realize that this made it sound like I was fasting, when in reality, I just hadn’t had breakfast yet.
“Are you taking any medications?”
The other TSA agents stood and listened while the explosives specialist and asked every medication I had taken “recently”, both prescription and over-the-counter, and asked me to explain any medical conditions for which any prescription medicine had been prescribed. Even though I wasn’t carrying any medication on me, he still asked for my complete “recent” medical history.
“What have you touched that would cause you to test positive for certain explosives?”
“I can’t think of anything. What does it say is triggering the alarm?” I asked.
“I’m not going to tell you! It’s right here on my sheet, but I don’t have to tell you what it is!” he exclaimed, pointing at his clipboard.
I was at a loss for words. The first thing that came to my mind was, “Well, I haven’t touched any explosives, but if I don’t even know what chemical we’re talking about, I don’t know how to figure out why the tests are picking it up.”
He didn’t like this answer, so he told them to run my belongings through the x-ray machine and pat me down again, then left the room.
I glanced at my watch. Boarding would start in fifteen minutes, and I hadn’t even had anything to eat. A TSA officer in the room noticed me craning my neck to look at my watch on the table, and he said, “Don’t worry, they’ll hold the flight.”
As they patted me down for the fourth time, a female TSA agent asked me for my baggage claim ticket. I handed it to her, and she told me that a woman from JetBlue corporate security needed to ask me some questions as well. I was a bit surprised, but agreed. After the pat-down, the JetBlue representative walked in and cooly introduced herself by name.
She explained, “We have some questions for you to determine whether or not you’re permitted to fly today. Have you flown on JetBlue before?”
“Yes”
“How often?”
“Maybe about ten times,” I guessed.
“Ten what? Per month?”
“No, ten times total.”
She paused, then asked,
“Will you have any trouble following the instructions of the crew and flight attendants on board the flight?”
“No.” I had no idea why this would even be in doubt.
“We have some female flight attendants. Would you be able to follow their instructions?”
I was almost insulted by the question, but I answered calmly, “Yes, I can do that.”
“Okay,” she continued, “and will you need any special treatment during your flight? Do you need a special place to pray on board the aircraft?”
Only here did it hit me.
“No,” I said with a light-hearted chuckle, trying to conceal any sign of how offensive her questions were. “Thank you for asking, but I don’t need any special treatment.”
She left the room, again, leaving me alone for another ten minutes or so. When she finally returned, she told me that I had passed the TSA’s inspection. “However, based on the responses you’ve given to questions, we’re not going to permit you to fly today.”
I was shocked. “What do you mean?” were the only words I could get out.
“If you’d like, we’ll rebook you for the flight tomorrow, but you can’t take the flight this afternoon, and we’re not permitting you to rebook for any flight today.”
I barely noticed the irony of the situation – that the TSA and NYPD were clearing me for takeoff, but JetBlue had decided to ground me. At this point, I could think of nothing else but how to inform my family, who were expecting me to be on the other side of the country, that I wouldn’t be meeting them for dinner after all. In the meantime, an officer entered the room and told me to continue waiting there. “We just have one more person who needs to speak with you before you go.” By then, I had already been “cleared” by the TSA and NYPD, so I couldn’t figure out why I still needed to be questioned. I asked them if I could use my phone and call my family.
“No, this will just take a couple of minutes and you’ll be on your way.” The time was 12.35.
He stepped out of the room – for the first time since I had been brought into the cell, there was no NYPD officer guarding the door. Recognizing my short window of opportunity, I grabbed my phone from the table and quickly texted three of my local friends – two who live in Brooklyn, and one who lives in Nassau County – telling them that I had been detained by the TSA and that I couldn’t board my flight. I wasn’t sure what was going to happen next, but since nobody had any intention of reading me my Miranda rights, I wanted to make sure people knew where I was.
After fifteen minutes, one of the police officers marched into the room and scolded, “You didn’t tell us you have a checked bag!” I explained that I had already handed my baggage claim ticket to a TSA agent, so I had in fact informed someone that I had a checked bag. Looking frustrated, he turned and walked out of the room, without saying anything more.
After about twenty minutes, another man walked in and introduced himself as representing the FBI. He asked me many of the same questions I had already answered multiple times – my name, my address, what I had done so far that day. etc.
He then asked, “What is your religion?”
“I’m Hindu.”
“How religious are you? Would you describe yourself as ‘somewhat religious’ or ‘very religious’?”
I was speechless from the idea of being forced to talk about my the extent of religious beliefs to a complete stranger. “Somewhat religious”, I responded.
“How many times a day do you pray?” he asked. This time, my surprise must have registered on my face, because he quickly added, “I’m not trying to offend you; I just don’t know anything about Hinduism. For example, I know that people are fasting for Ramadan right now, but I don’t have any idea what Hindus actually do on a daily basis.”
I nearly laughed at the idea of being questioned by a man who was able to admit his own ignorance on the subject matter, but I knew enough to restrain myself. The questioning continued for another few minutes. At one point, he asked me what cleaning supplies I had used that morning.
“Well, some window cleaner, disinfectant -” I started, before he cut me off.
“This is important,” he said, sternly. “Be specific.” I listed the specific brands that I had used.
Suddenly I remembered something: the very last thing I had done before leaving was to take the bed sheets off of my bed, as I was moving out. Since this was a dorm room, to guard against bedbugs, my dad (a physician) had given me an over-the-counter spray to spray on the mattress when I moved in, over two months previously. Was it possible that that was still active and triggering their machines?
“I also have a bedbug spray,” I said. “I don’t know the name of it, but I knew it was over-the-counter, so I figured it probably contained permethrin.” Permethrin is an insecticide, sold over-the-counter to kill bed bugs and lice.
“Perm-what?” He asked me to spell it.
After he wrote it down, I asked him if I could have something to drink. “I’ve been here talking for three hours at this point,” I explained. “My mouth is like sandpaper”. He refused, saying
“We’ll just be a few minutes, and then you’ll be able to go.”
“Do you have any identification?” I showed him my drivers license, which still listed my old address. “You have nothing that shows your new address?” he exclaimed.
“Well, no, I only moved there on Thursday.”
“What about the address before that?”
“I was only there for two months – it was temporary housing for work”. I pulled my NYU ID out of my wallet. He looked at it, then a police officer in the room took it from him and walked out.
“What about any business cards that show your work address?” I mentally replayed my steps from the morning, and remembered that I had left behind my business card holder, thinking I wouldn’t need it on my trip.
“No, I left those at home.”
“You have none?”
“Well, no, I’m going on vacation, so I didn’t refill them last night.” He scoffed. “I always carry my cards on me, even when I’m on vacation.” I had no response to that – what could I say?
“What about a direct line at work? Is there a phone number I can call where it’ll patch me straight through to your voicemail?”
“No,” I tried in vain to explain. “We’re a tech company; everyone just uses their cell phones”. To this day, I don’t think my company has a working landline phone in the entire office – our “main line” is a virtual assistant that just forwards calls to our cell phones. I offered to give him the name and phone number of one of our venture partners instead, which he reluctantly accepted.
Around this point, the officer who had taken my NYU ID stormed into the room.
“They put an expiration sticker on your ID, right?” I nodded. “Well then why did this ID expire in 2010?!” he accused.
I took a look at the ID and calmly pointed out that it said “August 2013” in big letters on the ID, and that the numbers “8/10” meant “August 10th, 2013”, not “August, 2010”. I added, “See, even the expiration sticker says 2013 on it above the date”. He studied the ID again for a moment, then walked out of the room again, looking a little embarrassed.
The FBI agent resumed speaking with me. “Do you have any credit cards with your name on them?” I was hesitant to hand them a credit card, but I didn’t have much of a choice. Reluctantly, I pulled out a credit card and handed it to him. “What’s the limit on it?” he said, and then, noticing that I didn’t laugh, quickly added, “That was a joke.”
He left the room, and then a series of other NYPD and TSA agents came in and started questioning me, one after the other, with the same questions that I’d already answered previously. In between, I was left alone, except for the officer guarding the door.
At one point, when I went to the door and asked the officer when I could finally get something to drink, he told me, “Just a couple more minutes. You’ll be out of here soon.”
“That’s what they said an hour ago,” I complained.
“You also said a lot of things, kid,” he said with a wink. “Now sit back down”.
I sat back down and waited some more. Another time, I looked up and noticed that a different officer was guarding the door. By this time, I hadn’t had any food or water in almost eighteen hours. I could feel the energy draining from me, both physically and mentally, and my head was starting to spin. I went to the door and explained the situation the officer. “At the very least, I really need something to drink.”
“Is this a medical emergency? Are you going to pass out? Do we need to call an ambulance?” he asked, skeptically. His tone was almost mocking, conveying more scorn than actual concern or interest.
“No,” I responded. I’m not sure why I said that. I was lightheaded enough that I certainly felt like I was going to pass out.
“Are you diabetic?”
“No,” I responded.
Again he repeated the familiar refrain. “We’ll get you out of here in a few minutes.” I sat back down. I was starting to feel cold, even though I was sweating – the same way I often feel when a fever is coming on. But when I put my hand to my forehead, I felt fine.
One of the police officers who questioned me about my job was less-than-familiar with the technology field.
“What type of work do you do?”
“I work in venture capital.”
“Venture Capital – is that the thing I see ads for on TV all the time?” For a moment, I was dumbfounded – what venture capital firm advertises on TV? Suddenly, it hit me.
“Oh! You’re probably thinking of Capital One Venture credit cards.” I said this politely and with a straight face, but unfortunately, the other cop standing in the room burst out laughing immediately. Silently, I was shocked – somehow, this was the interrogation procedure for confirming that I actually had the job I claimed to have.
Another pair of NYPD officers walked in, and one asked me to identify some landmarks around my new apartment. One was, “When you’re facing the apartment, is the parking on the left or on the right?” I thought this was an odd question, but I answered it correctly. He whispered something in the ear of the other officer, and they both walked out.
The onslaught of NYPD agents was broken when a South Asian man with a Homeland Security badge walked in and said something that sounded unintelligible. After a second, I realized he was speaking Hindi.
“Sorry, I don’t speak Hindi.”
“Oh!” he said, noticeably surprised at how “Americanized” this suspect was. We chatted for a few moments, during which time I learned that his family was Pakistani, and that he was Muslim, though he was not fasting for Ramadan. He asked me the standard repertoire of questions that I had been answering for other agents all day.
Finally, the FBI agent returned.
“How are you feeling right now?” he asked. I wasn’t sure if he was expressing genuine concern or interrogating me further, but by this point, I had very little energy left.
“A bit nauseous, and very thirsty.”
“You’ll have to understand, when a person of your… background walks into here, travelling alone, and sets off our alarms, people start to get a bit nervous. I’m sure you’ve been following what’s been going on in the news recently. You’ve got people from five different branches of government all in here – we don’t do this just for fun.”
He asked me to repeat some answers to questions that he’d asked me previously, looking down at his notes the whole time, then he left. Finally, two TSA agents entered the room and told me that my checked bag was outside, and that I would be escorted out to the ticketing desks, where I could see if JetBlue would refund my flight.
It was 2:20PM by the time I was finally released from custody. My entire body was shaking uncontrollably, as if I were extremely cold, even though I wasn’t. I couldn’t identify the emotion I was feeling. Surprisingly, as far as I could tell, I was shaking out of neither fear nor anger – I felt neither of those emotions at the time. The shaking motion was entirely involuntary, and I couldn’t force my limbs to be still, no matter how hard I concentrated.
In the end, JetBlue did refund my flight, but they cancelled my entire round-trip ticket. Because I had to rebook on another airline that same day, it ended up costing me about $700 more for the entire trip. Ironically, when I went to the other terminal, I was able to get through security (by walking through the millimeter wave machines) with no problem.
I spent the week in LA, where I was able to tell my family and friends about the entire ordeal. They were appalled by the treatment I had received, but happy to see me safely with them, even if several hours later.
I wish I could say that the story ended there. It almost did. I had no trouble flying back to NYC on a red-eye the next week, in the wee hours of August 12th. But when I returned home the next week, opened the door to my new apartment, and looked around the room, I couldn’t help but notice that one of the suitcases sat several inches away from the wall. I could have sworn I pushed everything to the side of the room when I left, but I told myself that I may have just forgotten, since I was in a hurry when I dropped my bags off.
When I entered my bedroom, a chill went down my spine: the photograph on my wall had vanished. I looked around the room, but in vain. My apartment was almost completely empty; there was no wardrobe it could have slipped under, even on the off-chance it had fallen.
To this day, that photograph has not turned up. I can’t think of any “rational” explanation for it. Maybe there is one. Maybe a burglar broke into my apartment by picking the front door lock and, finding nothing of monetary value, took only my picture. In order to preserve my peace-of-mind, I’ve tried to convince myself that that’s what happened, so I can sleep comfortably at night.
But no matter how I’ve tried to rationalize this in the last week and a half, nothing can block out the memory of the chilling sensation I felt that first morning, lying on my air mattress, trying to forget the image of large, uniformed men invading the sanctuary of my home in my absence, wondering when they had done it, wondering why they had done it.
In all my life, I have only felt that same chilling terror once before – on one cold night in September twelve years ago, when I huddled in bed and tried to forget the terrible events in the news that day, wondering why they they had happened, wondering whether everything would be okay ever again.
Update: this has been picked up by Village Voice and Gawker and JetBlue has apologized over twitter.
How much is the Stacks Project graph like a random graph?
This is a guest post from Jordan Ellenberg, a professor of mathematics at the University of Wisconsin. Jordan’s book, How Not To Be Wrong, comes out in May 2014. It is crossposted from his blog, Quomodocumque, and tweeted about at @JSEllenberg.
Cathy posted some cool data yesterday coming from the new visualization features of the magnificent Stacks Project. Summary: you can make a directed graph whose vertices are the 10,445 tagged assertions in the Stacks Project, and whose edges are logical dependency. So this graph (hopefully!) doesn’t have any directed cycles. (Actually, Cathy tells me that the Stacks Project autovomits out any contribution that would create a logical cycle! I wish LaTeX could do that.)
Given any assertion v, you can construct the subgraph G_v of vertices which are the terminus of a directed path starting at v. And Cathy finds that if you plot the number of vertices and number of edges of each of these graphs, you get something that looks really, really close to a line.
Why is this so? Does it suggest some underlying structure? I tend to say no, or at least not much — my guess is that in some sense it is “expected” for graphs like this to have this sort of property.
Because I am trying to get strong at sage I coded some of this up this morning. One way to make a random directed graph with no cycles is as follows: start with N edges, and a function f on natural numbers k that decays with k, and then connect vertex N to vertex N-k (if there is such a vertex) with probability f(k). The decaying function f is supposed to mimic the fact that an assertion is presumably more likely to refer to something just before it than something “far away” (though of course the stack project is not a strictly linear thing like a book.)
Here’s how Cathy’s plot looks for a graph generated by N= 1000 and f(k) = (2/3)^k, which makes the mean out-degree 2 as suggested in Cathy’s post.

Pretty linear — though if you look closely you can see that there are really (at least) a couple of close-to-linear “strands” superimposed! At first I thought this was because I forgot to clear the plot before running the program, but no, this is the kind of thing that happens.
Is this because the distribution decays so fast, so that there are very few long-range edges? Here’s how the plot looks with f(k) = 1/k^2, a nice fat tail yielding many more long edges:

My guess: a random graph aficionado could prove that the plot stays very close to a line with high probability under a broad range of random graph models. But I don’t really know!
Update: Although you know what must be happening here? It’s not hard to check that in the models I’ve presented here, there’s a huge amount of overlap between the descendant graphs; in fact, a vertex is very likely to be connected all but c of the vertices below it for a suitable constant c.
I would guess the Stacks Project graph doesn’t have this property (though it would be interesting to hear from Cathy to what extent this is the case) and that in her scatterplot we are not measuring the same graph again and again.
It might be fun to consider a model where vertices are pairs of natural numbers and (m,n) is connected to (m-k,n-l) with probability f(k,l) for some suitable decay. Under those circumstances, you’d have substantially less overlap between the descendant trees; do you still get the approximately linear relationship between edges and nodes?


