Guest post: Open-Source Loan-Level Analysis of Fannie and Freddie
This is a guest post by Todd Schneider. You can read the full post with additional analysis on Todd’s personal site.
[M]ortgages were acknowledged to be the most mathematically complex securities in the marketplace. The complexity arose entirely out of the option the homeowner has to prepay his loan; it was poetic that the single financial complexity contributed to the marketplace by the common man was the Gordian knot giving the best brains on Wall Street a run for their money. Ranieri’s instincts that had led him to build an enormous research department had been right: Mortgages were about math.
The money was made, therefore, with ever more refined tools of analysis.
—Michael Lewis, Liar’s Poker (1989)
Fannie Mae and Freddie Mac began reporting loan-level credit performance data in 2013 at the direction of their regulator, the Federal Housing Finance Agency. The stated purpose of releasing the data was to “increase transparency, which helps investors build more accurate credit performance models in support of potential risk-sharing initiatives.”
The GSEs went through a nearly $200 billion government bailout during the financial crisis, motivated in large part by losses on loans that they guaranteed, so I figured there must be something interesting in the loan-level data. I decided to dig in with some geographic analysis, an attempt to identify the loan-level characteristics most predictive of default rates, and more. The code for processing and analyzing the data is all available on GitHub.
The “medium data” revolution
In the not-so-distant past, an analysis of loan-level mortgage data would have cost a lot of money. Between licensing data and paying for expensive computers to analyze it, you could have easily incurred costs north of a million dollars per year. Today, in addition to Fannie and Freddie making their data freely available, we’re in the midst of what I might call the “medium data” revolution: personal computers are so powerful that my MacBook Air is capable of analyzing the entire 215 GB of data, representing some 38 million loans, 1.6 billion observations, and over $7.1 trillion of origination volume. Furthermore, I did everything with free, open-source software.
What can we learn from the loan-level data?
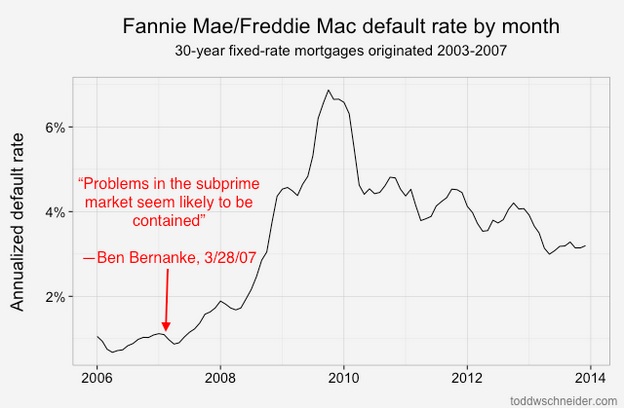
Loans originated from 2005-2008 performed dramatically worse than loans that came before them! That should be an extraordinarily unsurprising statement to anyone who was even slightly aware of the U.S. mortgage crisis that began in 2007:
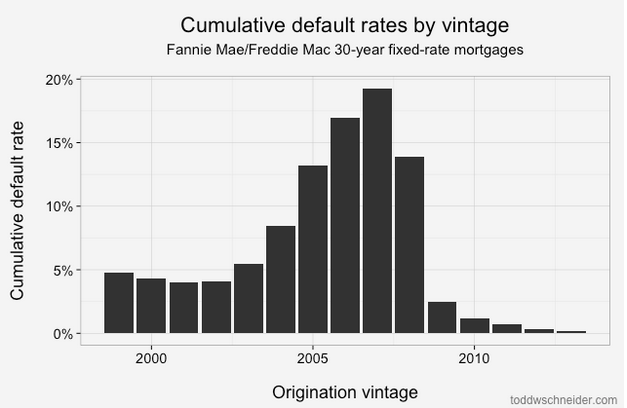
About 4% of loans originated from 1999 to 2003 became seriously delinquent at some point in their lives. The 2004 vintage showed some performance deterioration, and then the vintages from 2005 through 2008 show significantly worse performance: more than 15% of all loans originated in those years became distressed.
From 2009 through present, the performance has been much better, with fewer than 2% of loans defaulting. Of course part of that is that it takes time for a loan to default, so the most recent vintages will tend to have lower cumulative default rates while their loans are still young. But there has also been a dramatic shift in lending standards so that the loans made since 2009 have been much higher credit quality: the average FICO score used to be 720, but since 2009 it has been more like 765. Furthermore, if we look 2 standard deviations from the mean, we see that the low end of the FICO spectrum used to reach down to about 600, but since 2009 there have been very few loans with FICO less than 680:
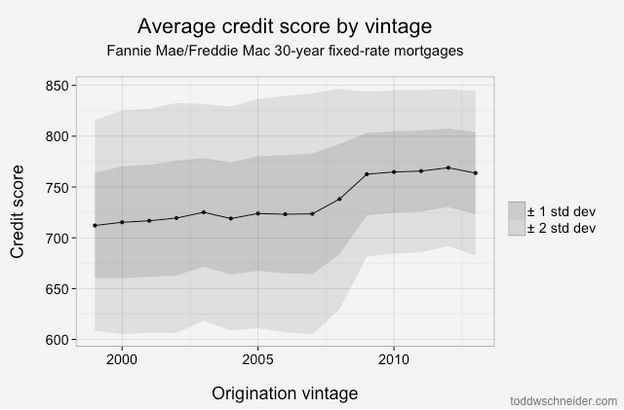
Tighter agency standards, coupled with a complete shutdown in the non-agency mortgage market, including both subprime and Alt-A lending, mean that there is very little credit available to borrowers with low credit scores (a far more difficult question is whether this is a good or bad thing!).
Geographic performance
Default rates increased everywhere during the bubble years, but some states fared far worse than others. I took every loan originated between 2005 and 2007, broadly considered to be the height of reckless mortgage lending, bucketed loans by state, and calculated the cumulative default rate of loans in each state:
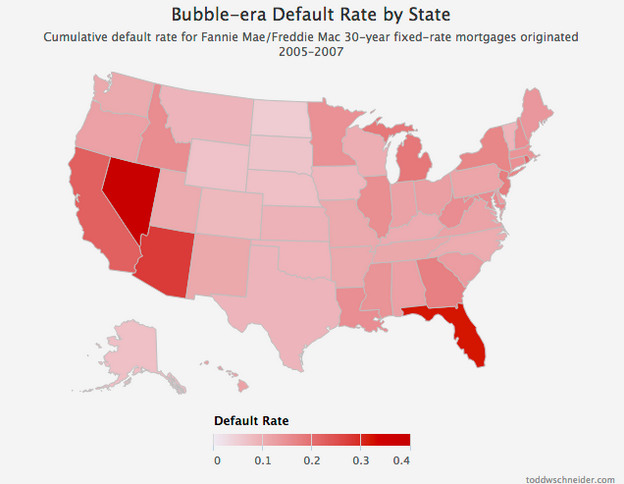
4 states in particular jump out as the worst performers: California, Florida, Arizona, and Nevada. Just about every state experienced significantly higher than normal default rates during the mortgage crisis, but these 4 states, often labeled the “sand states”, experienced the worst of it.
Read more
If you’re interested in more technical discussion, including an attempt to identify which loan-level variables are most correlated to default rates (the number one being the home price adjusted loan to value ratio), read the full post on toddwschneider.com, and be sure to check out the project on GitHub if you’d like to do your own data analysis.


I’m surprised that means and standard deviations are used to analyze credit scores. Granted that the distribution is left-skewed instead of bell-shaped (see link below), wouldn’t the median and quartiles/boxplots be more appropriate?
http://www.creditscoring.com/creditscore/distribution.html
LikeLike
“Of course part of that is that it takes time for a loan to default, so the most recent vintages will tend to have lower cumulative default rates while their loans are still young. ”
That’s a statement begging for some extrapolation based on historical data, either light (“quic & dirty” analysis by taking a scaling multiplier) or more heavy (looking at the sensitivity of the multiplier to overall default rates, volatility in scaling factor, etc.).
FoW
LikeLike
Good thing it is raining today…
Doris Dungy, aka ‘Tanta’ worked in the mortgage industry and blogged at Bill McBride’s Calculated Risk web blog. Her posts were compiled under the heading “The Compleat Ubernerd”
“What’s a Compleat UberNerd?
Someone who has read all these posts already and quotes them at tailgate parties. You can recognize them because their adolescent children walk ten paces ahead of them at the mall, in hopes that people will think they’re someone else’s parents.”
http://www.calculatedriskblog.com/2007/03/ficos-and-aus-we-will-add-your.html
Read more at http://www.calculatedriskblog.com/2007/07/compleat-ubernerd.html#HCJF9aMImmSrsMmi.99
LikeLike
Reblogged this on schapshow.
LikeLike