Archive
Gender And The Harvard Math Department
This is a guest post by Meena Boppana, a junior at Harvard and former president of the Harvard Undergraduate Math Association (HUMA). Meena is passionate about addressing the gender gap in math and has co-lead initiatives including the Harvard math survey and the founding of the Harvard student group Gender Inclusivity in Math (GIIM).
I arrived at Harvard in 2012 head-over-heels in love with math. Encouraged to think mathematically since I was four years old by my feminist mathematician dad, I had even given a TEDx talk in high school declaring my love for the subject. I was certainly qualified and excited enough to be a math major.
Which is why, three years later, I think about how it is that virtually all my female friends with insanely strong math backgrounds (e.g. math competition stars) decided not to major in math (I chose computer science). This year, there were no female students in Math 55a, the most intense freshman math class, and only two female students graduating with a primary concentration in math. There are also a total of zero tenured women faculty in Harvard math.
So, I decided to do some statistical sleuthing and co-directed a survey of Harvard undergraduates in math. I was inspired by the work of Nancy Hopkins and other pioneering female scientists at MIT, who quantified gender inequities at the Institute – even measuring the square footage of their offices – and sparked real change. We got a 1/3 response rate among all math concentrators at Harvard, with 150 people in total (including related STEM concentrations) filling it out.
The main finding of our survey analysis is that the dearth of women in Harvard math is far more than a “pipeline issue” stemming from high school. So, the tale that women are coming in to Harvard knowing less math and consequently not majoring in math is missing much of the picture. Women are dropping out of math during their years at Harvard, with female math majors writing theses and continuing on to graduate school at far lower rates than their male math major counterparts.
And it’s a cultural issue. Our survey indicated that many women would like to be involved in the math department and aren’t, most women feel uncomfortable as a result of the gender gap, and women feel uncomfortable in math department common spaces.

Source: Harvard Math Survey
The simple act of talking about the gender gap has opened the floodgates to great conversations. I had always assumed that because no one was talking about the gender gap, no one cared. But after organizing a panel on gender in the math department which drew 150 people with a roughly equal gender split and students and faculty alike, I realized that my classmates of all genders feel more disempowered than apathetic.
The situation is bad, but certainly not hopeless. Together with a male freshman math major, I am founding a Harvard student group called Gender Inclusivity in Math (GIIM). The club has the two-fold goal of increasing community among women in math, including dinners, retreats, and a women speaker series, and also addressing the gender gap in the math department, continuing the trend of surveys and gender in math discussions. The inclusion of male allies is central to our club mission, and the support from male allies at the student and faculty level that we have received makes me optimistic about the will for change.
Ultimately, it is my continued love for math which has driven me to take action. Mathematics is too beautiful and important to lose 50 percent (or much more when considering racial and class-based inequities) of the potential population of math lovers.
Looking for big data reading suggestions
I have been told by my editor to take a look at the books already out there on big data to make sure my book hasn’t already been written. For example, today I’m set to read Robert Scheer’s They Know Everything About You: how data-collecting corporations and snooping government agencies are destroying democracy.
This book, like others I’ve already read and written about (Bruce Schneier’s Data and Goliath, Frank Pasquale’s Black Box Society, and Julia Angwin’s Dragnet Nation) are all primarily concerned with individual freedom and privacy, whereas my book is primarily concerned with social justice issues, and each chapter gives an example of how big data is being used a tool against the poor, against minorities, against the mentally ill, or against public school teachers.
Not that my book is entirely different from the above books, but the relationship is something like what I spelled out last week when I discussed the four political camps in the big data world. So far the books I’ve found are focused on the corporate angle or the privacy angle. There may also be books focused on the open data angle, but I’m guessing they have even less in common with my book, which focuses on the ways big data increase inequality and further alienate already alienated populations.
If any of you know of a book I should be looking at, please tell me!
Fingers crossed – book coming out next May
As it turns out, it takes a while to write a book, and then another few months to publish it.
I’m very excited today to tentatively announce that my book, which is tentatively entitled Weapons of Math Destruction: How Big Data Increases Inequality and Threatens Democracy, will be published in May 2016, in time to appear on summer reading lists and well before the election.
Fuck yeah! I’m so excited.
p.s. Fight for 15 is happening now.
Creepy big data health models
There’s an excellent Wall Street Journal article by Joseph Walker, entitled Can a Smartphone Tell if You’re Depressed?, that describes a lot of creepy new big data projects going on now in healthcare, in partnership with hospitals and insurance companies.
Some of the models come in the form of apps, created and managed by private, third-party companies that try to predict depression in, for example, postpartum women. They don’t disclose what they are doing to many of the women, or the extent of what they’re doing, according to the article. They own the data they’ve collected at the end of the day and, presumably, can sell it to anyone interested in whether a woman is depressed. For example, future employers. To be clear, this data is generally not covered by HIPAA.
Perhaps the creepiest example is a voice analysis model:
Nurses employed by Aetna have used voice-analysis software since 2012 to detect signs of depression during calls with customers who receive short-term disability benefits because of injury or illness. The software looks for patterns in the pace and tone of voices that can predict “whether the person is engaged with activities like physical therapy or taking the right kinds of medications,” Michael Palmer, Aetna’s chief innovation and digital officer, says.
…
Patients aren’t informed that their voices are being analyzed, Tammy Arnold, an Aetna spokeswoman, says. The company tells patients the calls are being “recorded for quality,” she says.
“There is concern that with more detailed notification, a member may alter his or her responses or tone (intentionally or unintentionally) in an effort to influence the tool or just in anticipation of the tool,” Ms. Arnold said in an email.
In other words, in the name of “fear of gaming the model,” we are not disclosing the creepy methods we are using. Also, considering that the targets of this model are receiving disability benefits, I’m wondering if the real goal is to catch someone off their meds and disqualify them for further benefits or something along those lines. Since they don’t know they are being modeled, they will never know.
Conclusion: we need more regulation around big data in healthcare.
Big data and class
About a month ago there was an interesting article in the New York Times entitled Blowing Off Class? We Know. It discusses the “big data” movement in colleges around the country. For example, at Ball State, they track which students go to parties at the student center. Presumably to help them study for tests, or maybe to figure out which ones to hit up for alumni gifts later on.
There’s a lot to discuss in this article, but I want to focus today on one piece:
Big data has a lot of influential and moneyed advocates behind it, and I’ve asked some of them whether their enthusiasm might also be tinged with a little paternalism. After all, you don’t see elite institutions regularly tracking their students’ comings and goings this way. Big data advocates don’t dispute that, but they also note that elite institutions can ensure that their students succeed simply by being very selective in the first place.
The rest “get the students they get,” said William F. L. Moses, the managing director of education programs at the Kresge Foundation, which has given grants to the innovation alliance and to bolster data-analytics efforts at other colleges. “They have a moral obligation to help them succeed.”
This is a sentiment I’ve noticed a lot, although it’s not usually this obvious. Namely, the elite don’t need to be monitored, but the rabble does. The rich and powerful get to be quirky philosophers but the rest of the population need to be ranked and filed. And, by the way, we are spying on them for their own good.
In other words, never mind how big data creates and expands classism; classism already helps decide who is put into the realm of big data in the first place.
It feeds into the larger question of who is entitled to privacy. If you want to be strict about your definition of pricacy, you might say “nobody.” But if you recognize that privacy is a spectrum, where we have a variable amount of information being collected on people, and also a variable amount of control over people whose information we have collected, then upon study, you will conclude that privacy, or at least relative privacy, is for the rich and powerful. And it starts early.
Links (with annotation)
I’ve been heads down writing this week but I wanted to share a bunch of great stuff coming out.
- Here’s a great interview with machine learning expert Michael Jordan on various things including the big data bubble (hat tip Alan Fekete). I had a similar opinion over a year ago on that topic. Update: here’s Michael Jordan ranting about the title for that interview (hat tip Akshay Mishra). I never read titles.
- Have you taken a look at Janet Yellen’s speech on inequality from last week? She was at a conference in Boston about inequality when she gave it. It’s a pretty amazing speech – she acknowledges the increasing inequality, for example, and points at four systems we can focus on as reasons: childhood poverty and public education, college costs, inheritances, and business creation. One thing she didn’t mention: quantitative easing, or anything else the Fed has actual control over. Plus she hid behind the language of economics in terms of how much to care about any of this or what she or anyone else could do. On the other hand, maybe it’s the most we could expect from her. The Fed has, in my opinion, already been overreaching with QE and we can’t expect it to do the job of Congress.
- There’s a cool event at the Columbia Journalism School tomorrow night called #Ferguson: Reporting a Viral News Story (hat tip Smitha Corona) which features sociologist and writer Zeynep Tufekci among others (see for example this article she wrote), with Emily Bell moderating. I’m going to try to go.
- Just in case you didn’t see this, Why Work Is More And More Debased (hat tip Ernest Davis).
- Also: Poor kids who do everything right don’t do better than rich kids who do everything wrong (hat tip Natasha Blakely).
- Jesse Eisenger visits the defense lawyers of the big banks and writes about his experience (hat tip Aryt Alasti).
After writing this list, with all the hat tips, I am once again astounded at how many awesome people send me interesting things to read. Thank you so much!!
Upcoming data journalism and data ethics conferences
Today
Today I’m super excited to go to the opening launch party of danah boyd’s Data and Society. Data and Society has a bunch of cool initiatives but I’m particularly interested in their Council for Big Data, Ethics, and Society. They were the people that helped make the Podesta Report on Big Data as good as it was. There will be a mini-conference this afternoon I’m looking forward to very much. Brilliant folks doing great work and talking to each other across disciplinary lines, can’t get enough of that stuff.
This weekend
This coming Saturday I’ll be moderating a panel called Spotlight on Data-Driven Journalism: The job of a data journalist and the impact of computational reporting in the newsroom at the New York Press Club Conference on Journalism. The panelists are going to be great:
- John Keefe @jkeefe, Sr. editor, data news & J-technology, WNYC
- Maryanne Murray @lightnosugar, Global head of graphics, Reuters
- Zach Seward @zseward, Quartz
- Chris Walker @cpwalker07, Dir., data visualization, Mic News
The full program is available here.
December 12th
In mid-December I’m on a panel myself at the Fairness, Accountability, and Transparency in Machine Learning Conference in Montreal. This conference seems to directly take up the call of the Podesta Report I mentioned above, and seeks to provide further research into the dangers of “encoding discrimination in automated decisions”. Amazing! So glad this is happening and that I get to be part of it. Here are some questions that will be taken up at this one-day conference (more information here):
- How can we achieve high classification accuracy while eliminating discriminatory biases? What are meaningful formal fairness properties?
- How can we design expressive yet easily interpretable classifiers?
- Can we ensure that a classifier remains accurate even if the statistical signal it relies on is exposed to public scrutiny?
- Are there practical methods to test existing classifiers for compliance with a policy?
Reverse-engineering Chinese censorship
This recent paper written by Gary King, Jennifer Pan, and Margaret Roberts explores the way social media posts are censored in China. It’s interesting, take a look, or read this article on their work.
Here’s their abstract:
Existing research on the extensive Chinese censorship organization uses observational methods with well-known limitations. We conducted the first large-scale experimental study of censorship by creating accounts on numerous social media sites, randomly submitting different texts, and observing from a worldwide network of computers which texts were censored and which were not. We also supplemented interviews with confidential sources by creating our own social media site, contracting with Chinese firms to install the same censoring technologies as existing sites, and—with their software, documentation, and even customer support—reverse-engineering how it all works. Our results offer rigorous support for the recent hypothesis that criticisms of the state, its leaders, and their policies are published, whereas posts about real-world events with collective action potential are censored.
Interesting that they got so much help from the Chinese to censor their posts. Also keep in mind a caveat from the article:
Yu Xie, a sociologist at the University of Michigan, Ann Arbor, says that although the study is methodologically sound, it overemphasizes the importance of coherent central government policies. Political outcomes in China, he notes, often rest on local officials, who are evaluated on how well they maintain stability. Such officials have a “personal interest in suppressing content that could lead to social movements,” Xie says.
I’m a sucker for reverse-engineering powerful algorithms, even when there are major caveats.
Ello, Enron, and the future of data privacy
If you think Ello is the newest safest social media platform, you might want to think again.
Or at the very least, go ahead and read this piece by my data journalist buddy Meredith Broussard, entitled ‘Ello, social media newcomer! Goodbye, data security fears?. Meredith has read the fine print in Ello’s security policy, and it’s not great news.
What’s next for mathbabe?
The Columbia J-School program that I have been directing, The Lede Program in Data Journalism, has wound down this past week and in four days my 6-month contract with Columbia will end. I’ve had a fantastic time and I am super proud of what we accomplished this past summer. The students from the program are awesome and many of them are now my friends. About half of them are still engaged in classes and will continue to work this semester with Jonathan Soma, who absolutely rocks, and of course my fabulous colleague Theresa Bradley, who will step in as Director now that I’m leaving.
So, what’s next? I am happy to say that as of today (or at least as of next Monday when my kids are really in school full-time) I’m writing my book Weapons of Math Destruction on a full-time basis. This comes as a huge relief, since the internal pressure I have to finish this book is reminiscent of how I felt when I needed to write my thesis: enormous, but maybe even worse than then since the timeliness of the book could not be overstated, and I want to get this book out before the moment passes.
In the meantime I have some cool talks I’m planning to go to (like this one I went to already!) and some I’m planning to give. So for example, I’m giving a keynote at The Yale Day of Data later this month, which is going to be fun and interesting.
My Yale talk is basically a meditation on what can be achieved by academic data science institutions, what presents cultural and technical obstacles to collaboration, and why we need to do it anyway. It’s no less than a plea for Yale to create a data science institute with a broad definition of data science – so including scholars from law and from journalism as well as the fields you think of already when you think of data science – and a broad mandate to have urgent conversations across disciplines about the “big data revolution.” That conversation has already begun at the Information Society Project at Yale Law School, which makes me optimistic.
I also plan to continue my weekly Slate Money podcasts with Felix Salmon and Jordan Weissmann. Today we’re discussing the economic implications of Scottish independence, Felix’s lifetime earnings calculator, and the Fed’s new liquidity rules and how they affect municipalities, which my friend Marc Joffe guest blogged about yesterday.
A decision tree for decision trees
For a while now I’ve been thinking I should build a decision tree for deciding which algorithm to use on a given data project. And yes, I think it’s kind of cool that “decision tree” would be an outcome on my decision tree. Kind of like a nerd pun.
I’m happy to say that I finally started work on my algorithm decision tree, thanks to this website called gliffy.com which allows me to build flowcharts with an easy online tool. It was one of those moments when I said to myself, this morning at 6am, “there should be a start-up that allows me to build a flowchart online! Let me google for that” and it totally worked. I almost feel like I willed gliffy.com into existence.
So here’s how far I’ve gotten this morning:

Not far! But I also learned how to use the tool.
I looked around the web to see if I’m doing something that’s already been done and I came up with this:
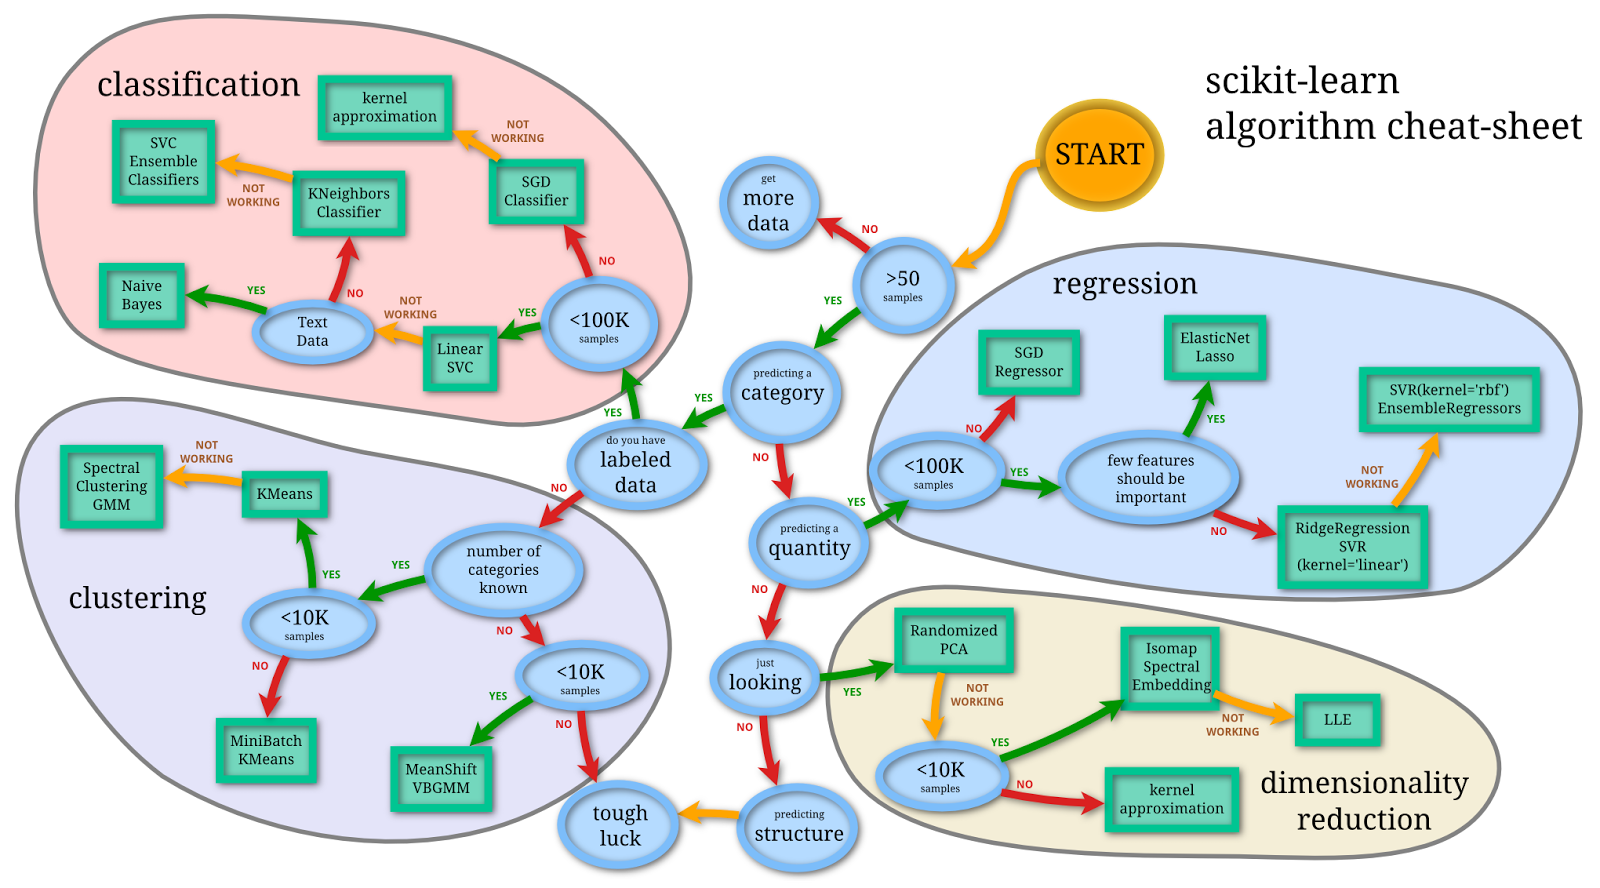
I appreciate the effort but this is way more focused on the size of the data than I intend to be, at least for now. And here’s another one that’s even less like the one I want to build but is still impressive.
Because here’s what I want to focus on: what kind of question are you answering with which algorithm? For example, with clustering algorithms you are, you know, grouping similar things together. That one’s easy, kind of, although plenty of projects have ended up being clustering or classifying algorithms whose motivating questions did not originally take on the form “how would we group these things together?”.
In other words, the process of getting at algorithms from questions is somewhat orthogonal to the normal way algorithms are introduced, and for that reason taking me some time to decide what the questions are that I need to ask in my decision tree. Right about now I’m wishing I had taken notes when my Lede Program students asked me to help them with their projects, because embedded in those questions were some great examples of data questions in search of an algorithm.
Please give me advice!
When the story IS the interaction with the public
Here at the Lede Program we’ve been getting lots of different perspectives on what data journalism is and what it could be. As usual I will oversimplify for the sake of clarity, and apologies in advance to anyone I might offend.
The old school version of data journalism, which is called computer assisted reporting, maintains that a data story is first and foremost a story and should be viewed as such: you are investigating and interrogating the data as you would a witness, but the data isn’t itself a story, but rather a way of gathering evidence for the claims posed in the story. Every number cited needs to be independently supported with a secondary source.
Really important journalism lives in this context and is supported by the data, and the journalists in this realm are FOIA experts and speak truth to power in an exciting way. Think leaks and whistleblowers.
The new school vision of data journalism – again, entirely oversimplified – is that, by creating interesting data interactives that allow people to see how the news affects them – whether that means a map of “stuff happening” where they can see the stuff happening near them, or a big dataset that people can interact with in a tailored way, or a jury duty quiz that allows people to see how answers might get them kicked off or kept on a jury.
I imagine that some of these new-fangled approaches don’t even seem like stories at all to the old-school journalists, who want to see a bad guy caught, or a straight-up story told with a twist and a surprise and a “human face”. I’m not sure many of them would even get past the pitch stage if proffered to a curmudgeonly editor (and all editors are curmudgeonly, that’s just a fact).
The new interactive stories do not tell one story. Instead, they tell a bunch of stories to a bunch of people, and that interaction itself becomes the story. They also educate the public in a somewhat untamed way: by interacting with a database a reader can see variations in time, or in space, or in demographic, at least if the data is presented carefully.
Similarly, by seeing how each question on a jury duty quiz nudges you towards the plaintiff or the defendant, you can begin to see how seemingly innocuous information collected about you accumulates, which is how profiles are formed, on and offline.
Navigating the mindset for data journalism
I’ve been working my butt off this summer starting up a data journalism program and teaching in it. I couldn’t ask for a better crew of students and instructors: engaged, intelligent, brave, and eager to learn. And my class has been amazing, due to the incredibly guest speakers who have given their time to us. On Tuesday we were honored to have danah boyd come talk about her new book It’s Complicated, and yesterday Julie Steele talked to us about visualization and how our technological tools affect our design, which was fabulous and also super useful for the class projects.
I feel like it’s the picture perfect situation for the emerging field of data journalism to be defined and developed. Even so, there are real obstacles to getting this right that I hadn’t anticipated. Let me focus on obstacles that exist within the academy, since that’s what I’ve been confronting these past few weeks and months.
Basically, as everyone knows, academia is severely partitioned between departments, both physically and culturally. Data journalism sits more or less between journalism and computer science, and both of those fields have cultures that are unintentionally hostile to a thriving new descendant. Let me exaggerate for effect, which is what I do.
In cartoonish form, introductory computer science classes are competitive weeder classes that promote a certain kind of narrow, clever, problem-solving approach. If you get your code to work, and work fast, you’re done, and you move quickly to the next question because there’s an avalanche of work and technical issues to plow through.
You don’t get that much time to think, and you almost never address the question of how to do things differently, or why syntax is inconsistent between different parts of python, or generally why a computer language is the way it is and how it could have been designed differently and what the history was that made it so, because you don’t have time and you have to learn learn learn. In other words, it’s kind of the least context-laden and most content-heavy way of learning that you can imagine. You impress people by what you can make work, and how fast, and it is a deep but narrow way of working, kind of like efficient well-digging.
Now let’s paint an equally exaggerated vision of the journalist training. A good journalist collects a ton of information to create a kind of palette for the topic in question, and dives straight into ambiguity or history or bias or contradiction to learn even more, and then starts to build a thesis after such comprehensive information collection has occurred. In other words, the context is what makes a topic interesting and important and newsworthy, and the human and gripping example is critical to illustrate the topic as well as to make it into a story rather than a set of facts. You impress people by your ability to synthesize an incredible breadth of knowledge and then find the hook that makes it a compelling story and draw it out and make it real. This is a broad filtering method where you don’t take the next step until you know you should.
To make it even more dumbed down, journalists are ever aware of the things they know they don’t know, and desperately want to fill in their knowledge gaps because otherwise they feel fraudulent, like they’re jumping to unwarranted conclusions. Computer scientists don’t care about not knowing things as long as their programs work. They can be blithe with respect to messy human details, which of course means they sometimes don’t notice or figure out their data has selection bias because they got an answer, but also means they are super efficient.
Now you can see why it’s a tough thing to teach journalists to code, and it’s also a tough thing to expect coders to become journalists. Both sides emphasize a kind of learning and a definition of success that the other side is blind to.
What would a middle ground look like? In the ideal scenario, it would be a place that appreciates and uses the power of data and programming and spends the time learning the history and searching the inherent human bias of data collection and analysis. That scenario is exciting, but it clearly takes time to build and represents a real investment both by the academic institutions that build it and by the media that eventually hire the data journalists coming from it.
In other words, the outside world has to actually want to hire the emerging thoughtful fruit of that labor. It brings me to other problems for data journalism that largely live outside the academic world, which I might blog about at some other time.
Nerding out: RSA on an iPython Notebook
Yesterday was a day filled with secrets and codes. In the morning, at The Platform, we had guest speaker Columbia history professor Matthew Connelly, who came and talked to us about his work with declassified documents. Two big and slightly depressing take-aways for me were the following:
- As records have become digitized, it has gotten easy for people to get rid of archival records in large quantities. Just press delete.
- As records have become digitized, it has become easy to trace the access of records, and in particular the leaks. Connelly explained that, to some extent, Obama’s harsh approach to leakers and whistleblowers might be explained as simply “letting the system work.” Yet another way that technology informs the way we approach human interactions.
After class we had section, in which we discussed the Computer Science classes some of the students are taking next semester (there’s a list here) and then I talked to them about prime numbers and the RSA crypto system.
I got really into it and wrote up an iPython Notebook which could be better but is pretty good, I think, and works out one example completely, encoding and decoding the message “hello”.
The underlying file is here but if you want to view it on the web just go here.
How to think like a microeconomist
Yesterday we were pleased to have Suresh Naidu guest lecture in The Platform. He came in and explained, very efficiently because he was leaving at 11am for a flight at noon at LGA (which he made!!) how to think like an economist. Or at least an applied microeconomist. Here are his notes:
Applied microeconomics is basically organized a few simple metaphors.
- People respond to incentives.
- A lot of data can be understood through the lens of supply and demand.
- Causality is more important than prediction.
There was actually more on the schedule, but Suresh got into really amazing examples to explain the above points and we ran out of time. At some point, when he was describing itinerant laborers in the United Arab Emirates, and looking at pay records and even visiting a itinerant labor camp, I was thinking that Suresh is possibly an undercover hardcore data journalist as well as an amazing economist.
As far as the “big data” revolution goes, we got the impression from Suresh that microeconomists have been largely unmoved by its fervor. For one, they’ve been doing huge analyses with large data sets for quite a while. But the real reason they’re unmoved, as I infer from his talk yesterday, is that big data almost always focuses on descriptions of human behavior, and sometimes predictions, and almost never causality, which is what economists care about.
A side question: why is it that economists only care about causality? Well they do, and let’s take that as a given.
So, now that we know how to think like an economist, let’s read this “Room For Debate” about overseas child labor with our new perspective. Basically the writers, or at least three out of four of them, are economists. So that means they care about “why”. Why is there so much child labor overseas? How can the US help?
The first guy says that strong unions and clear signals from American companies works, so the US should do its best to encourage the influence of labor unions.
The lady economist says that bans on child labor are generally counterproductive, so we should give people cash money so they won’t have to send their kids to work in the first place.
The last guy says that we didn’t even stop having child labor in our country until wage workers were worried about competition from children. So he wants the U.S. to essentially ignore child labor in other countries, which he claims will set the stage for other countries to have that same worry and come to the same conclusion by themselves. Time will help, as well as good money from the US companies.
So the economists don’t agree, but they all share one goal: to figure out how to tweak a tweakable variable to improve a system. And hopefully each hypothesis can be proven with randomized experiments and with data, or at least evidence can be gathered for or against.
One more thing, which I was relieved to hear Suresh say. There’s a spectrum of how much people “believe” in economics, and for that matter believe in data that seems to support a theory or experiment, and that spectrum is something that most economists run across on a daily basis. Even so, it’s not clear there’s a better way to learn things about the world than doing your best to run randomized experiments, or find close-to-randomized experiments and see how what they tell you.
The Platform starts today
Hey my class starts today, I’m totally psyched!
The syllabus is up on github here and I prepared an iPython notebook here showing how to do basic statistics in python, and culminating in an attempt to understand what a statistically significant but tiny difference means, in the context of the Facebook Emotion study. Here’s a useless screenshot which I’m including because I’m proud:

If you want to follow along install anaconda on your machine and type “ipython notebook –pylab inline” into a terminal. Then you can just download this notebook and run it!
Most of the rest of the classes will feature an awesome guest lecturer, and I’m hoping to blog about those talks with their permission, so stay tuned.
The Lede Program students are rocking it
Yesterday was the end of the first half of the Lede Program, and the students presented their projects, which were really impressive. I am hoping some of them will be willing to put them up on a WordPress site or something like that in order to showcase them and so I can brag about them more explicitly. Since I didn’t get anyone’s permission yet, let me just say: wow.
During the second half of the program the students will do another project (or continue their first) as homework for my class. We’re going to start planning for that on the first day, so the fact that they’ve all dipped their toes into data projects is great. For example, during presentations yesterday I heard the following a number of times: “I spent most of my time cleaning my data” or “next time I will spend more time thinking about how to drill down in my data to find an interesting story”. These are key phrases for people learning lessons with data.
Since they are journalists (I’ve learned a thing or two about journalists and their mindset in the past few months) they love projects because they love deadlines and they want something they can add to their portfolio. Recently they’ve been learning lots of geocoding stuff, and coming up they’ll be learning lots of algorithms as well. So they’ll be well equipped to do some seriously cool shit for their final project. Yeah!
In addition to the guest lectures I’m having in The Platform, I’ll also be reviewing prerequisites for the classes many of them will be taking in the Computer Science department in the fall, so for example linear algebra, calculus, and basic statistics. I just bought them all a copy of How to Lie with Statistics as well as The Cartoon Guide to Statistics, both of which I adore. I’m also making them aware of Statistics Done Wrong, which is online. I am also considering The Cartoon Guide to Calculus, which I have but I haven’t read yet.
Keep an eye out for some of their amazing projects! I’ll definitely blog about them once they’re up.
What constitutes evidence?
My most recent Slate Money podcast with Felix Salmon and Jordan Weissmann was more than usually combative. I mean, we pretty much always have disagreements, but Friday it went beyond the usual political angles.
Specifically, Felix thought I was jumping too quickly towards a dystopian future with regards to medical data. My claim was that, now that the ACA has motivated hospitals and hospital systems to keep populations healthy – a good thing in itself – we’re seeing dangerous side-effects involving the proliferation of health profiling and things like “health scores” attached to people much like we now have credit scores. I’m worried that such scores, which are created using data not covered under HIPAA, will be used against people when they try to get a job.
Felix asked me to point to evidence of such usage.
Of course, it’s hard to do that, partly because it’s just the beginning of such data collection – although the FTC’s recent report pointed to data warehouses that already puts people into categories such as “diabetes interest” – and also because it’s proprietary all the way down. In other words, web searches and the like are being legally collected and legally sold and then it’s legal to use risk scores or categories to filter job applications. What’s illegal is to use HIPAA-protected data such as disability status to remove someone from consideration for a job, but that’s not what’s happening.
Anyhoo, it’s made me think. Am I a conspiracy theorist for worrying about this? Or is Felix lacking imagination if he requires evidence to believe it? Or some combination? This is super important to me because if I can’t get Felix, or someone like Felix, to care about this issue, I’m afraid it will be ignored.
This kind of thing came up a second time on that same show, when Felix complained that the series of articles (for example this one from NY Magazine) talking about money laundering in New York real estate also lacked evidence. But that’s also tricky since the disclosure requirements on real estate are not tight. In other words, they are avoiding collecting evidence of money laundering, so it’s hard to complain there’s a lack of data. From my perspective the journalists investigating this article did a good job finding examples of laundering and showing it was easy to set up (especially in Delaware). But Felix wasn’t convinced.
It’s a general question I have, actually, and I’m glad to be involved with the Lede Program because it’s actually my job to think about this kind of thing, especially in the context of journalism. Namely, when do we require data – versus anecdotal evidence – to believe in something? And especially when the data is being intentionally obscured?
Critical Questions for Big Data by danah boyd & Kate Crawford
I’m teaching a class this summer in the Lede Program, starting in mid-July, which is called The Platform. Here’s the course description:
This course begins with the idea that computing tools are the products of human ingenuity and effort. They are never neutral and carry with them the biases of their designers and their design process. “Platform studies” is a new term used to describe investigations into these relationships between computing technologies and the creative or research products that they help to generate. How you understand how data, code, and algorithms affect creative practices can be an effective first step toward critical thinking about technology. This will not be purely theoretical, however, and specific case studies, technologies, and project work will make the ideas concrete.
Since my first class is coming soon, I’m actively thinking about what to talk about and which readings to assign. I’ve got wonderful guest lecturers coming, and for the most part the class will focus on those guest lecturers and their topics, but for the first class I want to give them an overview of a very large subject.
I’ve decided that danah boyd and Kate Crawford’s recent article, Critical Questions for Big Data, is pretty much perfect for this goal. I’ve read and written a lot about big data but even so I’m impressed by how clearly and comprehensively they have laid out their provocations. And although I’ve heard many of the ideas and examples before, some of them are new to me, and are directly related to the theme of the class, for example:
Twitter and Facebook are examples of Big Data sources that offer very poor archiving and search functions. Consequently, researchers are much more likely to focus on something in the present or immediate past – tracking reactions to an election, TV finale, or natural disaster – because of the sheer difficulty or impossibility of accessing older data.
Of course the students in the Lede are journalists, not academic researchers, which the article mostly addresses, and moreover they are not necessarily working with big data per se, but even so they are increasingly working with social media data, and moreover they are probably covering big data even if they don’t directly analyze it. So I think it’s still relevant to them. Or another way to express this is that one thing we will attempt to do in class is examine the extent to which their provocations are relevant.
Here’s another gem, directly related to the Facebook experiment I discussed yesterday:
As computational scientists have started engaging in acts of social science, there is a tendency to claim their work as the business of facts and not interpretation. A model may be mathematically sound, an experiment may seem valid, but as soon as a researcher seeks to understand what it means, the process of interpretation has begun. This is not to say that all interpretations are created equal, but rather that not all numbers are neutral.
In fact, what with this article and that case study, I’m pretty much set for my first day, after combining them with a discussion of the students’ projects and some related statistical experiments.
I also hope to invite at least one of the authors to come talk to the class, although I know they are both incredibly busy. Danah boyd, who recently came out with a book called It’s Complicated: the social lives of networked teens, also runs the Data & Society Research Institute, a NYC-based think/do tank focused on social, cultural, and ethical issues arising from data-centric technological development. I’m hoping she comes and talks about the work she’s starting up there.
Thanks for a great case study, Facebook!
I’m super excited about the recent “mood study” that was done on Facebook. It constitutes a great case study on data experimentation that I’ll use for my Lede Program class when it starts mid-July. It was first brought to my attention by one of my Lede Program students, Timothy Sandoval.
My friend Ernest Davis at NYU has a page of handy links to big data articles, and at the bottom (for now) there are a bunch of links about this experiment. For example, this one by Zeynep Tufekci does a great job outlining the issues, and this one by John Grohol burrows into the research methods. Oh, and here’s the original research article that’s upset everyone.
It’s got everything a case study should have: ethical dilemmas, questionable methodology, sociological implications, and questionable claims, not to mention a whole bunch of media attention and dissection.
By the way, if I sound gleeful, it’s partly because I know this kind of experiment happens on a daily basis at a place like Facebook or Google. What’s special about this experiment isn’t that it happened, but that we get to see the data. And the response to the critiques might be, sadly, that we never get another chance like this, so we have to grab the opportunity while we can.


