Archive
Tailored political ads threaten democracy
Not sure if you saw this recent New York Times article on the new data-driven political ad machines. Consider for example, the 2013 Virginia Governor campaign won by Terry McAuliffe:
…the McAuliffe campaign invested heavily in both the data and the creative sides to ensure it could target key voters with specialized messages. Over the course of the campaign, he said, it reached out to 18 to 20 targeted voter groups, with nearly 4,000 Facebook ads, more than 300 banner display ads, and roughly three dozen different pre-roll ads — the ads seen before a video plays — on television and online.
Now I want you to close your eyes and imagine what kind of numbers we will see for the current races, not to mention the upcoming presidential election.
What’s crazy to me about the Times article is that it never questions the implications of this movement. The biggest problem, it seems, is that the analytics have surpassed the creative work of making ads: there are too many segments of populations to tailor the political message to, and not enough marketers to massage those particular messages for each particular segment. I’m guessing that there will be more money and more marketers in the presidential campaign, though.
Translation: politicians can and will send different messages to individuals on Facebook, depending on what they think we want to hear. Not that politicians follow through with all their promises now – they don’t, of course – but imagine what they will say when they can make a different promise to each group. We will all be voting for slightly different versions of a given story. We won’t even know when the politician is being true to their word – which word?
This isn’t the first manifestation of different messages to different groups, of course. Romney’s famous “47%” speech was a famous example of tailored messaging to super rich donors. But on the other hand, it was secretly recorded by a bartender working the event. There will be no such bartenders around when people read their emails and see ads on Facebook.
I’m not the only person worried about this. For example, ProPublica studied this in Obama’s last campaign (see this description). But given the scale of the big data political ad operations now in place, there’s no way they – or anyone, really – can keep track of everything going on.
There are lots of ways that “big data” is threatening democracy. Most of the time, it’s by removing open discussions of how we make decisions and giving them to anonymous and inaccessible quants; think evidence-based sentencing or value-added modeling for teachers. But this political campaign ads is a more direct attack on the concept of a well-informed public choosing their leader.
Guest post: Clustering and predicting NYC taxi activity
This is a guest post by Deepak Subburam, a data scientist who works at Tessellate.

from NYCTaxi.info
Greetings fellow Mathbabers! At Cathy’s invitation, I am writing here about NYCTaxi.info, a public service web app my co-founder and I have developed. It overlays on a Google map around you estimated taxi activity, as expected number of passenger pickups and dropoffs this current hour. We modeled these estimates from the recently released 2013 NYC taxi trips dataset comprising 173 million trips, the same dataset that Cathy’s post last week on deanonymization referenced. Our work will not help you stalk your favorite NYC celebrity, but guide your search for a taxi and maybe save some commute time. My writeup below shall take you through the four broad stages our work proceeded through: data extraction and cleaning , clustering, modeling, and visualization.
We extract three columns from the data: the longitude and latitude GPS coordinates of the passenger pickup or dropoff location, and the timestamp. We make no distinction between pickups and dropoffs, since both of these events imply an available taxicab at that location. The data was generally clean, with a very small fraction of a percent of coordinates looking bad, e.g. in the middle of the Hudson River. These coordinate errors get screened out by the clustering step that follows.
We cluster the pickup and dropoff locations into areas of high density, i.e. where many pickups and dropoffs happen, to determine where on the map it is worth making and displaying estimates of taxi activity. We rolled our own algorithm, a variation on heatmap generation, after finding existing clustering algorithms such as K-means unsuitable—we are seeking centroids of areas of high density rather than cluster membership per se. See figure below which shows the cluster centers as identified by our algorithm on a square-mile patch of Manhattan. The axes represent the longitude and latitude of the area; the small blue crosses a random sample of pickups and dropoffs; and the red numbers the identified cluster centers, in descending order of activity.

Taxi activity clusters
We then model taxi activity at each cluster. We discretize time into hourly intervals—for each cluster, we sum all pickups and dropoffs that occur each hour in 2013. So our datapoints now are triples of the form [<cluster>, <hour>, <activity>], with <hour> being some hour in 2013 and <activity> being the number of pickups and dropoffs that occurred in hour <hour> in cluster <cluster>. We then regress each <activity> against neighboring clusters’ and neighboring times’ <activity> values. This regression serves to smooth estimates across time and space, smoothing out effects of special events or weather in the prior year that don’t repeat this year. It required some tricky choices on arranging and aligning the various data elements; not technically difficult or maybe even interesting, but nevertheless likely better part of an hour at a whiteboard to explain. In other words, typical data science. We then extrapolate these predictions to 2014, by mapping each hour in 2014 to the most similar hour in 2013. So we now have a prediction at each cluster location, for each hour in 2014, the number of passenger pickups and dropoffs.
We display these predictions by overlaying them on a Google maps at the corresponding cluster locations. We round <activity> to values like 20, 30 to avoid giving users number dyslexia. We color the labels based on these values, using the black body radiation color temperatures for the color scale, as that is one of two color scales where the ordering of change is perceptually intuitive.
If you live in New York, we hope you find NYCTaxi.info useful. Regardless, we look forward to receiving any comments.

Links (with annotation)
I’ve been heads down writing this week but I wanted to share a bunch of great stuff coming out.
- Here’s a great interview with machine learning expert Michael Jordan on various things including the big data bubble (hat tip Alan Fekete). I had a similar opinion over a year ago on that topic. Update: here’s Michael Jordan ranting about the title for that interview (hat tip Akshay Mishra). I never read titles.
- Have you taken a look at Janet Yellen’s speech on inequality from last week? She was at a conference in Boston about inequality when she gave it. It’s a pretty amazing speech – she acknowledges the increasing inequality, for example, and points at four systems we can focus on as reasons: childhood poverty and public education, college costs, inheritances, and business creation. One thing she didn’t mention: quantitative easing, or anything else the Fed has actual control over. Plus she hid behind the language of economics in terms of how much to care about any of this or what she or anyone else could do. On the other hand, maybe it’s the most we could expect from her. The Fed has, in my opinion, already been overreaching with QE and we can’t expect it to do the job of Congress.
- There’s a cool event at the Columbia Journalism School tomorrow night called #Ferguson: Reporting a Viral News Story (hat tip Smitha Corona) which features sociologist and writer Zeynep Tufekci among others (see for example this article she wrote), with Emily Bell moderating. I’m going to try to go.
- Just in case you didn’t see this, Why Work Is More And More Debased (hat tip Ernest Davis).
- Also: Poor kids who do everything right don’t do better than rich kids who do everything wrong (hat tip Natasha Blakely).
- Jesse Eisenger visits the defense lawyers of the big banks and writes about his experience (hat tip Aryt Alasti).
After writing this list, with all the hat tips, I am once again astounded at how many awesome people send me interesting things to read. Thank you so much!!
Guest post: The dangers of evidence-based sentencing
This is a guest post by Luis Daniel, a research fellow at The GovLab at NYU where he works on issues dealing with tech and policy. He tweets @luisdaniel12. Crossposted at the GovLab.
What is Evidence-based Sentencing?
For several decades, parole and probation departments have been using research-backed assessments to determine the best supervision and treatment strategies for offenders to try and reduce the risk of recidivism. In recent years, state and county justice systems have started to apply these risk and needs assessment tools (RNA’s) to other parts of the criminal process.
Of particular concern is the use of automated tools to determine imprisonment terms. This relatively new practice of applying RNA information into the sentencing process is known as evidence-based sentencing (EBS).
What the Models Do
The different parameters used to determine risk vary by state, and most EBS tools use information that has been central to sentencing schemes for many years such as an offender’s criminal history. However, an increasing amount of states have been utilizing static factors such as gender, age, marital status, education level, employment history, and other demographic information to determine risk and inform sentencing. Especially alarming is the fact that the majority of these risk assessment tools do not take an offender’s particular case into account.
This practice has drawn sharp criticism from Attorney General Eric Holder who says “using static factors from a criminal’s background could perpetuate racial bias in a system that already delivers 20% longer sentences for young black men than for other offenders.” In the annual letter to the US Sentencing Commission, the Attorney General’s Office states that “utilizing such tools for determining prison sentences to be served will have a disparate and adverse impact on offenders from poor communities already struggling with social ills.” Other concerns cite the probable unconstitutionality of using group-based characteristics in risk assessments.
Where the Models Are Used
It is difficult to precisely quantify how many states and counties currently implement these instruments, although at least 20 states have implemented some form of EBS. Some of the states or states with counties that have implemented some sort of EBS (any type of sentencing: parole, imprisonment, etc) are: Pennsylvania, Tennessee, Vermont, Kentucky, Virginia, Arizona, Colorado, California, Idaho, Indiana, Missouri, Nebraska, Ohio, Oregon, Texas, and Wisconsin.
The Role of Race, Education, and Friendship
Overwhelmingly states do not include race in the risk assessments since there seems to be a general consensus that doing so would be unconstitutional. However, even though these tools do not take race into consideration directly, many of the variables used such as economic status, education level, and employment correlate with race. African-Americans and Hispanics are already disproportionately incarcerated and determining sentences based on these variables might cause further racial disparities.
The very socioeconomic characteristics such as income and education level used in risk assessments are the characteristics that are already strong predictors of whether someone will go to prison. For example, high school dropouts are 47 times more likely to be incarcerated than people in their similar age group who received a four-year college degree. It is reasonable to suspect that courts that include education level as a risk predictor will further exacerbate these disparities.
Some states, such as Texas, take into account peer relations and considers associating with other offenders as a “salient problem”. Considering that Texas is in 4th place in the rate of people under some sort of correctional control (parole, probation, etc) and that the rate is 1 in 11 for black males in the United States it is likely that this metric would disproportionately affect African-Americans.
Sonja Starr’s paper
Even so, in some cases, socioeconomic and demographic variables receive significant weight. In her forthcoming paper in the Stanford Law Review, Sonja Starr provides a telling example of how these factors are used in presentence reports. From her paper:
For instance, in Missouri, pre-sentence reports include a score for each defendant on a scale from -8 to 7, where “4-7 is rated ‘good,’ 2-3 is ‘above average,’ 0-1 is ‘average’, -1 to -2 is ‘below average,’ and -3 to -8 is ‘poor.’ Unlike most instruments in use, Missouri’s does not include gender. However, an unemployed high school dropout will score three points worse than an employed high school graduate—potentially making the difference between “good” and “average,” or between “average” and “poor.” Likewise, a defendant under age 22 will score three points worse than a defendant over 45. By comparison, having previously served time in prison is worth one point; having four or more prior misdemeanor convictions that resulted in jail time adds one point (three or fewer adds none); having previously had parole or probation revoked is worth one point; and a prison escape is worth one point. Meanwhile, current crime type and severity receive no weight.
Starr argues that such simple point systems may “linearize” a variable’s effect. In the underlying regression models used to calculate risk, some of the variable’s effects do not translate linearly into changes in probability of recidivism, but they are treated as such by the model.
Another criticism Starr makes is that they often make predictions on an individual based on averages of a group. Starr says these predictions can predict with reasonable precision the average recidivism rate for all offenders who share the same characteristics as the defendant, but that does not make it necessarily useful for individual predictions.
The Future of EBS Tools
The Model Penal Code is currently in the process of being revised and is set to include these risk assessment tools in the sentencing process. According to Starr, this is a serious development because it reflects the increased support of these practices and because of the Model Penal Code’s great influence in guiding penal codes in other states. Attorney General Eric Holder has already spoken against the practice, but it will be interesting to see whether his successor will continue this campaign.
Even if EBS can accurately measure risk of recidivism (which is uncertain according to Starr), does that mean that a greater prison sentence will result in less future offenses after the offender is released? EBS does not seek to answer this question. Further, if knowing there is a harsh penalty for a particular crime is a deterrent to commit said crime, wouldn’t adding more uncertainty to sentencing (EBS tools are not always transparent and sometimes proprietary) effectively remove this deterrent?
Even though many questions remain unanswered and while several people have been critical of the practice, it seems like there is great support for the use of these instruments. They are especially easy to support when they are overwhelmingly regarded as progressive and scientific, something Starr refutes. While there is certainly a place for data analytics and actuarial methods in the criminal justice system, it is important that such research be applied with the appropriate caution. Or perhaps not at all. Even if the tools had full statistical support, the risk of further exacerbating an already disparate criminal justice system should be enough to halt this practice.
Both Starr and Holder believe there is a strong case to be made that the risk prediction instruments now in use are unconstitutional. But EBS has strong advocates, so it’s a difficult subject. Ultimately, evidence-based sentencing is used to determine a person’s sentencing not based on what the person has done, but who that person is.
Big Data’s Disparate Impact
Take a look at this paper by Solon Barocas and Andrew D. Selbst entitled Big Data’s Disparate Impact.
It deals with the question of whether current anti-discrimination law is equipped to handle the kind of unintentional discrimination and digital redlining we see emerging in some “big data” models (and that we suspect are hidden in a bunch more). See for example this post for more on this concept.
The short answer is no, our laws are not equipped.
Here’s the abstract:
This article addresses the potential for disparate impact in the data mining processes that are taking over modern-day business. Scholars and policymakers had, until recently, focused almost exclusively on data mining’s capacity to hide intentional discrimination, hoping to convince regulators to develop the tools to unmask such discrimination. Recently there has been a noted shift in the policy discussions, where some have begun to recognize that unintentional discrimination is a hidden danger that might be even more worrisome. So far, the recognition of the possibility of unintentional discrimination lacks technical and theoretical foundation, making policy recommendations difficult, where they are not simply misdirected. This article provides the necessary foundation about how data mining can give rise to discrimination and how data mining interacts with anti-discrimination law.
The article carefully steps through the technical process of data mining and points to different places within the process where a disproportionately adverse impact on protected classes may result from innocent choices on the part of the data miner. From there, the article analyzes these disproportionate impacts under Title VII. The Article concludes both that Title VII is largely ill equipped to address the discrimination that results from data mining. Worse, due to problems in the internal logic of data mining as well as political and constitutional constraints, there appears to be no easy way to reform Title VII to fix these inadequacies. The article focuses on Title VII because it is the most well developed anti-discrimination doctrine, but the conclusions apply more broadly because they are based on the general approach to anti-discrimination within American law.
I really appreciate this paper, because it’s an area I know almost nothing about: discrimination law and what are the standards for evidence of discrimination.
Sadly, what this paper explains to me is how very far we are away from anything resembling what we need to actually address the problems. For example, even in this paper, where the writers are well aware that training on historical data can unintentionally codify discriminatory treatment, they still seem to assume that the people who build and deploy models will “notice” this treatment. From my experience working in advertising, that’s not actually what happens. We don’t measure the effects of our models on our users. We only see whether we have gained an edge in terms of profit, which is very different.
Essentially, as modelers, we don’t humanize the people on the other side of the transaction, which prevents us from worrying about discrimination or even being aware of it as an issue. It’s so far from “intentional” that it’s almost a ridiculous accusation to make. Even so, it may well be a real problem and I don’t know how we as a society can deal with it unless we update our laws.
De-anonymizing what used to be anonymous: NYC taxicabs
Thanks to Artem Kaznatcheev, I learned yesterday about the recent work of Anthony Tockar in exploring the field of anonymization and deanonymization of datasets.
Specifically, he looked at the 2013 cab rides in New York City, which was provided under a FOIL request, and he stalked celebrities Bradley Cooper and Jessica Alba (and discovered that neither of them tipped the cabby). He also stalked a man who went to a slew of NYC titty bars: found out where the guy lived and even got a picture of him.
Previously, some other civic hackers had identified the cabbies themselves, because the original dataset had scrambled the medallions, but not very well.
The point he was trying to make was that we should not assume that “anonymized” datasets actually protect privacy. Instead we should learn how to use more thoughtful approaches to anonymizing stuff, and he proposes a method called “differential privacy,” which he explains here. It involves adding noise to the data, in a certain way, so that at the end any given person doesn’t risk too much of their own privacy by being included in the dataset versus being not included in the dataset.
Bottomline, it’s actually pretty involved mathematically, and although I’m a nerd and it doesn’t intimidate me, it does give me pause. Here are a few concerns:
- It means that most people, for example the person in charge of fulfilling FOIL requests, will not actually understand the algorithm.
- That means that, if there’s a requirement that such a procedure is used, that person will have to use and trust a third party to implement it. This leads to all sorts of problems in itself.
- Just to name one, depending on what kind of data it is, you have to implement differential privacy differently. There’s no doubt that a complicated mapping of datatype to methodology will be screwed up when the person doing it doesn’t understand the nuances.
- Here’s another: the third party may not be trustworthy and may have created a backdoor.
- Or they just might get it wrong, or do something lazy that doesn’t actually work, and they can get away with it because, again, the user is not an expert and cannot accurately evaluate their work.
Altogether I’m imagining that this is at best an expensive solution for very important datasets, and won’t be used for your everyday FOIL requests like taxicab rides unless the culture around privacy changes dramatically.
Even so, super interesting and important work by Anthony Tockar. Also, if you think that’s cool, take a look at my friend Luis Daniel‘s work on de-anonymizing the Stop & Frisk data.
Upcoming data journalism and data ethics conferences
Today
Today I’m super excited to go to the opening launch party of danah boyd’s Data and Society. Data and Society has a bunch of cool initiatives but I’m particularly interested in their Council for Big Data, Ethics, and Society. They were the people that helped make the Podesta Report on Big Data as good as it was. There will be a mini-conference this afternoon I’m looking forward to very much. Brilliant folks doing great work and talking to each other across disciplinary lines, can’t get enough of that stuff.
This weekend
This coming Saturday I’ll be moderating a panel called Spotlight on Data-Driven Journalism: The job of a data journalist and the impact of computational reporting in the newsroom at the New York Press Club Conference on Journalism. The panelists are going to be great:
- John Keefe @jkeefe, Sr. editor, data news & J-technology, WNYC
- Maryanne Murray @lightnosugar, Global head of graphics, Reuters
- Zach Seward @zseward, Quartz
- Chris Walker @cpwalker07, Dir., data visualization, Mic News
The full program is available here.
December 12th
In mid-December I’m on a panel myself at the Fairness, Accountability, and Transparency in Machine Learning Conference in Montreal. This conference seems to directly take up the call of the Podesta Report I mentioned above, and seeks to provide further research into the dangers of “encoding discrimination in automated decisions”. Amazing! So glad this is happening and that I get to be part of it. Here are some questions that will be taken up at this one-day conference (more information here):
- How can we achieve high classification accuracy while eliminating discriminatory biases? What are meaningful formal fairness properties?
- How can we design expressive yet easily interpretable classifiers?
- Can we ensure that a classifier remains accurate even if the statistical signal it relies on is exposed to public scrutiny?
- Are there practical methods to test existing classifiers for compliance with a policy?
Ello, Enron, and the future of data privacy
If you think Ello is the newest safest social media platform, you might want to think again.
Or at the very least, go ahead and read this piece by my data journalist buddy Meredith Broussard, entitled ‘Ello, social media newcomer! Goodbye, data security fears?. Meredith has read the fine print in Ello’s security policy, and it’s not great news.
The business of public education
I’ve been writing my book, and I’m on chapter 4 right now, which is tentatively entitled Feedback Loops In Education. I’m studying the enormous changes in primary and secondary education that have occurred since the “data-driven” educational reform movement started with No Child Left Behind in 2001.
Here’s the issue I’m having writing this chapter. Things have really changed in the last 13 years, it’s really incredible how much money and politics – and not education – are involved. In fact I’m finding it difficult to write the chapter without sounding like a wingnut conspiracy theorist. Because that’s how freaking nuts things are right now.
On the one hand you have the people who believe in the promise of educational data. They are often pro-charter schools, anti-tenure, anti-union, pro-testing, and are possibly personally benefitting from collecting data about children and then sold to commercial interests. Privacy laws are things to bypass for these people, and the way they think about it is that they are going to improve education with all this amazing data they’re collecting. Because, you know, it’s big data, so it has to be awesome. They see No Child Left Behind and Race To The Top as business opportunities.
On the other hand you have people who do not believe in the promise of educational data. They believe in public education, and are maybe even teachers themselves. They see no proven benefits of testing, or data collection and privacy issues for students, and they often worry about job security, and public shaming and finger-pointing, and the long term consequences on children and teachers of this circus of profit-seeking “educational” reformers. Not to mention that none of this recent stuff is addressing the very real problems we have.
As it currently stands, I’m pretty much part of the second group. There just aren’t enough data skeptics in the first group to warrant my respect, and there’s way too much money and secrecy around testing and “value-added models.” And the politics of the anti-tenure case are ugly and I say that even though I don’t think teacher union leaders are doing themselves many favors.
But here’s the thing, it’s not like there could never be well-considered educational experiments that use data and have strict privacy measures in place, the results of which are not saved to individual records but are lessons learned for educators, and, it goes without saying, are strictly non-commercial. There is a place for testing, but not as a punitive measure but rather as a way of finding where there are problems and devoting resources to it. The current landscape, however, is so split and so acrimonious, it’s kind of impossible to imagine something reasonable happening.
It’s too bad, this stuff is important.
When your genetic information is held against you
My friend Jan Zilinsky recently sent me this blogpost from the NeuroCritic which investigates the repercussions of having biomarkers held against individuals.
In this case, the biomarker was in the brain and indicated a propensity for taking financial risks. Or maybe it didn’t really – the case wasn’t closed – but that was the idea, and the people behind the research mentioned three times in 8 pages that policy makers might want to use already available brain scans to figure out which populations or individuals would be at risk. Here’s an excerpt from their paper:
Our finding suggests the existence of a simple biomarker for risk attitude, at least in the midlife [sic] population we examined in the northeastern United States. … If generalized to other groups, this finding will also imply that individual risk attitudes could, at least to some extent, be measured in many existing medical brain scans, potentially offering a tool for policy makers seeking to characterize the risk attitudes of populations.
The way the researchers did their tests was, as usual, to have them play artificial games of chance and see how different people strategized, and how their brains were different.
Here’s another article I found on biomarkers and risk for psychosis, here’s one on biomarkers and risk for PTSD.
Studies like this are common and I don’t see a reason they won’t become even more common. The question is how we’re going to use them. Here’s a nasty way I could imagine they get used: when you apply for a job, you fill in a questionnaire that puts you into a category, and then people can see what biomarkers are typical for that category, and what the related health risks look like, and then they can decide whether to hire you. Not getting hired doesn’t say anything about your behaviors, just what happens with “people like you”.
I’m largely sidestepping the issue of accuracy. It’s quite likely that, at an individual level, many such predictions will be inaccurate but could still be used by commercial interests – and even be profitable – even so.
In the best case scenario, we would use such knowledge strictly to help people stay healthy. In the worst case, we have a system whereby people are judged by their biomarkers and not their behavior. If there were ever a case for regulation, I think this is it.
Christian Rudder’s Dataclysm
Here’s what I’ve spent the last couple of days doing: alternatively reading Christian Rudder’s new book Dataclysm and proofreading a report by AAPOR which discusses the benefits, dangers, and ethics of using big data, which is mostly “found” data originally meant for some other purpose, as a replacement for public surveys, with their carefully constructed data collection processes and informed consent. The AAPOR folk have asked me to provide tangible examples of the dangers of using big data to infer things about public opinion, and I am tempted to simply ask them all to read Dataclysm as exhibit A.
Rudder is a co-founder of OKCupid, an online dating site. His book mainly pertains to how people search for love and sex online, and how they represent themselves in their profiles.
Here’s something that I will mention for context into his data explorations: Rudder likes to crudely provoke, as he displayed when he wrote this recent post explaining how OKCupid experiments on users. He enjoys playing the part of the somewhat creepy detective, peering into what OKCupid users thought was a somewhat private place to prepare themselves for the dating world. It’s the online equivalent of a video camera in a changing booth at a department store, which he defended not-so-subtly on a recent NPR show called On The Media, and which was written up here.
I won’t dwell on that aspect of the story because I think it’s a good and timely conversation, and I’m glad the public is finally waking up to what I’ve known for years is going on. I’m actually happy Rudder is so nonchalant about it because there’s no pretense.
Even so, I’m less happy with his actual data work. Let me tell you why I say that with a few examples.
Who are OKCupid users?
I spent a lot of time with my students this summer saying that a standalone number wouldn’t be interesting, that you have to compare that number to some baseline that people can understand. So if I told you how many black kids have been stopped and frisked this year in NYC, I’d also need to tell you how many black kids live in NYC for you to get an idea of the scope of the issue. It’s a basic fact about data analysis and reporting.
When you’re dealing with populations on dating sites and you want to conclude things about the larger culture, the relevant “baseline comparison” is how well the members of the dating site represent the population as a whole. Rudder doesn’t do this. Instead he just says there are lots of OKCupid users for the first few chapters, and then later on after he’s made a few spectacularly broad statements, on page 104 he compares the users of OKCupid to the wider internet users, but not to the general population.
It’s an inappropriate baseline, made too late. Because I’m not sure about you but I don’t have a keen sense of the population of internet users. I’m pretty sure very young kids and old people are not well represented, but that’s about it. My students would have known to compare a population to the census. It needs to happen.
How do you collect your data?
Let me back up to the very beginning of the book, where Rudder startles us by showing us that the men that women rate “most attractive” are about their age whereas the women that men rate “most attractive” are consistently 20 years old, no matter how old the men are.
Actually, I am projecting. Rudder never actually specifically tells us what the rating is, how it’s exactly worded, and how the profiles are presented to the different groups. And that’s a problem, which he ignores completely until much later in the book when he mentions that how survey questions are worded can have a profound effect on how people respond, but his target is someone else’s survey, not his OKCupid environment.
Words matter, and they matter differently for men and women. So for example, if there were a button for “eye candy,” we might expect women to choose more young men. If my guess is correct, and the term in use is “most attractive”, then for men it might well trigger a sexual concept whereas for women it might trigger a different social construct; indeed I would assume it does.
Since this isn’t a porn site, it’s a dating site, we are not filtering for purely visual appeal; we are looking for relationships. We are thinking beyond what turns us on physically and asking ourselves, who would we want to spend time with? Who would our family like us to be with? Who would make us be attractive to ourselves? Those are different questions and provoke different answers. And they are culturally interesting questions, which Rudder never explores. A lost opportunity.
Next, how does the recommendation engine work? I can well imagine that, once you’ve rated Profile A high, there is an algorithm that finds Profile B such that “people who liked Profile A also liked Profile B”. If so, then there’s yet another reason to worry that such results as Rudder described are produced in part as a result of the feedback loop engendered by the recommendation engine. But he doesn’t explain how his data is collected, how it is prompted, or the exact words that are used.
Here’s a clue that Rudder is confused by his own facile interpretations: men and women both state that they are looking for relationships with people around their own age or slightly younger, and that they end up messaging people slightly younger than they are but not many many years younger. So forty year old men do not message twenty year old women.
Is this sad sexual frustration? Is this, in Rudder’s words, the difference between what they claim they want and what they really want behind closed doors? Not at all. This is more likely the difference between how we live our fantasies and how we actually realistically see our future.
Need to control for population
Here’s another frustrating bit from the book: Rudder talks about how hard it is for older people to get a date but he doesn’t correct for population. And since he never tells us how many OKCupid users are older, nor does he compare his users to the census, I cannot infer this.
Here’s a graph from Rudder’s book showing the age of men who respond to women’s profiles of various ages:

We’re meant to be impressed with Rudder’s line, “for every 100 men interested in that twenty year old, there are only 9 looking for someone thirty years older.” But here’s the thing, maybe there are 20 times as many 20-year-olds as there are 50-year-olds on the site? In which case, yay for the 50-year-old chicks? After all, those histograms look pretty healthy in shape, and they might be differently sized because the population size itself is drastically different for different ages.
Confounding
One of the worst examples of statistical mistakes is his experiment in turning off pictures. Rudder ignores the concept of confounders altogether, which he again miraculously is aware of in the next chapter on race.
To be more precise, Rudder talks about the experiment when OKCupid turned off pictures. Most people went away when this happened but certain people did not:

Some of the people who stayed on went on a “blind date.” Those people, which Rudder called the “intrepid few,” had a good time with people no matter how unattractive they were deemed to be based on OKCupid’s system of attractiveness. His conclusion: people are preselecting for attractiveness, which is actually unimportant to them.
But here’s the thing, that’s only true for people who were willing to go on blind dates. What he’s done is select for people who are not superficial about looks, and then collect data that suggests they are not superficial about looks. That doesn’t mean that OKCupid users as a whole are not superficial about looks. The ones that are just got the hell out when the pictures went dark.
Race
This brings me to the most interesting part of the book, where Rudder explores race. Again, it ends up being too blunt by far.
Here’s the thing. Race is a big deal in this country, and racism is a heavy criticism to be firing at people, so you need to be careful, and that’s a good thing, because it’s important. The way Rudder throws it around is careless, and he risks rendering the term meaningless by not having a careful discussion. The frustrating part is that I think he actually has the data to have a very good discussion, but he just doesn’t make the case the way it’s written.
Rudder pulls together stats on how men of all races rate women of all races on an attractiveness scale of 1-5. It shows that non-black men find their own race attractive and non-black men find black women, in general, less attractive. Interesting, especially when you immediately follow that up with similar stats from other U.S. dating sites and – most importantly – with the fact that outside the U.S., we do not see this pattern. Unfortunately that crucial fact is buried at the end of the chapter, and instead we get this embarrassing quote right after the opening stats:
And an unintentionally hilarious 84 percent of users answered this match question:
Would you consider dating someone who has vocalized a strong negative bias toward a certain race of people?
in the absolute negative (choosing “No” over “Yes” and “It depends”). In light of the previous data, that means 84 percent of people on OKCupid would not consider dating someone on OKCupid.
Here Rudder just completely loses me. Am I “vocalizing” a strong negative bias towards black women if I am a white man who finds white women and asian women hot?
Especially if you consider that, as consumers of social platforms and sites like OKCupid, we are trained to rank all the products we come across to ultimately get better offerings, it is a step too far for the detective on the other side of the camera to turn around and point fingers at us for doing what we’re told. Indeed, this sentence plunges Rudder’s narrative deeply into the creepy and provocative territory, and he never fully returns, nor does he seem to want to. Rudder seems to confuse provocation for thoughtfulness.
This is, again, a shame. A careful conversation about the issues of what we are attracted to, what we can imagine doing, and how we might imagine that will look to our wider audience, and how our culture informs those imaginings, are all in play here, and could have been drawn out in a non-accusatory and much more useful way.
What’s next for mathbabe?
The Columbia J-School program that I have been directing, The Lede Program in Data Journalism, has wound down this past week and in four days my 6-month contract with Columbia will end. I’ve had a fantastic time and I am super proud of what we accomplished this past summer. The students from the program are awesome and many of them are now my friends. About half of them are still engaged in classes and will continue to work this semester with Jonathan Soma, who absolutely rocks, and of course my fabulous colleague Theresa Bradley, who will step in as Director now that I’m leaving.
So, what’s next? I am happy to say that as of today (or at least as of next Monday when my kids are really in school full-time) I’m writing my book Weapons of Math Destruction on a full-time basis. This comes as a huge relief, since the internal pressure I have to finish this book is reminiscent of how I felt when I needed to write my thesis: enormous, but maybe even worse than then since the timeliness of the book could not be overstated, and I want to get this book out before the moment passes.
In the meantime I have some cool talks I’m planning to go to (like this one I went to already!) and some I’m planning to give. So for example, I’m giving a keynote at The Yale Day of Data later this month, which is going to be fun and interesting.
My Yale talk is basically a meditation on what can be achieved by academic data science institutions, what presents cultural and technical obstacles to collaboration, and why we need to do it anyway. It’s no less than a plea for Yale to create a data science institute with a broad definition of data science – so including scholars from law and from journalism as well as the fields you think of already when you think of data science – and a broad mandate to have urgent conversations across disciplines about the “big data revolution.” That conversation has already begun at the Information Society Project at Yale Law School, which makes me optimistic.
I also plan to continue my weekly Slate Money podcasts with Felix Salmon and Jordan Weissmann. Today we’re discussing the economic implications of Scottish independence, Felix’s lifetime earnings calculator, and the Fed’s new liquidity rules and how they affect municipalities, which my friend Marc Joffe guest blogged about yesterday.
A decision tree for decision trees
For a while now I’ve been thinking I should build a decision tree for deciding which algorithm to use on a given data project. And yes, I think it’s kind of cool that “decision tree” would be an outcome on my decision tree. Kind of like a nerd pun.
I’m happy to say that I finally started work on my algorithm decision tree, thanks to this website called gliffy.com which allows me to build flowcharts with an easy online tool. It was one of those moments when I said to myself, this morning at 6am, “there should be a start-up that allows me to build a flowchart online! Let me google for that” and it totally worked. I almost feel like I willed gliffy.com into existence.
So here’s how far I’ve gotten this morning:

Not far! But I also learned how to use the tool.
I looked around the web to see if I’m doing something that’s already been done and I came up with this:
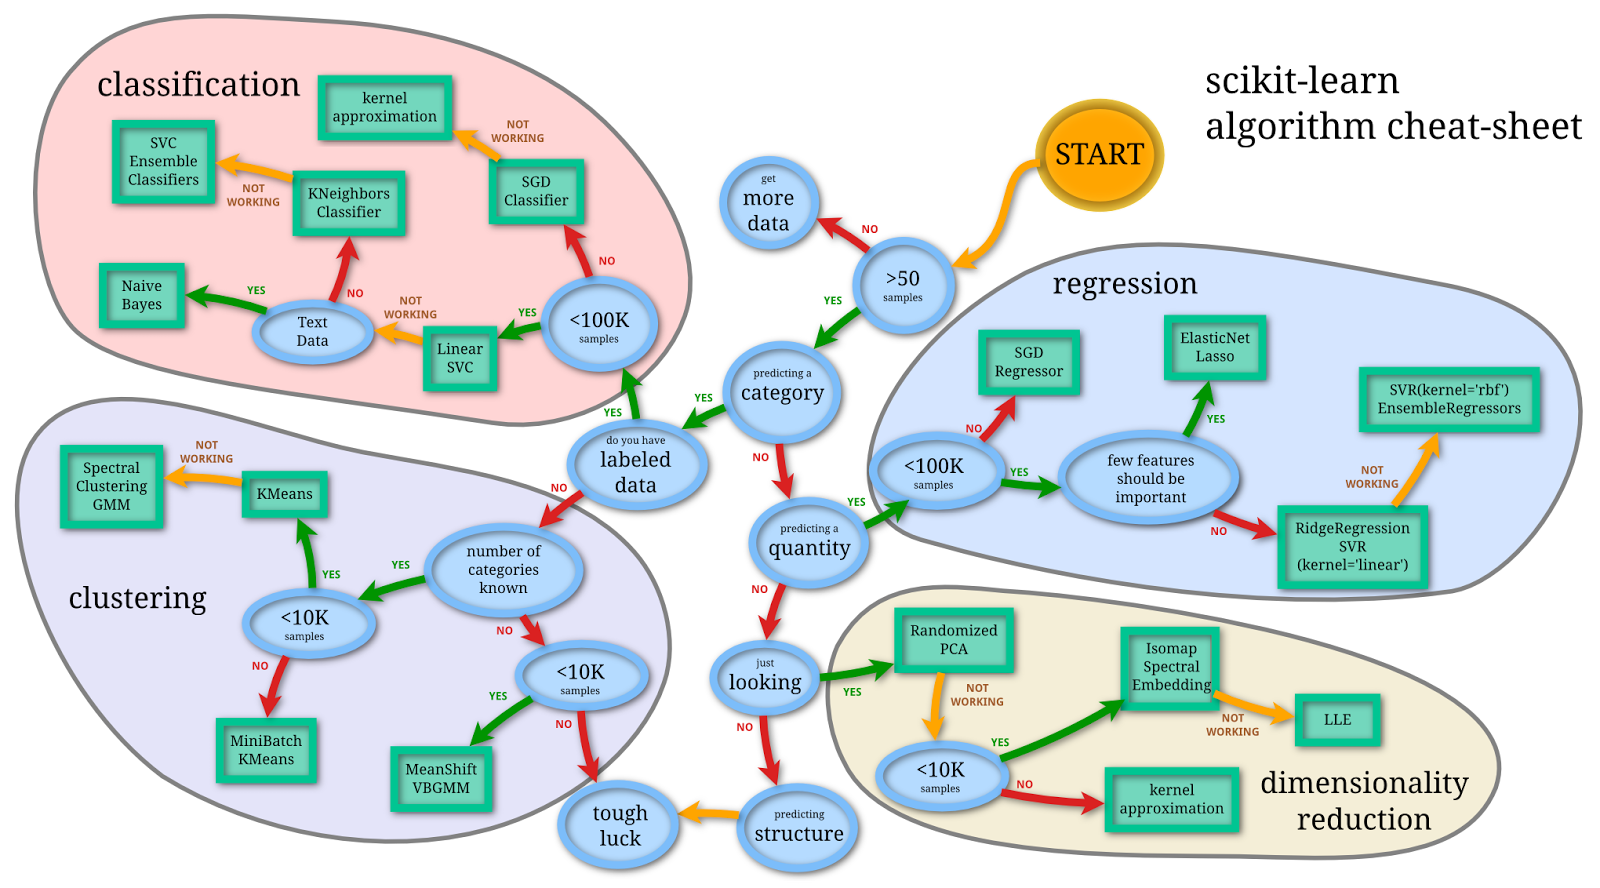
I appreciate the effort but this is way more focused on the size of the data than I intend to be, at least for now. And here’s another one that’s even less like the one I want to build but is still impressive.
Because here’s what I want to focus on: what kind of question are you answering with which algorithm? For example, with clustering algorithms you are, you know, grouping similar things together. That one’s easy, kind of, although plenty of projects have ended up being clustering or classifying algorithms whose motivating questions did not originally take on the form “how would we group these things together?”.
In other words, the process of getting at algorithms from questions is somewhat orthogonal to the normal way algorithms are introduced, and for that reason taking me some time to decide what the questions are that I need to ask in my decision tree. Right about now I’m wishing I had taken notes when my Lede Program students asked me to help them with their projects, because embedded in those questions were some great examples of data questions in search of an algorithm.
Please give me advice!
Advertising vs. Privacy
I’ve was away over the weekend (apologies to Aunt Pythia fans!) and super busy yesterday but this morning I finally had a chance to read Ethan Zuckerman’s Atlantic piece entitled The Internet’s Original Sin, which was sent to me by my friend Ernest Davis.
Here’s the thing, Zuckerman gets lots of things right in the article. Most importantly, the inherent conflict between privacy and the advertisement-based economy of the internet:
Demonstrating that you’re going to target more and better than Facebook requires moving deeper into the world of surveillance—tracking users’ mobile devices as they move through the physical world, assembling more complex user profiles by trading information between data brokers.
Once we’ve assumed that advertising is the default model to support the Internet, the next step is obvious: We need more data so we can make our targeted ads appear to be more effective.
This is well said, and important to understand.
Here’s where Zuckerman goes a little too far in my opinion:
Outrage over experimental manipulation of these profiles by social networks and dating companies has led to heated debates amongst the technologically savvy, but hasn’t shrunk the user bases of these services, as users now accept that this sort of manipulation is an integral part of the online experience.
It is a mistake to assume that “users accept this sort of manipulation” because not everyone has stopped using Facebook. Facebook is, after all, an hours-long daily habit for an enormous number of people, and it’s therefore sticky. People don’t give up addictive habits overnight. But it doesn’t mean they are feeling the same way about Facebook that they did 4 years ago. People are adjusting their opinion of the user experience as that user experience is increasingly manipulated and creepy.
An analogy should be drawn to something like smoking, where the rates have gone way down since we all found out it is bad for you. People stopped smoking even though it is really hard for most people (and impossible for some).
We should instead be thinking longer term about what people will be willing to leave Facebook for. What is the social networking model of the future? What kind of minimum privacy protections will convince people they are safe (enough)?
And, most importantly, will we even have reasonable minimum protections, or will privacy be entirely commoditized, whereby only premium pay members will be protected, while the rest of us will be thrown to the dogs?
What can be achieved by Data Science?
This is a guest post by Sophie Chou, who recently graduated from Columbia in Computer Science and is on her way to the MIT Media Lab. Crossposted on Sophie’s blog.
“Data Science” is one of my least favorite tech buzzwords, second to probably “Big Data”, which in my opinion should be always printed followed by a winky face (after all, my data is bigger than yours). It’s mostly a marketing ploy used by companies to attract talented scientists, statisticians, and mathematicians, who, at the end of the day, will probably be working on some sort of advertising problem or the other.
Still, you have to admit, it does have a nice ring to it. Thus the title Democratizing Data Science, a vision paper which I co-authored with two cool Ph.D students at MIT CSAIL, William Li and Ramesh Sridharan.
The paper focuses on the latter part of the situation mentioned above. Namely, how can we direct these data scientists, aka scientists who interact with the data pipeline throughout the problem-solving process (whether they be computer scientists or programmers or statisticians or mathematicians in practice) towards problems focused on societal issues?
In the paper, we briefly define Data Science (asking ourselves what the heck it even means), then question what it means to democratize the field, and to what end that may be achieved. In other words, the current applications of Data Science, a new but growing field, in both research and industry, has the potential for great social impact, but in reality, resources are rarely distributed in a way to optimize the social good.
We’ll be presenting the paper at the KDD Conference next Sunday, August 24th at 11am as a highlight talk in the Bloomberg Building, 731 Lexington Avenue, NY, NY. It will be more like an open conversation than a lecture and audience participation and opinion is very welcome.
The conference on Sunday at Bloomberg is free, although you do need to register. There are three “tracks” going on that morning, “Data Science & Policy”, “Urban Computing”, and “Data Frameworks”. Ours is in the 3rd track. Sign up here!
If you don’t have time to make it, give the paper a skim anyway, because if you’re on Mathbabe’s blog you probably care about some of these things we talk about.
Love StackOverflow and MathOverflow? Now there’s StemForums!
Everyone I know who codes uses stackoverflow.com for absolutely everything.
Just yesterday I met a cool coding chick who was learning python and pandas (of course!) with the assistance of stackoverflow. It is exactly what you need to get stuff working, and it’s better than having a friend to ask, even a highly knowledgable friend, because your friend might be busy or might not know the answer, or even if your friend knew the answer her answer isn’t cut-and-paste-able.
If you are someone who has never used stackoverflow for help, then let me explain how it works. Say you want to know how to load a JSON file into python but you don’t want to write a script for that because you’re pretty sure someone already has. You just search for “import json into python” and you get results with vote counts:

Also, every math nerd I know uses and contributes to mathoverflow.net. It’s not just for math facts and questions, either, there are interesting discussions going on there all the time. Here’s an example of a comment in response to understanding the philosophy behind the claimed proof of the ABC Conjecture:

OK well hold on tight because now there’s a new online forum, but not about coding and not about math. It’s about all the other STEM subjects, which since we’ve removed math might need to be called STE subjects, which is not catchy.
It’s called stemforums.com, and it is being created by a team led by Gary Cornell, mathematician, publisher at Apress, and beloved Black Oak bookstore owner.
So far only statistics is open, but other stuff is coming very soon. Specifically it covers, or soon will cover, the following fields:
- Statistics
- Biology
- Chemistry
- Cognitive Sciences
- Computer Sciences
- Earth and Planetary Sciences
- Economics
- Science & Math Education
- Engineering
- History of Science and Mathematics
- Applied Mathematics, and
- Physics
I’m super excited for this site, it has serious potential to make peoples’ lives better. I wish it had a category for Data Sciences, and for Data Journalism, because I’d probably be more involved in those categories than most of the above, but then again most data science-y questions could be inserted into one of the above. I’ll try to be patient on this one.
Here’s a screen shot of an existing Stats question on the site:
 The site doesn’t have many questions, and even fewer answers, but as I understand it the first few people to get involved are eligible for Springer books, so go check it out.
Illegal PayDay syndicate in New York busted
There’s an interesting and horrible New York Time story by Jessica Silver-Greenberg about a PayDay loan syndicate being run out of New York State. The syndicate consists of twelve companies owned by a single dude, Carey Vaughn Brown, with help from a corrupt lawyer and another corrupt COO. Manhattan District Attorneys are charging him and his helpers with usury under New York law.
The complexity of the operation was deliberate and intended to obscure the chain of events that would start with a New Yorker online looking for quick cash online and end with a predatory loan. They’d interface with a company called MyCashNow.com, which would immediately pass their application on to a bunch of other companies in different states or overseas.
Important context: in New York, the usury law caps interest rates at 25 percent annually, and these PayDay operations were charging between 350 and 650 percent annually. Also key, the usury laws apply to where the borrower is, not where the lender is, so even though some of the companies were located (at least on paper) in the West Indies, they were still breaking the law.
They don’t know exactly how big the operation was in New York, but one clue is that in 2012, one of the twelve companies had $50 million in proceeds from New York.
Here’s my question: how did MyCashNow.com advertise? Did it use Google ads, or Facebook ads, or something else, and if so, what were the attributes of the desperate New Yorkers that it looked for to do its predatory work?
One side of this is that vulnerable people were somehow targeted. The other side is that well-off people were not, which meant they didn’t see ads like this, which makes it harder for people like the Manhattan District Attorney to even know about shady operations like this.
Weapon of Math Destruction: “risk-based” sentencing models
There was a recent New York Times op-ed by Sonja Starr entitled Sentencing, by the Numbers (hat tip Jordan Ellenberg and Linda Brown) which described the widespread use – in 20 states so far and growing – of predictive models in sentencing.
The idea is to use a risk score to help inform sentencing of offenders. The risk is, I guess, supposed to tell us how likely the person is to commit another act in the future, although that’s not specified. From the article:
The basic problem is that the risk scores are not based on the defendant’s crime. They are primarily or wholly based on prior characteristics: criminal history (a legitimate criterion), but also factors unrelated to conduct. Specifics vary across states, but common factors include unemployment, marital status, age, education, finances, neighborhood, and family background, including family members’ criminal history.
I knew about the existence of such models, at least in the context of prisoners with mental disorders in England, but I didn’t know how widespread it had become here. This is a great example of a weapon of math destruction and I will be using this in my book.
A few comments:
- I’ll start with the good news. It is unconstitutional to use information such as family member’s criminal history against someone. Eric Holder is fighting against the use of such models.
- It is also presumably unconstitutional to jail someone longer for being poor, which is what this effectively does. The article has good examples of this.
- The modelers defend this crap as “scientific,” which is the worst abuse of science and mathematics imaginable.
- The people using this claim they only use it for as a way to mitigate sentencing, but letting a bunch of rich white people off easier because they are not considered “high risk” is tantamount to sentencing poor minorities more.
- It is a great example of confused causality. We could easily imagine a certain group that gets arrested more often for a given crime (poor black men, marijuana possession) just because the police have that practice for whatever reason (Stop & Frisk). Then model would then consider any such man at a higher risk of repeat offending, but that’s not because any particular person is actually more likely to do it, but because the police are more likely to arrest that person for it.
- It also creates a negative feedback loop on the most vulnerable population: the model will impose longer sentencing on the population it considers most risky, which will in turn make them even riskier in the future, if “length of time in prison previously” is used as an attribute in the model, which is surely is.
- Not to be cynical, but considering my post yesterday, I’m not sure how much momentum will be created to stop the use of such models, considering how discriminatory it is.
- Here’s an extreme example of preferential sentencing which already happens: rich dude Robert H Richards IV raped his 3-year-old daughter and didn’t go to jail because the judge ruled he “wouldn’t fare well in prison.”
- How great would it be if we used data and models to make sure rich people went to jail just as often and for just as long as poor people for the same crime, instead of the other way around?
Surveillance in NYC
There’s a CNN video news story explaining how the NYC Mayor’s Office of Data Analytics is working with private start-up Placemeter to count and categorize New Yorkers, often with the help of private citizens who install cameras in their windows. Here’s a screenshot from the Placemeter website:
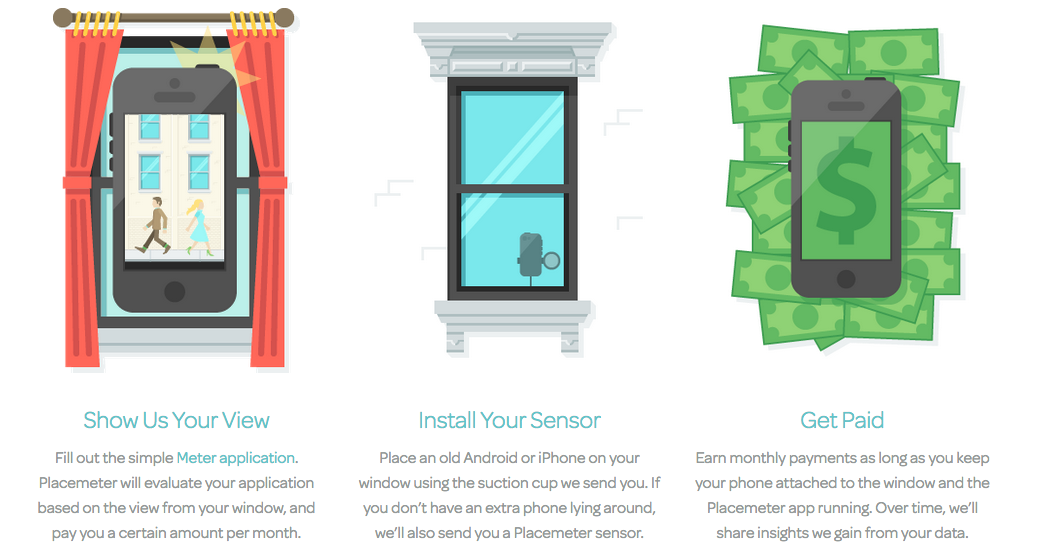
From placemeter.com
You should watch the video and decide for yourself whether this is a good idea.
Personally, it disturbs me, but perhaps because of my priors on how much we can trust other people with our data, especially when it’s in private hands.
To be more precise, there is, in my opinion, a contradiction coming from the Placemeter representatives. On the one hand they try to make us feel safe by saying that, after gleaning a body count with their video tapes, they dump the data. But then they turn around and say that, in addition to counting people, they will also categorize people: gender, age, whether they are carrying a shopping bag or pushing strollers.
That’s what they are talking about anyway, but who knows what else? Race? Weight? Will they use face recognition software? Who will they sell such information to? At some point, after mining videos enough, it might not matter if they delete the footage afterwards.
Since they are a private company I don’t think such information on their data methodologies will be accessible to us via Freedom of Information Laws either. Or, let me put that another way. I hope that MODA sets up their contract so that such information is accessible via FOIL requests.
Critical Questions for Big Data by danah boyd & Kate Crawford
I’m teaching a class this summer in the Lede Program, starting in mid-July, which is called The Platform. Here’s the course description:
This course begins with the idea that computing tools are the products of human ingenuity and effort. They are never neutral and carry with them the biases of their designers and their design process. “Platform studies” is a new term used to describe investigations into these relationships between computing technologies and the creative or research products that they help to generate. How you understand how data, code, and algorithms affect creative practices can be an effective first step toward critical thinking about technology. This will not be purely theoretical, however, and specific case studies, technologies, and project work will make the ideas concrete.
Since my first class is coming soon, I’m actively thinking about what to talk about and which readings to assign. I’ve got wonderful guest lecturers coming, and for the most part the class will focus on those guest lecturers and their topics, but for the first class I want to give them an overview of a very large subject.
I’ve decided that danah boyd and Kate Crawford’s recent article, Critical Questions for Big Data, is pretty much perfect for this goal. I’ve read and written a lot about big data but even so I’m impressed by how clearly and comprehensively they have laid out their provocations. And although I’ve heard many of the ideas and examples before, some of them are new to me, and are directly related to the theme of the class, for example:
Twitter and Facebook are examples of Big Data sources that offer very poor archiving and search functions. Consequently, researchers are much more likely to focus on something in the present or immediate past – tracking reactions to an election, TV finale, or natural disaster – because of the sheer difficulty or impossibility of accessing older data.
Of course the students in the Lede are journalists, not academic researchers, which the article mostly addresses, and moreover they are not necessarily working with big data per se, but even so they are increasingly working with social media data, and moreover they are probably covering big data even if they don’t directly analyze it. So I think it’s still relevant to them. Or another way to express this is that one thing we will attempt to do in class is examine the extent to which their provocations are relevant.
Here’s another gem, directly related to the Facebook experiment I discussed yesterday:
As computational scientists have started engaging in acts of social science, there is a tendency to claim their work as the business of facts and not interpretation. A model may be mathematically sound, an experiment may seem valid, but as soon as a researcher seeks to understand what it means, the process of interpretation has begun. This is not to say that all interpretations are created equal, but rather that not all numbers are neutral.
In fact, what with this article and that case study, I’m pretty much set for my first day, after combining them with a discussion of the students’ projects and some related statistical experiments.
I also hope to invite at least one of the authors to come talk to the class, although I know they are both incredibly busy. Danah boyd, who recently came out with a book called It’s Complicated: the social lives of networked teens, also runs the Data & Society Research Institute, a NYC-based think/do tank focused on social, cultural, and ethical issues arising from data-centric technological development. I’m hoping she comes and talks about the work she’s starting up there.


