Archive
The Stacks Project gets ever awesomer with new viz
Crossposted on Not Even Wrong.
Here’s a completely biased interview I did with my husband A. Johan de Jong, who has been working with Pieter Belmans on a very cool online math project using d3js. I even made up some of his answers (with his approval).
Q: What is the Stacks Project?
A: It’s an open source textbook and reference for my field, which is algebraic geometry. It builds foundations starting from elementary college algebra and going up to algebraic stacks. It’s a self-contained exposition of all the material there, which makes it different from a research textbook or the experience you’d have reading a bunch of papers.
We were quite neurotic setting it up – everything has a proof, other results are referenced explicitly, and it’s strictly linear, which is to say there’s a strict ordering of the text so that all references are always to earlier results.
Of course the field itself has different directions, some of which are represented in the stacks project, but we had to choose a way of presenting it which allowed for this idea of linearity (of course, any mathematician thinks we can do that for all of mathematics).
Q: How has the Stacks Project website changed?
A: It started out as just a place you could download the pdf and tex files, but then Pieter Belmans came on board and he added features such as full text search, tag look-up, and a commenting system. In this latest version, we’ve added a whole bunch of features, but the most interesting one is the dynamic generation of dependency graphs.
We’ve had some crude visualizations for a while, and we made t-shirts from those pictures. I even had this deal where, if people found mathematical mistakes in the Stacks Project, they’d get a free t-shirt, and I’m happy to report that I just last week gave away my last t-shirt. Here’s an old picture of me with my adorable son (who’s now huge).

Q: Talk a little bit about the new viz.
A: First a word about the tags, which we need to understand the viz.
Every mathematical result in the Stacks Project has a “tag”, which is a four letter code, and which is a permanent reference for that result, even as other results are added before or after that one (by the way, Cathy O’Neil figured this system out).
The graphs show the logical dependencies between these tags, represented by arrows between nodes. You can see this structure in the above picture already.
So for example, if tag ABCD refers to Zariski’s Main Theorem, and tag ADFG refers to Nakayama’s Lemma, then since Zariski depends on Nakayama, there’s a logical dependency, which means the node labeled ABCD points to the node labeled ADFG in the entire graph.
Of course, we don’t really look at the entire graph, we look at the subgraph of results which a given result depends on. And we don’t draw all the arrows either, we only draw the arrows corresponding to direct references in the proofs. Which is to say, in the subgraph for Zariski, there will be a path from node ABCD to node ADFG, but not necessarily a direct link.
Q: Can we see an example?
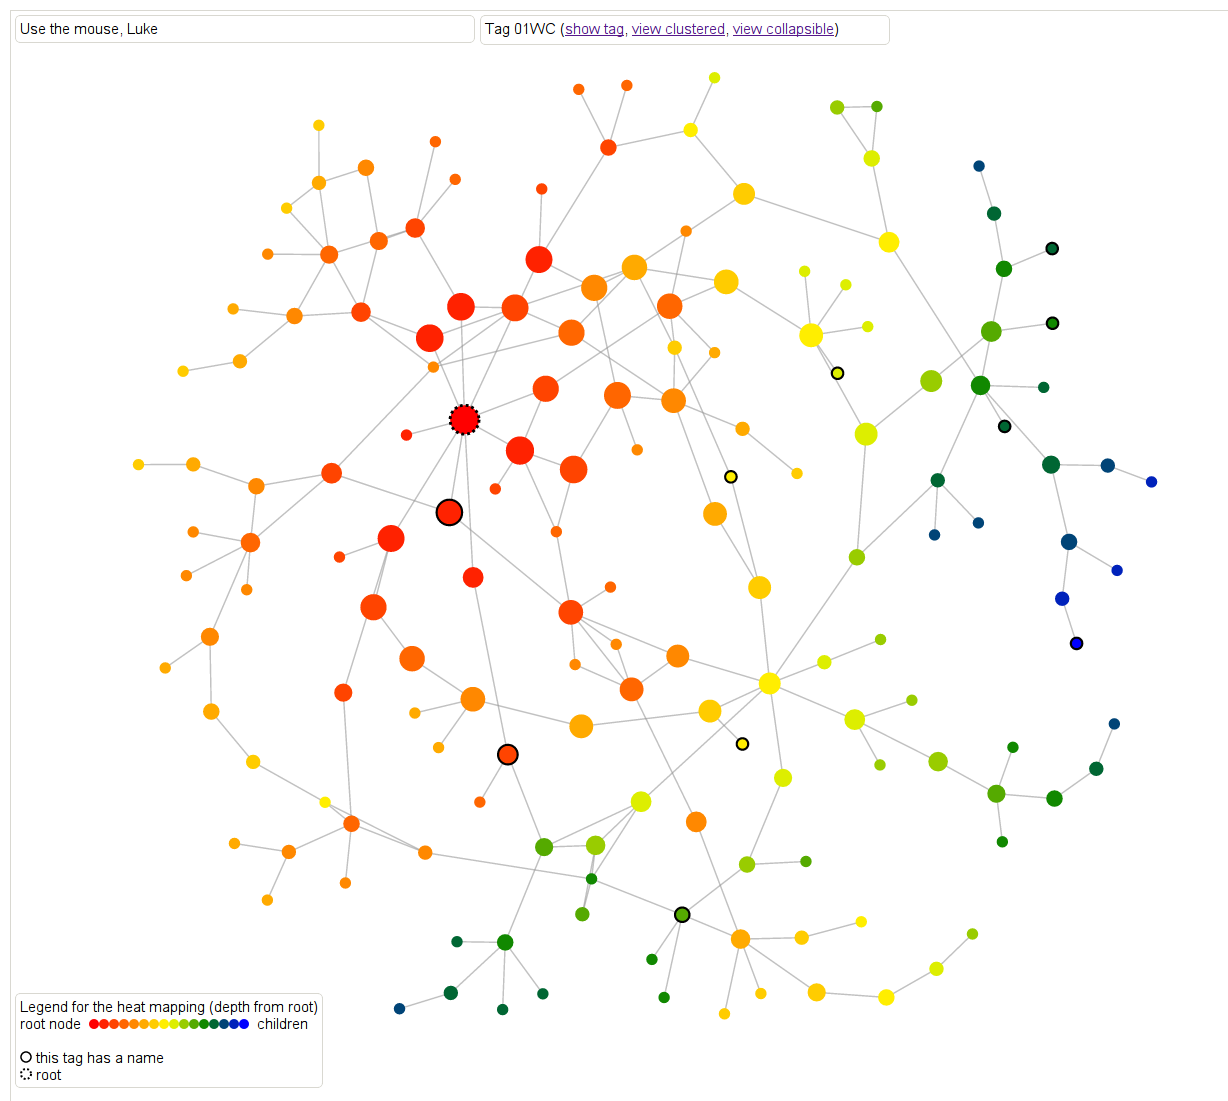
Let’s move to an example for result 01WC, which refers to the proof that “a locally projective morphism is proper”.
First, there are two kinds of heat maps. Here’s one that defines distance as the maximum (directed) distance from the root node. In other words, how far down in the proof is this result needed? In this case the main result 01WC is bright red with a black dotted border, and any result that 01WC depends on is represented as a node. The edges are directed, although the arrows aren’t drawn, but you can figure out the direction by how the color changes. The dark blue colors are the leaf nodes that are farthest away from the root.
Another way of saying this is that the redder results are the results that are closer to it in meaning and sophistication level.
Note if we had defined the distance as the minimum distance from the root node (to come soon hopefully), then we’d have a slightly different and also meaningful way of thinking about “redness” as “relevance” to the root node.
This is a screenshot but feel free to play with it directly here. For all of the graphs, hovering over a result will cause the statement of the result to appear, which is awesome.
Next, let’s look at another kind of heat map where the color is defined as maximum distance from some leaf note in the overall graph. So dark blue nodes are basic results in algebra, sheaves, sites, cohomology, simplicial methods, and other chapters. The link is the same, you can just toggle between the different metric.

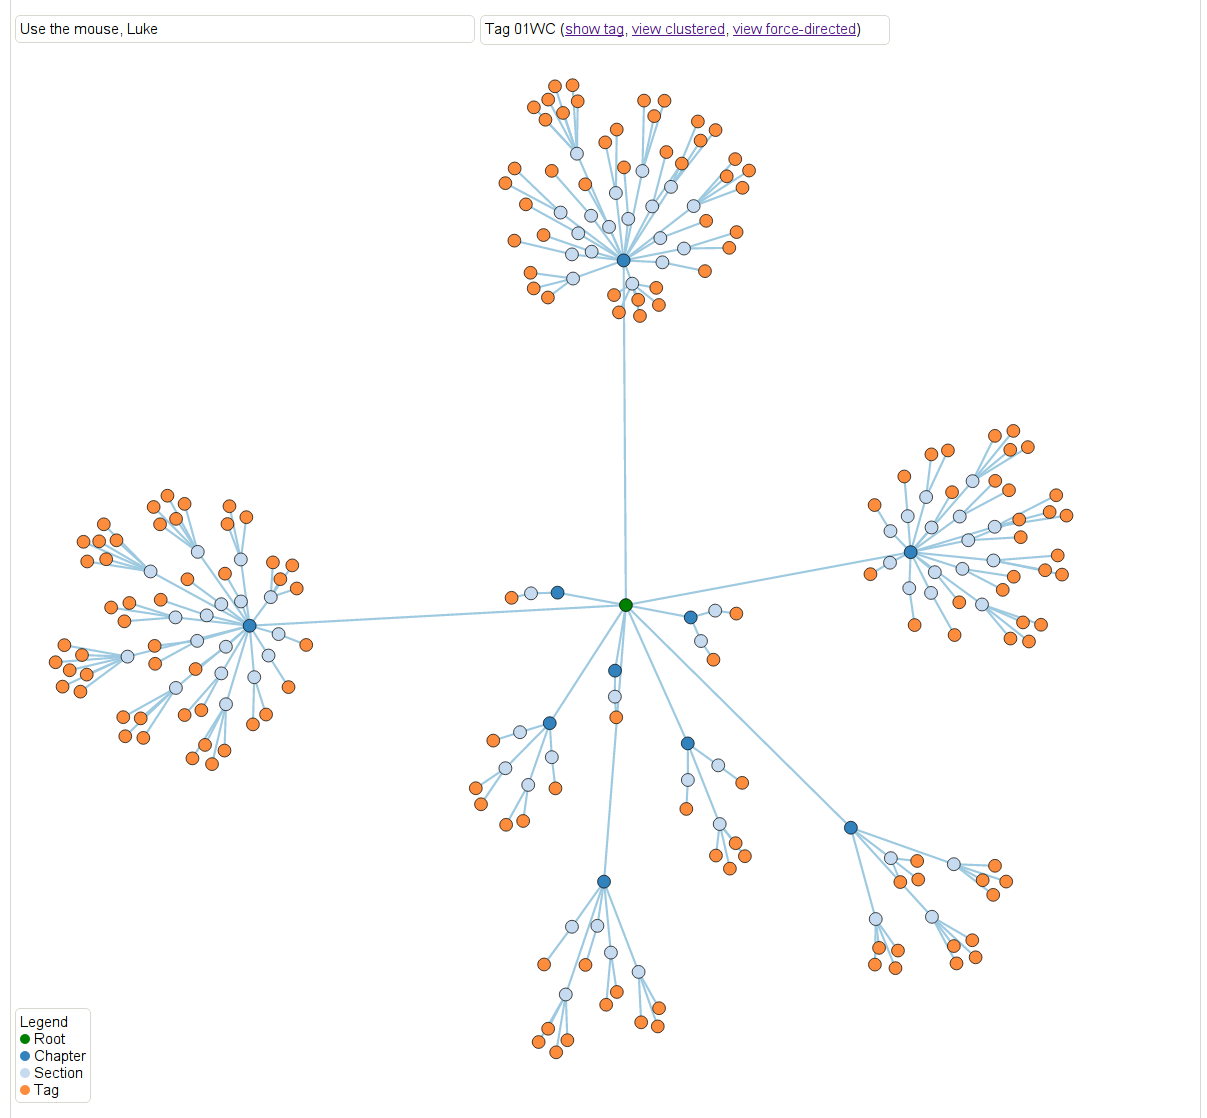
Next we delved further into how results depend on those different topics. Here, again for the same result, we can see the extent to which that result depends on the different on results from the various chapters. If you scroll over the nodes you can see more details. This is just a screenshot but you can play with it yourself here and you can collapse it in various ways corresponding to the internal hierarchy of the project.
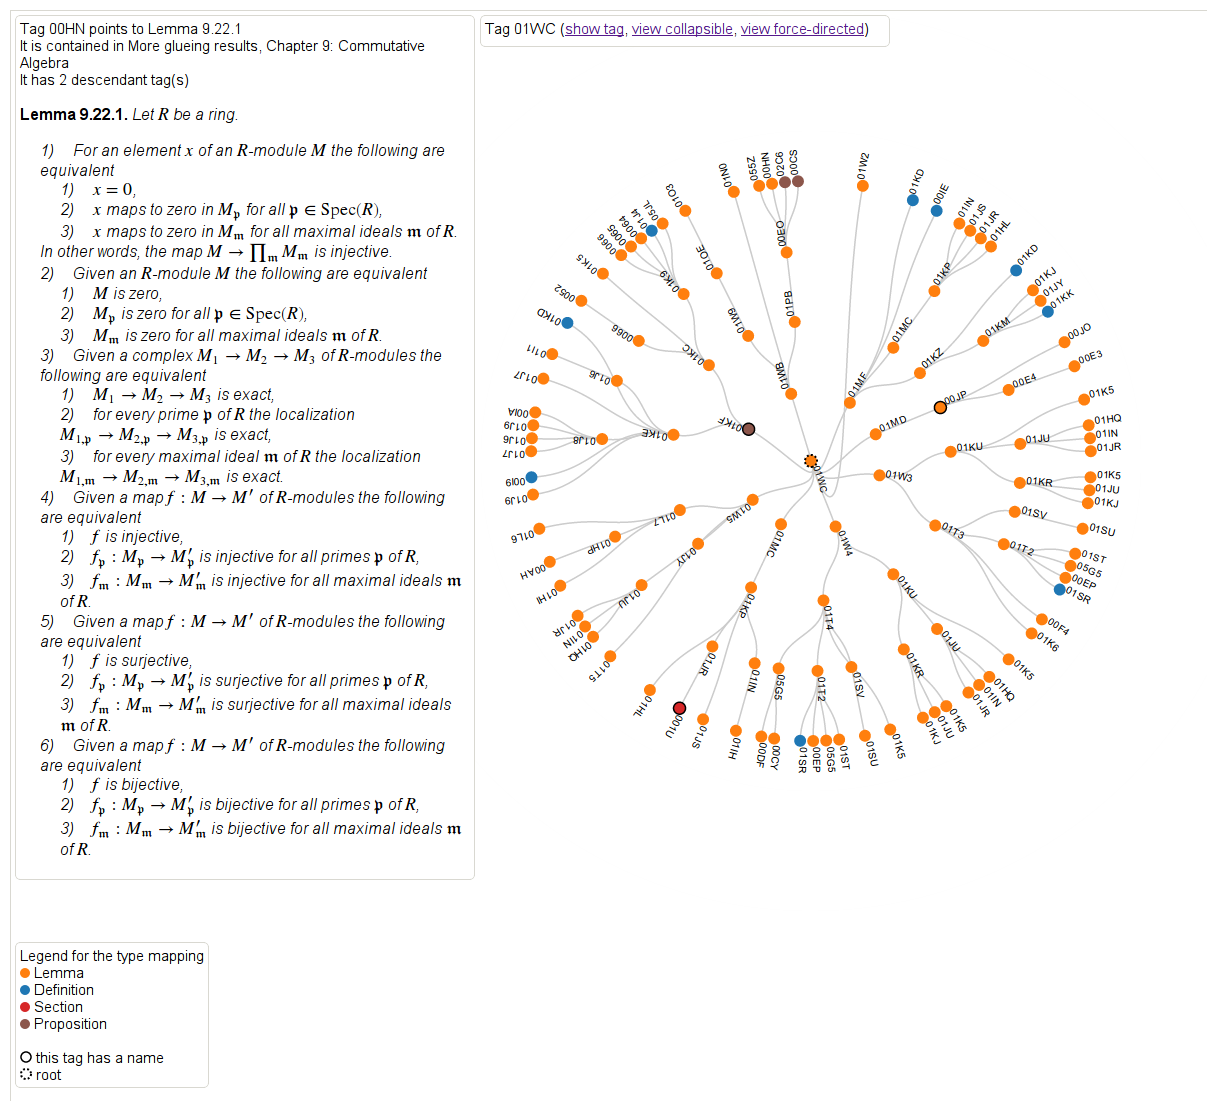
Finally, we have a way of looking at the logical dependency graph directly, where result node is labeled with a tag and colored by “type”: whether it’s a lemma, proposition, theorem, or something else, and it also annotates the results which have separate names. Again a screenshot but play with it here, it rotates!
Check out the whole project here, and feel free to leave comments using the comment feature!
Radhika Nagpal is a role model for fun people everywhere
Can I hear an amen for Radhika Nagpal, the brave woman who explained to the world recently how she lived through being a tenure-track professor at Harvard without losing her soul?
You should really read Nagpal’s guest blogpost from Scientific American (hat tip Ken Ribet) yourself, but here’s just a sneak preview, namely her check list of survival tactics that she describes in more detail later in the piece:
- I decided that this is a 7-year postdoc.
- I stopped taking advice.
- I created a “feelgood” email folder.
- I work fixed hours and in fixed amounts.
- I try to be the best “whole” person I can.
- I found real friends.
- I have fun “now”.
I really love this list, especially the “stop taking advice” part. I can’t tell you how much crap advice you get when you’re a tenure-track woman in a technical field. Nagpal was totally right to decide to ignore it, and I wish I’d taken her advice to ignore people’s advice, even though that sounds like a logical contradiction.
What I like the most about her list was her insistence on being a whole person and having fun – I have definitely had those rules since forever, and I didn’t have to make them explicit, I just thought of them as obvious, although maybe it was for me because my alternative was truly dark.
It’s just amazing how often people are willing to make themselves miserable and delay their lives when they’re going for something ambitious. For some reason, they argue, they’ll get there faster if they’re utterly submissive to the perceived expectations.
What bullshit! Why would anyone be more efficient at learning, at producing, or at creating when they’re sleep-deprived and oppressed? I don’t get it. I know this sounds like a matter of opinion but I’m super sure there’ll be some study coming out describing the cognitive bias which makes people believe this particular piece of baloney.
Here’s some advice: go get laid, people, or whatever it is that you really enjoy, and then have a really good night’s sleep, and you’ll feel much more creative in the morning. Hell, you might even think of something during the night – all my good ideas come to me when I’m asleep.
Even though her description of tenure-track life resonates with me, this problem, of individuals needlessly sacrificing their quality of life, isn’t confined to academia by any means. For example I certainly saw a lot of it at D.E. Shaw as well.
In fact I think it happens anywhere where there’s an intense environment of expectation, with some kind of incredibly slow-moving weeding process – academia has tenure, D.E. Shaw has “who gets to be a Managing Director”. People spend months or even years in near-paralysis wondering if their superiors think they’re measuring up. Gross!
Ultimately it happens to someone when they start believing in the system. Conversely the only way to avoid that kind of oppression is to live your life in denial of the system, which is what Nagpal achieved by insisting on thinking of her tenure-track job as having no particular goal.
Which didn’t mean she didn’t work hard and get her personal goals done, and I have tremendous respect for her work ethic and drive. I’m not suggesting that we all get high-powered positions and then start slacking. But we have to retain our humanity above all.
Bottomline, let’s perfect the art of ignoring the system when it’s oppressive, since it’s a useful survival tactic, and also intrinsically changes the system in a positive way by undermining it. Plus it’s way more fun.
Math fraud in pensions
I wrote a post three months ago talking about how we don’t need better models but we need to stop lying with our models. My first example was municipal debt and how various towns and cities are in deep debt partly because their accounting for future pension obligations allows them to be overly optimistic about their investments and underfund their pension pots.
This has never been more true than it is right now, and as this New York Times Dealbook article explains, was a major factor in Detroit’s bankruptcy filing this past week. But don’t make any mistake: even in places where they don’t end up declaring bankruptcy, something is going to shake out because of these broken models, and it isn’t going to be extra money for retired civil servants.
It all comes down to wanting to avoid putting required money away and hiring quants (in this case actuaries) to make that seem like it’s mathematically acceptable. It’s a form of mathematical control fraud. From the article:
When a lender calculates the value of a mortgage, or a trader sets the price of a bond, each looks at the payments scheduled in the future and translates them into today’s dollars, using a commonplace calculation called discounting. By extension, it might seem that an actuary calculating a city’s pension obligations would look at the scheduled future payments to retirees and discount them to today’s dollars.
But that is not what happens. To calculate a city’s pension liabilities, an actuary instead projects all the contributions the city will probably have to make to the pension fund over time. Many assumptions go into this projection, including an assumption that returns on the investments made by the pension fund will cover most of the plan’s costs. The greater the average annual investment returns, the less the city will presumably have to contribute. Pension plan trustees set the rate of return, usually between 7 percent and 8 percent.
In addition, actuaries “smooth” the numbers, to keep big swings in the financial markets from making the pension contributions gyrate year to year. These methods, actuarial watchdogs say, build a strong bias into the numbers. Not only can they make unsustainable pension plans look fine, they say, but they distort the all-important instructions actuaries give their clients every year on how much money to set aside to pay all benefits in the future.
One caveat: if the pensions have actually been making between 7 percent and 8 percent on their investments every year then all is perhaps well. But considering that they typically invest in bonds, not stocks – which is a good thing – we’re likely seeing much smaller returns than that, which means their yearly contributions to the local pension plans are in dire straits.
What’s super interesting about this article is that it goes into the action on the ground inside the Actuary community, since their reputations are at stake in this battle:
A few years ago, with the debate still raging and cities staggering through the recession, one top professional body, the Society of Actuaries, gathered expert opinion and realized that public pension plans had come to pose the single largest reputational risk to the profession. A Public Plans Reputational Risk Task Force was convened. It held some meetings, but last year, the matter was shifted to a new body, something called the Blue Ribbon Panel, which was composed not of actuaries but public policy figures from a number of disciplines. Panelists include Richard Ravitch, a former lieutenant governor of New York; Bradley Belt, a former executive director of the Pension Benefit Guaranty Corporation; and Robert North, the actuary who shepherds New York City’s five big public pension plans.
I’m not sure what happened here, but it seems like a bunch of people in a profession, the actuaries, got worried that they were being used by politicians, and decided to investigate, but then that initiative got somehow replaced by a bunch of politicians. I’d love to talk to someone on the inside about this.
When is math like a microwave?
When I worked as a research mathematician, I was always flabbergasted by the speed at which other people would seem to absorb mathematical theory. I had then, and pretty much have now, this inability to believe anything that I can’t prove from first principles, or at least from stuff I already feel completely comfortable with. For me, it’s essentially mathematically unethical to use a result I can’t prove or at least understand locally.
I only recently realized that not everyone feels this way. Duh. People often just assemble accepted facts about a field quickly just to explore the landscape and get the feel for something – it makes complete sense to me now that one can do this and it doesn’t seem at all weird. And it explains what I saw happening in grad school really well too.
Most people just use stuff they “know to be true,” without having themselves gone through the proof. After all, things like Deligne’s work on Weil Conjectures or Gabber’s recent work on finiteness of etale cohomology for pseudo-excellent schemes are really fucking hard, and it’s much more efficient to take their results and use them than it is to go through all the details personally.
After all, I use a microwave every day without knowing how it works, right?
I’m not sure I know where I got the feeling that this was an ethical issue. Probably it happened without intentional thought, when I was learning what a proof is in math camp, and I’d perhaps state a result and someone would say, how do you know that? and I’d feel like an asshole unless I could prove it on the spot.
Anyway, enough about me and my confused definition of mathematical ethics – what I now realize is that, as mathematics is developed more and more, it will become increasingly difficult for a graduate student to learn enough and then prove an original result without taking things on faith more and more. The amount of mathematical development in the past 50 years is just frighteningly enormous, especially in certain fields, and it’s just crazy to imagine someone learning all this stuff in 2 or 3 years before working on a thesis problem.
What I’m saying, in other words, is that my ethical standards are almost provably unworkable in modern mathematical research. Which is not to say that, over time, a person in a given field shouldn’t eventually work out all the details to all the things they’re relying on, but it can’t be linear like I forced myself to work.
And there’s a risk, too: namely, that as people start getting used to assuming hard things work, fewer mistakes will be discovered. It’s a slippery slope.
The Bounded Gaps Between Primes Theorem has been proved
There’s really exciting news in the world of number theory, my old field. I heard about it last month but it just hit the mainstream press.
Namely, mathematician Yitang Zhang just proved is that there are infinitely many pairs of primes that differ by at most 70,000,000. His proof is available here and, unlike Mochizuki’s claim of a proof of the ABC Conjecture, this has already been understood and confirmed by the mathematical community.

Mathematician Yitang Zhang
Go take a look at number theorist Emmanuel Kowalski‘s blog post on the subject if you want to understand the tools Zhang used in his proof.
Also, my buddy and mathematical brother Jordan Ellenberg has an absolutely beautiful article in Slate explaining why mathematicians believed this theorem had to be true, due to the extent to which we can consider prime numbers to act as if they are “randomly distributed.” My favorite passage from Jordan’s article:
It’s not hard to compute that, if prime numbers behaved like random numbers, you’d see precisely the behavior that Zhang demonstrated. Even more: You’d expect to see infinitely many pairs of primes that are separated by only 2, as the twin primes conjecture claims.
(The one computation in this article follows. If you’re not onboard, avert your eyes and rejoin the text where it says “And a lot of twin primes …”)
Among the first N numbers, about N/log N of them are primes. If these were distributed randomly, each number n would have a 1/log N chance of being prime. The chance that n and n+2 are both prime should thus be about (1/log N)^2. So how many pairs of primes separated by 2 should we expect to see? There are about N pairs (n, n+2) in the range of interest, and each one has a (1/log N)^2 chance of being a twin prime, so one should expect to find about N/(log N)^2 twin primes in the interval.
Congratulations!
Caroline Chen on the ABC Conjecture
I was recently interviewed by Caroline Chen, a graduate student at Columbia’s Journalism School, about the status of Mochizuki’s proof the the ABC Conjecture. I think she found me through my previous post on the subject.
Anyway, her article just came out, and I like it and wanted to share it, even though I don’t like the title (“The Paradox of the Proof”) because I don’t like the word paradox (when someone calls something a paradox, it means they are making an assumption that they don’t want to examine). But that’s just a pet peeve – the article is nice, and it features my buddies Moon and Jordan and my husband Johan.
Read the article here.
Guest post: Kaisa Taipale visualizes mathematics Ph.D.’s emigration patterns
This is a guest post by Kaisa Taipale. Kaisa got a BS at Caltech, a Ph.D. in math at the University of Minnesota, was a post-doc at MSRI, an assistant professor at St. Olaf College 2010-2012, and is currently visiting Cornell, which is where I met here a couple of weeks ago, and where she told me about her cool visualizations of math Ph.D. emigration patterns and convinced her to write a guest post. Here’s Kaisa on a bridge:

Math data and viz
I was inspired by this older post on Mathbabe, about visualizing the arXiv postings of various math departments.
It got me thinking about tons of interesting questions I’ve asked myself and could answer with visualizations: over time, what’s been coolest on the arXiv? are there any topics that are especially attractive to hiring institutions? There’s tons of work to do!
I had to start somewhere though, and as I’m a total newbie when it comes to data analysis, I decided to learn some skills while focusing on a data set that I have easy non-technical access to and look forward to reading every year. I chose the AMS Annual Survey. I also wanted to stick to questions really close to my thoughts over the last two years, namely the academic job search.
I wanted to learn to use two tools, R and Circos. Why Circos? See the visualizations of college major and career path here – it’s pretty! I’ve messed around with a lot of questions, but in this post I’ll look at two and a half.
Graduating PhDs
Where do graduating PhDs from R1 universities end up, in the short term? I started with graduates of public R1s, as I got my PhD at one.

The PhD-granting institutions are colored green, while academic institutions granting other degrees are in blue. Purple is for business, industry, government, and research institutions. Red is for non-U.S. employment or people not seeking — except for the bright red, which is still seeking. Yellow rounds things out at unknown. Remember, these figures are for immediate plans after graduation rather than permanent employment.
While I was playing with this data (read “learning how to use the reshape and ggplot2 packages”) I noticed that people from private R1s tend to end up at private R1s more often. So I graphed that too.

Does the professoriate in the audience have any idea if this is self-selection or some sort of preference on the part of employers? Also, what happened between 2001 and 2003? I was still in college, and have no idea what historical events are at play here.
Where mathematicians go
For any given year, we can use a circular graph to show us where people go. This is a more clumped version of the above data from 2010 alone, plotted using Circos. (Supplemental table E.4 from the AMS report online.)
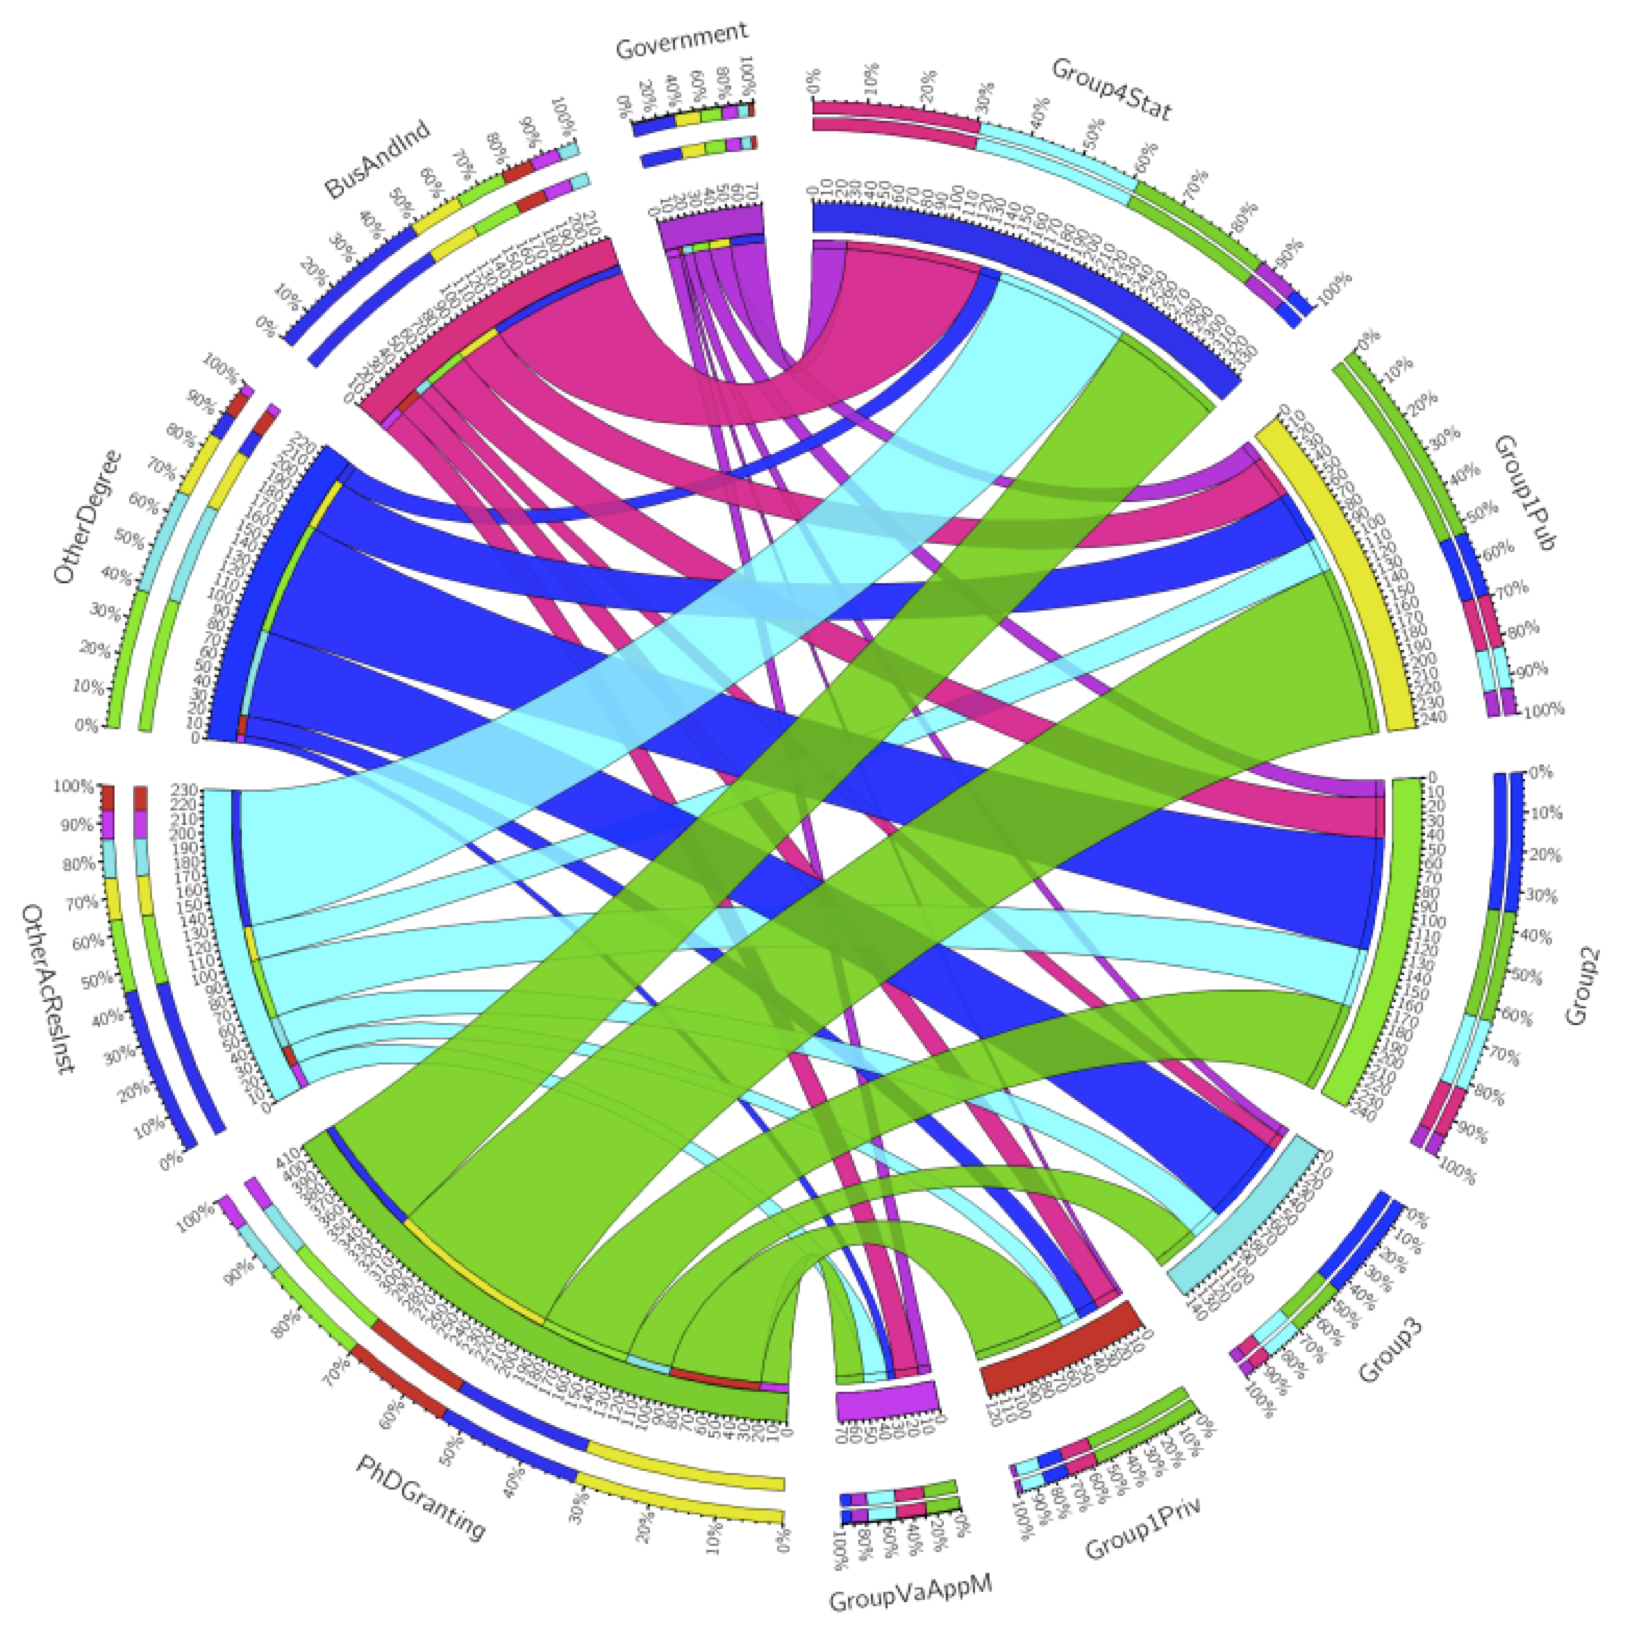
The other question – the question current mathematicians secretly care more about, in a gossipy and potentially catty way – is what fields lead to what fate. We all know algebra and number theory are the purest and most virtuous subjects, and applied math is for people who want to make money or want to make a difference in the world.
[On that note, you might notice that I removed statistics PhDs in the visualization below, and I also removed some of the employment sectors that gained only a few people a year. The stats ribbons are huge and the small sectors are very small, so for looks alone I took them out.]
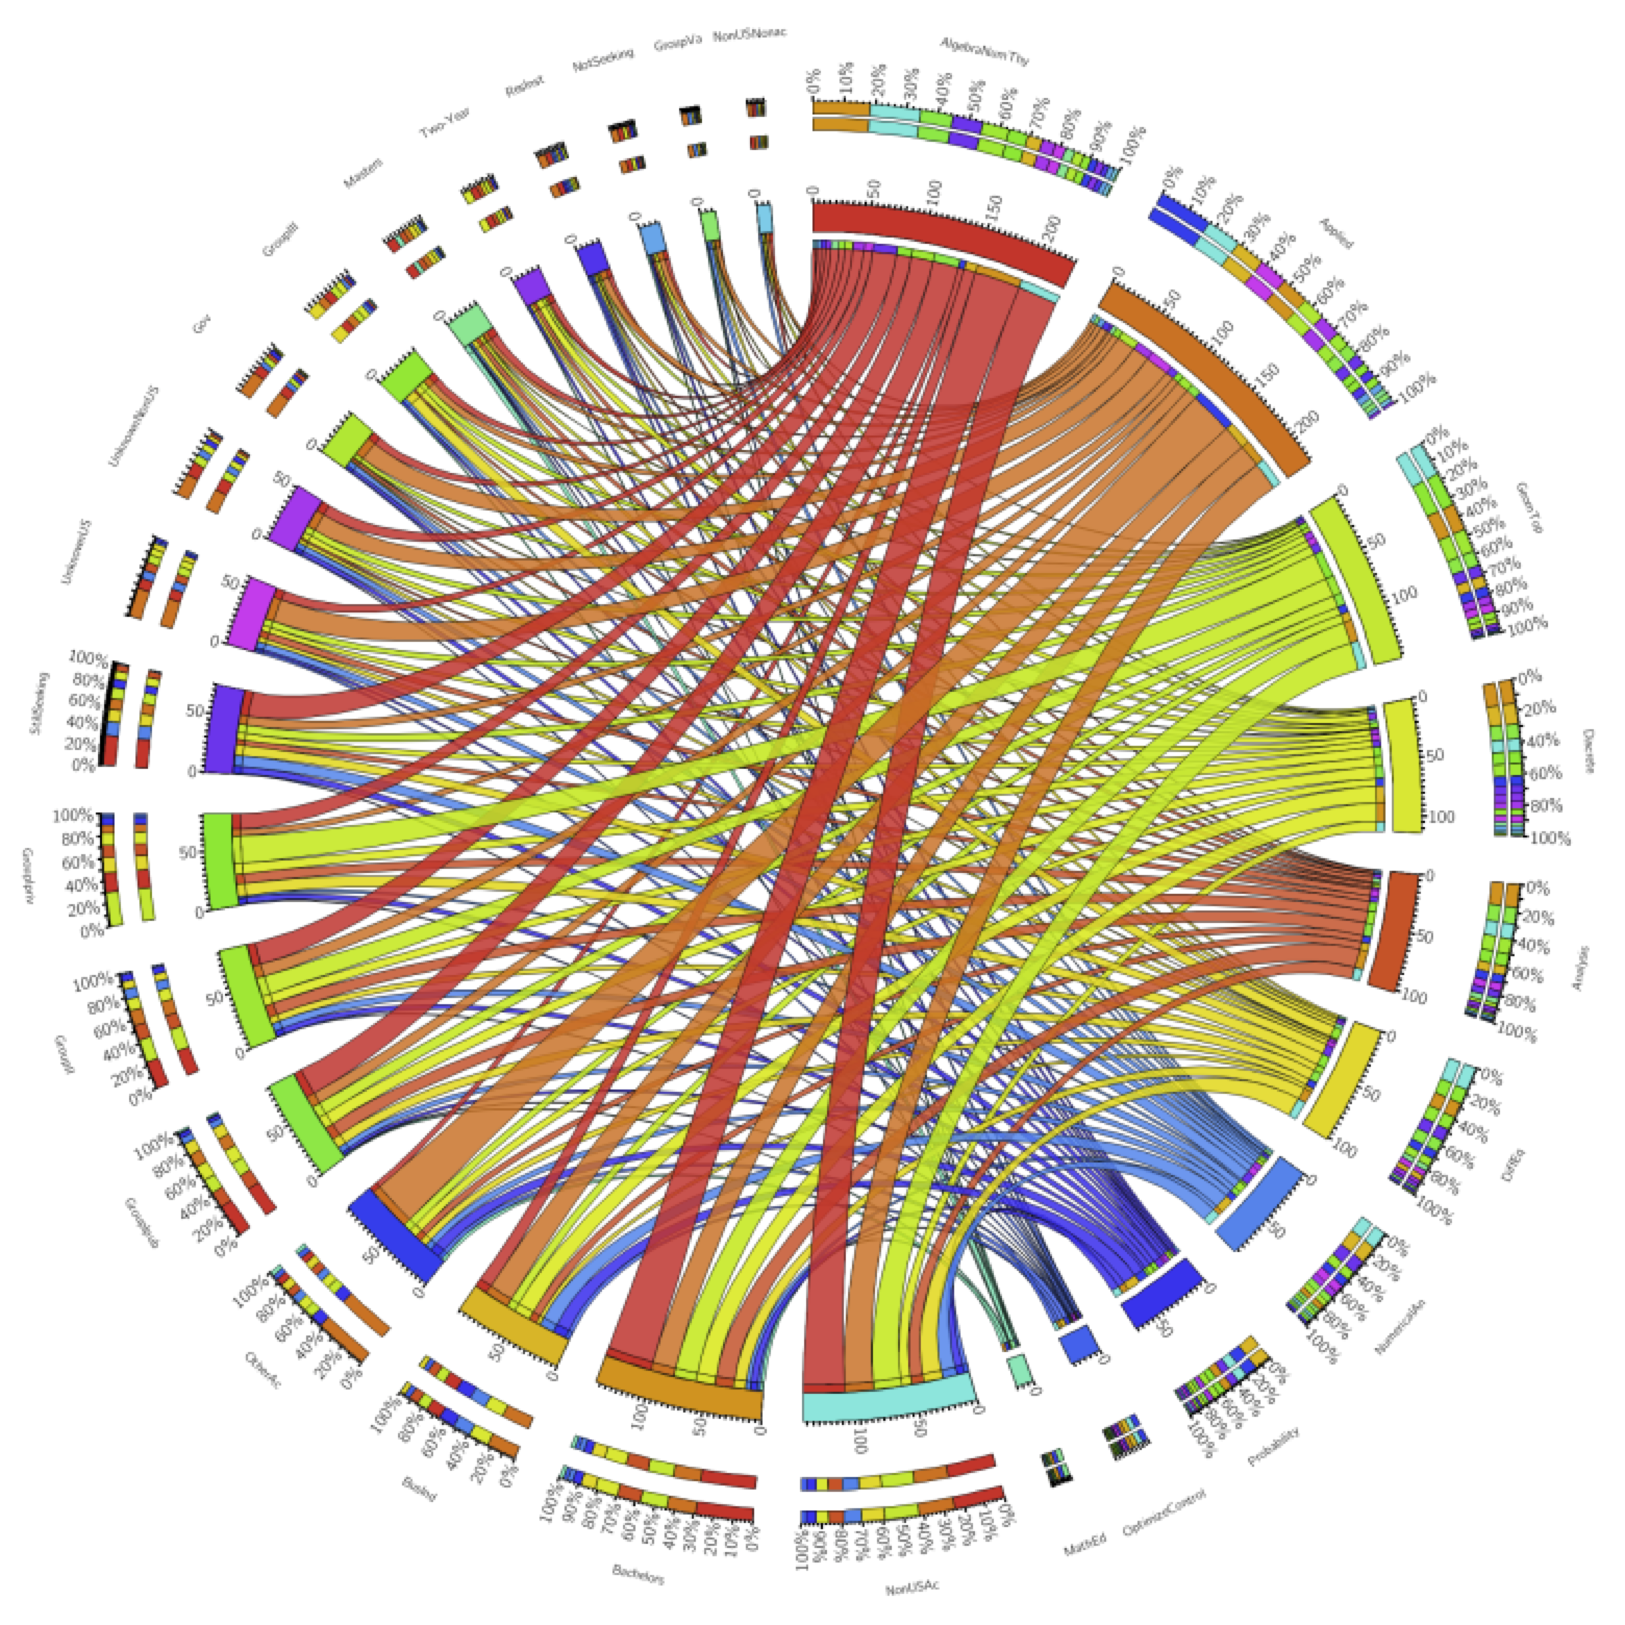 Higher resolution version available here.
Wish list
I wish I could animate a series of these to show this view over time as well. Let me know if you know how to do that! Another nice thing I could do would be to set up a webpage in which these visualizations could be explored in a bit more depth. (After finals.)
Also:
- I haven’t computed any numbers for you
- the graphs from R show employment in each field by percentage of graduates instead of total number per category;
- it’s hard to show both data over time and all the data one could explore. But it’s a start.
I should finish with a shout-out to Roger Peng and Jeff Leek, though we’ve never met: I took Peng’s Computing for Data Analysis and much of Leek’s Data Analysis on Coursera (though I’m one of those who didn’t finish the class). Their courses and Stack Overflow taught me almost everything I know about R. As I mentioned above, I’m pretty new to this type of analysis.
What questions would you ask? How can I make the above cooler? Did you learn anything?
A public-facing math panel
I’m returning from two full days of talking to mathematicians and applied mathematicians at Cornell. I was really impressed with the people I met there – thoughtful, informed, and inquisitive – and with the kind reception they gave me.
I gave an “Oliver Talk” which was joint with the applied math colloquium on Thursday afternoon. The goal of my talk was to convince mathematicians that there’s a very bad movement underway whereby models are being used against people, in predatory ways, and in the name of mathematics. I turned some people off, I think, by my vehemence, but then again it’s hard not get riled up about this stuff, because it’s creepy and I actually think there’s a huge amount at stake.
One thing I did near the end of my talk was bring up (and recruit for) the idea of a panel of mathematicians which defines standards for public-facing models and vets the current crop.
The first goal of such a panel would be to define mathematical models, with a description of “best practices” when modeling people, including things like anticipating impact, gaming, and feedback loops of models, and asking for transparent and ongoing evaluation methods, as well as having minimum standards for accuracy.
The second goal of the panel would be to choose specific models that are in use and measure the extent to which they pass the standards of the above best practices rubric.
So the teacher value-added model, I’d expect, would fail in that it doesn’t have an evaluation method, at least that is made public, nor does it seem to have any accuracy standards, even though it’s widely used and is high impact.
I’ve had some pretty amazing mathematicians already volunteer to be on such a panel, which is encouraging. What’s cool is that I think mathematicians, as a group, are really quite ethical and can probably make their voices heard and trusted if they set their minds to it.
Guest post by Julia Evans: How I got a data science job
This is a guest post by Julia Evans. Julia is a data scientist & programmer who lives in Montréal. She spends her free time these days playing with data and running events for women who program or want to — she just started a Montréal chapter of pyladies to teach programming, and co-organize a monthly meetup called Montréal All-Girl Hack Night for women who are developers.
I asked mathbabe a question a few weeks ago saying that I’d recently started a data science job without having too much experience with statistics, and she asked me to write something about how I got the job. Needless to say I’m pretty honoured to be a guest blogger here 🙂 Hopefully this will help someone!
Last March I decided that I wanted a job playing with data, since I’d been playing with datasets in my spare time for a while and I really liked it. I had a BSc in pure math, a MSc in theoretical computer science and about 6 months of work experience as a programmer developing websites. I’d taken one machine learning class and zero statistics classes.
In October, I left my web development job with some savings and no immediate plans to find a new job. I was thinking about doing freelance web development. Two weeks later, someone posted a job posting to my department mailing list looking for a “Junior Data Scientist”. I wrote back and said basically “I have a really strong math background and am a pretty good programmer”. This email included, embarrassingly, the sentence “I am amazing at math”. They said they’d like to interview me.
The interview was a lunch meeting. I found out that the company (Via Science) was opening a new office in my city, and was looking for people to be the first employees at the new office. They work with clients to make predictions based on their data.
My interviewer (now my manager) asked me about my role at my previous job (a little bit of everything — programming, system administration, etc.), my math background (lots of pure math, but no stats), and my experience with machine learning (one class, and drawing some graphs for fun). I was asked how I’d approach a digit recognition problem and I said “well, I’d see what people do to solve problems like that, and I’d try that”.
I also talked about some data visualizations I’d worked on for fun. They were looking for someone who could take on new datasets and be independent and proactive about creating model, figuring out what is the most useful thing to model, and getting more information from clients.
I got a call back about a week after the lunch interview saying that they’d like to hire me. We talked a bit more about the work culture, starting dates, and salary, and then I accepted the offer.
So far I’ve been working here for about four months. I work with a machine learning system developed inside the company (there’s a paper about it here). I’ve spent most of my time working on code to interface with this system and make it easier for us to get results out of it quickly. I alternate between working on this system (using Java) and using Python (with the fabulous IPython Notebook) to quickly draw graphs and make models with scikit-learn to compare our results.
I like that I have real-world data (sometimes, lots of it!) where there’s not always a clear question or direction to go in. I get to spend time figuring out the relevant features of the data or what kinds of things we should be trying to model. I’m beginning to understand what people say about data-wrangling taking up most of their time. I’m learning some statistics, and we have a weekly Friday seminar series where we take turns talking about something we’ve learned in the last few weeks or introducing a piece of math that we want to use.
Overall I’m really happy to have a job where I get data and have to figure out what direction to take it in, and I’m learning a lot.
Leila Schneps is a mystery writer!
I’m back! I missed you guys bad.
My experience with Seattle in the last 8 days has convinced me of something I rather suspected, namely I’m a huge New York snob and can’t exist happily anywhere else. I will spare you the details (they have to do with cars, subways, and being an asshole pedestrian) but suffice it to say, glad to be home.
Just a few caveats on complaining about my vacation:
- I enjoyed visiting the University of Washington and giving the math colloquium there as well as a “Math Day” talk where I showed kids the winning strategy for Nim (as well as other impartial two-player games) following my notes from last summer.
- I enjoyed reading Leon and Becky’s guest posts. Thanks guys!
- And then there was the time spent with my darling family. Of course, goes without saying, it’s always magical to get to the point where your kids have invented a whole new language of insults after you’ve outlawed certain words: “Shut your fidoodle, you syncopathic lardle!”
Of all the topics I want to write about today, I’ve decided to go with the most immediate and surprising one : Leila Schneps is now a mystery writer! How cool is that? She’s written a book with her daughter, Math on Trial: How Numbers Get Used and Abused in the Courtroom, currently in stock and available on Amazon. And she wrote an op-ed for the New York Times talking about it (hat tip Chris Wiggins).
I know Leila from having been her grad student assistant at the GWU Summer Program for Women in Math the first year it existed, in 1995. She taught undergrads about Galois cohomology and interpreted elements of 

I love the premise of the book she’s written. She finds a bunch of historical examples where mathematics is used in trials to the detriment of justice, and people get unfairly jailed (or, less often, let free). From the op-ed (emphasis mine):
Decades ago, the Harvard law professor Laurence H. Tribe wrote a stinging denunciation of the use of mathematics at trial, saying that the “overbearing impressiveness” of numbers tends to “dwarf” other evidence. But we neither can nor should throw math out of the courtroom. Advances in forensics, which rely on data analysis for everything from gunpowder to DNA, mean that quantitative methods will play an ever more important role in judicial deliberations.
The challenge is to make sure that the math behind the legal reasoning is fundamentally sound. Good math can help reveal the truth. But in inexperienced hands, math can become a weapon that impedes justice and destroys innocent lives.
Go Leila!
Is mathematics a vehicle for control fraud?
Bill Black
A couple of nights I ago I attended this event at Columbia on the topic of “Rent-Seeking, Instability and Fraud: Challenges for Financial Reform”.
The event was great, albeit depressing – I particularly loved Bill Black‘s concept of control fraud, which I’ll talk more about in a moment, as well as Lynn Turner‘s polite description of the devastation caused by the financial crisis.
To be honest, our conclusion wasn’t a surprise: there is a lack of political will in Congress or elsewhere to fix the problems, even the low-hanging obvious criminal frauds. There aren’t enough actual police to take on the job of dealing with the number of criminals that currently hide in the system (I believe the statistic was that there are about 1,000,000 people in law enforcement in this country, and 2,500 are devoted to white-collar crime), and the people at the top of the regulatory agencies have been carefully chosen to not actually do anything (or let their underlings do anything).
Even so, it was interesting to hear about this stuff through the eyes of a criminologist who has been around the block (Black was the guy who put away a bunch of fraudulent bankers after the S&L crisis) and knows a thing or two about prosecuting crimes. He talked about the concept of control fraud, and how pervasive control fraud is in the current financial system.
Control Fraud
Control fraud, as I understood him to describe it, is the process by which a seemingly legitimate institution or process is corrupted by a fraudulent institution to maintain the patina of legitimacy.
Once you say it that way, you recognize it everywhere, and you realize how dirty it is, since outsiders to the system can’t tell what’s going on – hey, didn’t you have overseers? Didn’t they say everything was checking out ok? What the hell happened?
So for example, financial firms like Bank of America used control fraud in the heart of the housing bubble via their ridiculous accounting methods. As one of the speakers mentioned, the accounting firm in charge of vetting BofA’s books issued the same exact accounting description for many years in the row (literally copy and paste) even as BofA was accumulating massive quantities of risky mortgage-backed securities (update: I’ve been told it’s called an “Auditors Report” and it has required language. But surely not all the words are required? Otherwise how could it be called a report?). In other words, the accounting firm had been corrupted in order to aid and abet the fraud.
“Financial Innovation”
To get an idea of the repetitive nature and near-inevitability of control fraud, read this essay by Black, which is very much along the lines of his presentation on Tuesday. My favorite passage is this, when he addresses how our regulatory system “forgot about” control fraud during the deregulation boom of the 1990’s:
On January 17, 1996, OTS’ Notice of Proposed Rulemaking proposed to eliminate its rule requiring effective underwriting on the grounds that such rules were peripheral to bank safety.
“The OTS believes that regulations should be reserved for core safety and soundness requirements. Details on prudent operating practices should be relegated to guidance.
Otherwise, regulated entities can find themselves unable to respond to market innovations because they are trapped in a rigid regulatory framework developed in accordance with conditions prevailing at an earlier time.”
This passage is delusional. Underwriting is the core function of a mortgage lender. Not underwriting mortgage loans is not an “innovation” – it is a “marker” of accounting control fraud. The OTS press release dismissed the agency’s most important and useful rule as an archaic relic of a failed philosophy.
Here’s where I bring mathematics into the mix. My experience in finance, first as a quant at D.E. Shaw, and then as a quantitative risk modeler at Riskmetrics, convinced me that mathematics itself is a vehicle for control fraud, albeit in two totally different ways.
Complexity
In the context of hedge funds and/or hard-core trading algorithms, here’s how it works. New-fangled complex derivatives, starting with credit default swaps and moving on to CDO’s, MBS’s, and CDO+’s, got fronted as “innovation” by a bunch of economists who didn’t really know how markets work but worked at fancy places and claimed to have mathematical models which proved their point. They pushed for deregulation based on the theory that the derivatives represented “a better way to spread risk.”
Then the Ph.D.’s who were clever enough to understand how to actually price these instruments swooped in and made asstons of money. Those are the hedge funds, which I see as kind of amoral scavengers on the financial system.
At the same time, wanting a piece of the action, academics invented associated useless but impressive mathematical theories which culminated in mathematics classes throughout the country that teach “theory of finance”. These classes, which seemed scientific, and the associated economists described above, formed the “legitimacy” of this particular control fraud: it’s math, you wouldn’t understand it. But don’t you trust math? You do? Then allow us to move on with rocking our particular corner of the financial world, thanks.
Risk
I also worked in quantitative risk, which as I see it is a major conduit of mathematical control fraud.
First, we have people putting forward “risk estimates” that have larger errorbars then the underlying values. In other words, if we were honest about how much we can actually anticipate price changes in mortgage backed securities in times of panic, then we’d say something like, “search me! I got nothing.” However, as we know, it’s hard to say “I don’t know” and it’s even harder to accept that answer when there’s money on the line. And I don’t apologize for caring about “times of panic” because, after all, that’s why we care about risk in the first place. It’s easy to predict risk in quiet times, I don’t give anyone credit for that.
Never mind errorbars, though- the truth is, I saw worse than ignorance in my time in risk. What I actually saw was a rubberstamping of “third part risk assessment” reports. I saw the risk industry for what it is, namely a poor beggar at the feet of their macho big-boys-of-finance clients. It wasn’t just my firm either. I’ve recently heard of clients bullying their third party risk companies into allowing them to replace whatever their risk numbers were by their own. And that’s even assuming that they care what the risk reports say.
Conclusion
Overall, I’m thinking this time is a bit different, but only in the details, not in the process. We’ve had control fraud for a long long time, but now we have an added tool in the arsenal in the form of mathematics (and complexity). And I realize it’s not a standard example, because I’m claiming that the institution that perpetuated this particular control fraud wasn’t a specific institution like Bank of America, but rather then entire financial system. So far it’s just an idea I’m playing with, what do you think?
Gender bias in math
I don’t agree with everything she always says, but I agree with everything Izabella Laba says in this post called Gender Bias 101 For Mathematicians (hat tip Jordan Ellenberg). And I’m kind of jealous she put it together in such a fantastic no-bullshit way.
Namely, she debunks a bunch of myths of gender bias. Here’s my summary, but you should read the whole thing:
- Myth: Sexism in math is perpetrated mainly by a bunch of enormously sexist old guys. Izabella: Nope, it’s everyone, and there’s lots of evidence for that.
- Myth: The way to combat sexism is to find those guys and isolate them. Izabella: Nope, that won’t work, since it’s everyone.
- Myth: If it’s really everyone, it’s too hard to solve. Izabella: Not necessarily, and hey you are still trying to solve the Riemann Hypothesis even though that’s hard (my favorite argument).
- Myth: We should continue to debate about its existence rather than solution. Izabella: We are beyond that, it’s a waste of time, and I’m not going to waste my time anymore.
- Myth: Izabella, you are only writing this to be reassured. Izabella: Don’t patronize me.
Here’s what I’d add. I’ve been arguing for a long time that gender bias against girls in math starts young and starts at the cultural level. It has to do with expectations of oneself just as much as a bunch of nasty old men (by the way, the above is not to say there aren’t nasty old men (and nasty old women!), just that it’s not only about them).
My argument has been that the cultural differences are larger than the talent differences, something Larry Summers strangely dismissed without actually investigating in his famous speech.
And I think I’ve found the smoking gun for my side of this argument, in the form of an interactive New York Times graphic from last week’s Science section which I’ve screenshot here:
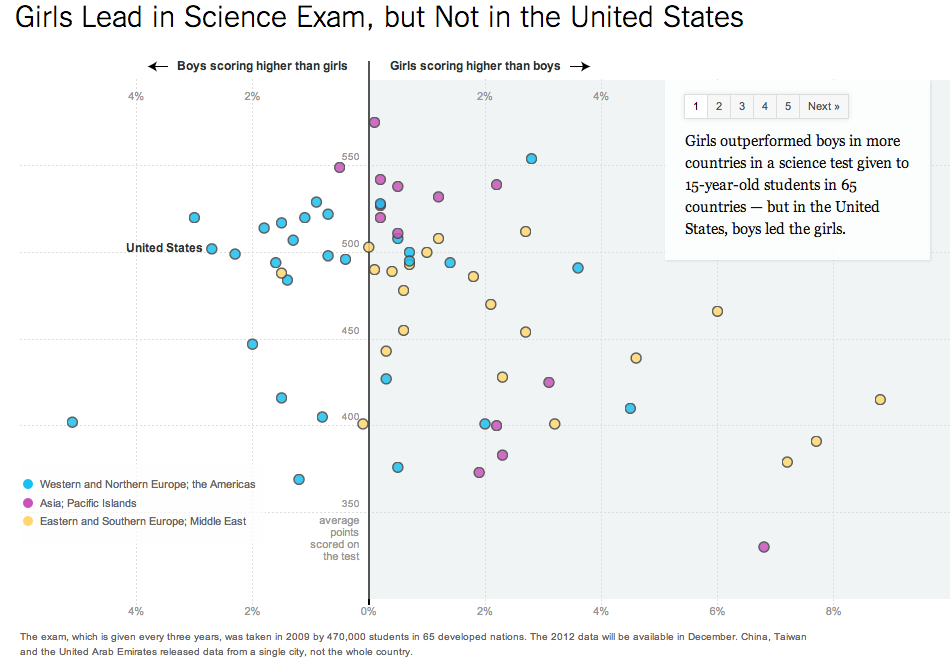
What this shows is that 15-year-old girls out-perform 15-year-old boys in certain countries and under-perform them in others. Those countries where they outperform boys is not random and has everything to do with cultural expectations and opportunities for girls in those countries and is explained to some extent by stereotype threat. Go read the article, it’s fascinating.
I’ll say again what I said already at the end of this post: the great news is that it is possible to address stereotype threat directly, which won’t solve everything but will go a long way.
You do it by emphasizing that mathematical talent is not inherent, nor fixed at birth, and that you can cultivate it and grow it over time and through hard work. I make this speech whenever I can to young people. Spread the word!
Links to videotaped talks and pdf slides
Busy at work today but I wanted to share a few links coming out of talks I gave recently.
First the one I gave at Brown University at the Agnes Conference (October 2012). It’s called “How Math is Used outside Academia”.
Second the one I gave at Stony Brook’s colloquium (December 2012). It has the same title.
These two are videos of the same talk (although with very different audiences), so please don’t watch both of them, you will get bored! If you like friendly audiences, go with Agnes. If you like to watch me getting heckled, go with Stony Brook.
[p.s.: I pretty much never watch other people’s videos, so please don’t watch either one, actually.]
The third talk, which was the shortest, was at the Joint Math Meetings (January 2013) but I don’t think it was taped. It was called Weapons of Math Destruction and the slides are available here (I’ve turned them into a pdf).
Barry Mazur wins the National Medal of Science
Last Friday my thesis advisor Barry Mazur got awarded the National Medal of Science (hat tip Mike Hopkins).
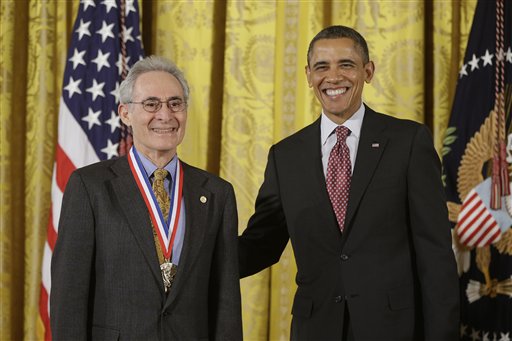
President Barack Obama awards the National Medal of Science to Dr. Barry Mazur of Harvard University, Friday, Feb. 1, 2013, during a ceremony in the East Room of the White House in Washington. The awards are the highest honors bestowed by the United States Government upon scientists, engineers, and inventors. (AP Photo/Charles Dharapak)
One of many wonderful things about Barry is how broad his interests are (in addition to being profoundly deep). I remember that, in order to get time to talk math with him in grad school, he’d bring me to poetry readings so we could discuss math during the intermission. Last semester he taught a class with people from the law school about the shifting concept of evidence in different fields.
That guy is awesome.
At the JMM
I spent yesterday at the Joint Math Meetings here in San Deigo and I gave my talk just before lunch. A few observations:
- Mathematicians are even nerdier than I remember
- There are way more mathematicians here than I thought exist
- A bunch of them are people I kinda remember fondly
- But there are also people I would be okay with never seeing again
- The result is an emotional random walk with a slightly positive drift as I walk down the hall (internal dialog: “oh, hey! hugs!” with probability
“I’ma turn here and walk fast” with probability
)
- The result of that is a shopping mall-like exhaustion that sets in within 30 minutes of being at the conference.
- If I have run into you at the JMM, rest assured our meeting happened with probability

I had a nice time giving my talk, though, and I accidentally invited the audience of about 140 people to have lunch with me when in fact I had already agreed to have lunch with the small group of speakers and organizer Suzy Weekes.
So for the people who are still interested in having lunch with me, meet me at noon at Bub’s, which is located right next to the ballpark on the corner of J Street and 7th Ave. See you there!
Making math beautiful with XyJax
My husband A. Johan de Jong has an open source algebraic geometry project called the stacks project. It’s hosted at Columbia, just like his blog which is aptly named the stacks project blog.
The stacks project is awesome: it explains the theory of stacks thoroughly, assuming only that you have a basic knowledge of algebra and a shitload of time to read. It’s about three thousand update: it’s exactly 3,452 pages, give or take, and it has a bunch of contributors besides Johan. I’m on the list most likely because of the fact that I helped him develop the tag system which allows permanent references to theorems and lemmas even within an evolving latex manuscript.
He even has pictures of tags, and hands out t-shirts with pictures of tags when people find mistakes in the stacks project.
Speaking of latex, that’s what I wanted to mention today.
Recently a guy named Pieter Belmans has been helping Johan out with development for the site: spiffing it up and making it look more professional. The most recent thing he did was to render the latex into human readable form using XyJax package, which is an “almost xy-pic compatible package for MathJax“. I think they are understating the case; it looks great to me:
-

- Before
-
- After
-

- Before
-

- After
How math departments hire faculty
I just got back from a stimulating trip to Stony Brook to give the math colloquium there. I had a great time thanks to my gracious host Jason Starr (this guy, not this guy), and besides giving my talk (which I will give again in San Diego at the joint meetings next month) I enjoyed two conversations about the field of math which I think could be turned into data science projects. Maybe Ph.D. theses or something.
First, a system for deciding whether a paper on the arXiv is “good.” I will post about that on another day because it’s actually pretty involved and possible important.
Second is the way people hire in math departments. This conversation will generalize to other departments, some more than others.
So first of all, I want to think about how the hiring process actually works. There are people who look at folders of applicants, say for tenure-track jobs. Since math is a pretty disjointed field, a majority of the folders will only be understood well enough for evaluation purposes by a few people in the department.
So in other words, the department naturally splits into clusters more or less along field lines: there are the number theorists and then there are the algebraic geometers and then there are the low-dimensional topologists, say.
Each group of people reads the folders from the field or fields that they have enough expertise in to understand. Then from among those they choose some they want to go to bat for. It becomes a political battle, where each group tries to convince the other groups that their candidates are more qualified. But of course it’s really hard to know who’s telling the honest truth. There are probably lots of biases in play too, so people could be overstating their cases unconsciously.
Some potential problems with this system:
- if you are applying to a department where nobody is in your field, nobody will read your folder, and nobody will go to bat for you, even if you are really great. An exaggeration but kinda true.
- in order to be convincing that “your guy is the best applicant,” people use things like who the advisor is or which grad school this person went to more than the underlying mathematical content.
- if your department grows over time, this tends to mean that you get bigger clusters rather than more clusters. So if you never had a number theorist, you tend to never get one, even if you get more positions. This is a problem for grad students who want to become number theorists, but that probably isn’t enough to affect the politics of hiring.
So here’s my data science plan: test the above hypotheses. I said them because I think they are probably true, but it would be not be impossible to create the dataset to test them thoroughly and measure the effects.
The easiest and most direct one to test is the third: cluster departments by subject by linking the people with their published or arXiv’ed papers. Watch the department change over time and see how the clusters change and grow versus how it might happen randomly. Easy peasy lemon squeazy if you have lots of data. Start collecting it now!
The first two are harder but could be related to the project of ranking papers. In other words, you have to define “is really great” to do this. It won’t mean you can say with confidence that X should have gotten a job at University Y, but it would mean you could say that if X’s subject isn’t represented in University Y’s clusters, then X’s chances of getting a job there, all other things being equal, is diminished by Z% on average. Something like that.
There are of course good things about the clustering. For example, it’s not that much fun to be the only person representing a field in your department. I’m not actually passing judgment on this fact, and I’m also not suggesting a way to avoid it (if it should be avoided).
Diophantus and the math arXiv
Last night my 7th-grade son, who is working on a school project about the mathematician Diophantus, walked into the living room with a mopey expression.
He described how Diophantus worked on a series of mathematical texts called Arithmetica, in which he described the solutions to what we now describe as diophantine equations, but which are defined as polynomial equations with strictly integer coefficients, and where the solutions we care about are also restricted to be integers. I care a lot about this stuff because it’s what I studied when I was an academic mathematician, and I still consider this field absolutely beautiful.
What my son was upset about, though, was that of the 13 original books in Arhtimetica, only 6 have survived. He described this as “a way of losing progress“. I concur: Diophantus was brilliant, and there may be things we still haven’t recovered from that text.

But it also struck me that my son would be right to worry about this idea of losing progress even today.
We now have things online and often backed up, so you’d think we might never need to worry about this happening again. Moreover, there’s something called the arXiv where mathematicians and physicists put all or mostly all their papers before they’re published in journals (and many of the papers never make it to journals, but that’s another issue).
My question is, who controls this arXiv? There’s something going on here much like Josh Wills mentioned last week in Rachel Schutt’s class (and which Forbes’s Gil Press responded to already).
Namely, it’s not all that valuable to have one unreviewed, unpublished math paper in your possession. But it’s very valuable indeed to have all the math papers written in the past 10 years.
If we lost access to that collection, as a community, we will have lost progress in a huge way.
Note: I’m not accusing the people who run arXiv of anything weird. I’m sure they’re very cool, and I appreciate their work in keeping up the arXiv. I just want to acknowledge how much power they have, and how strange it is for an entire field to entrust that power to people they don’t know and didn’t elect in a popular vote.
As I understand it (and I could be wrong, please tell me if I am), the arXiv doesn’t allow crawlers to make back-ups of the documents. I think this is a mistake, as it increases the public reliance on this one resource. It’s unrobust in the same way it would be if the U.S. depended entirely on its food supply from a country whose motives are unclear.
Let’s not lose Arithmetica again.
The ABC Conjecture has not been proved
As I’ve blogged about before, proof is a social construct: it does not constitute a proof if I’ve convinced only myself that something is true. It only constitutes a proof if I can readily convince my audience, i.e. other mathematicians, that something is true. Moreover, if I claim to have proved something, it is my responsibility to convince others I’ve done so; it’s not their responsibility to try to understand it (although it would be very nice of them to try).
A few months ago, in August 2012, Shinichi Mochizuki claimed he had a proof of the ABC Conjecture:
For every 


The manuscript he wrote with the supposed proof of the ABC Conjecture is sprawling. Specifically, he wrote three papers to “set up” the proof and then the ultimate proof goes in a fourth. But even those four papers rely on various other papers he wrote, many of which haven’t been peer-reviewed.
The last four papers (see the end of the list here) are about 500 pages altogether, and the other papers put together are thousands of pages.
The issue here is that nobody understands what he’s talking about, even people who really care and are trying, and his write-ups don’t help.
For your benefit, here’s an excerpt from the very beginning of the fourth and final paper:
The present paper forms the fourth and final paper in a series of papers concerning “inter-universal Teichmuller theory”. In the first three papers of the series, we introduced and studied the theory surrounding the log-theta-lattice, a highly non-commutative two-dimensional diagram of “miniature models of conventional scheme theory”, called Θ±ell NF-Hodge theaters, that were associated, in the first paper of the series, to certain data, called initial Θ-data. This data includes an elliptic curve EF over a number field F , together with a prime number l ≥ 5. Consideration of various properties of the log-theta-lattice led naturally to the establishment, in the third paper of the series, of multiradial algorithms for constructing “splitting monoids of LGP-monoids”.
If you look at the terminology in the above paragraph, you will find many examples of mathematical objects that nobody has ever heard of: he introduces them in his tiny Mochizuki universe with one inhabitant.
When Wiles proved Fermat’s Last Theorem, he announced it to the mathematical community, and held a series of lectures at Cambridge. When he discovered a hole, he enlisted his former student, Richard Taylor, in helping him fill it, which they did. Then they explained the newer version to the world. They understood that it was new and hard and required explanation.
When Perelman proved the Poincare Conjecture, it was a bit tougher. He is a very weird guy, and he’d worked alone and really only written an outline. But he had used a well-known method, following Richard Hamilton, and he was available to answer questions from generous, hard-working experts. Ultimately, after a few months, this ended up working out as a proof.
I’m not saying Mochizuki will never prove the ABC Conjecture.
But he hasn’t yet, even if the stuff in his manuscript is correct. In order for it to be a proof, someone, preferably the entire community of experts who try, should understand it, and he should be the one explaining it. So far he hasn’t even been able to explain what the new idea is (although he did somehow fix a mistake at the prime 2, which is a good sign, maybe).
Let me say it this way. If Mochizuki died today, or stopped doing math for whatever reason, perhaps Grothendieck-style, hiding in the woods somewhere in Southern France and living off berries, and if someone (M) came along and read through all 6,000 pages of his manuscripts to understand what he was thinking, and then rewrote them in a way that uses normal language and is understandable to the expert number theorist, then I would claim that new person, M, should be given just as much credit for the proof as Mochizuki. It would be, by all rights, called the “Mochizuki and M Theorem”.
Come to think of it, whoever ends up interpreting this to the world will be responsible for the actual proof and should be given credit along with Mochizuki. It’s only fair, and it’s also the only thing that I can imagine would incentivize someone to do such a colossal task.
Update 5/13/13: I’ve closed comments on this post. I was getting annoyed with hostile comments. If you don’t agree with me feel free to start your own blog.
Medical research needs an independent modeling panel
I am outraged this morning.
I spent yesterday morning writing up David Madigan’s lecture to us in the Columbia Data Science class, and I can hardly handle what he explained to us: the entire field of epidemiological research is ad hoc.
This means that people are taking medication or undergoing treatments that may do they harm and probably cost too much because the researchers’ methods are careless and random.
Of course, sometimes this is intentional manipulation (see my previous post on Vioxx, also from an eye-opening lecture by Madigan). But for the most part it’s not. More likely it’s mostly caused by the human weakness for believing in something because it’s standard practice.
In some sense we knew this already. How many times have we read something about what to do for our health, and then a few years later read the opposite? That’s a bad sign.
And although the ethics are the main thing here, the money is a huge issue. It required $25 million dollars for Madigan and his colleagues to implement the study on how good our current methods are at detecting things we already know. Turns out they are not good at this – even the best methods, which we have no reason to believe are being used, are only okay.
Okay, $25 million dollars is a lot, but then again there are literally billions of dollars being put into the medical trials and research as a whole, so you might think that the “due diligence” of such a large industry would naturally get funded regularly with such sums.
But you’d be wrong. Because there’s no due diligence for this industry, not in a real sense. There’s the FDA, but they are simply not up to the task.
One article I linked to yesterday from the Stanford Alumni Magazine, which talked about the work of John Ioannidis (I blogged about his work here called “Why Most Published Research Findings Are False“), summed the situation up perfectly (emphasis mine):
When it comes to the public’s exposure to biomedical research findings, another frustration for Ioannidis is that “there is nobody whose job it is to frame this correctly.” Journalists pursue stories about cures and progress—or scandals—but they aren’t likely to diligently explain the fine points of clinical trial bias and why a first splashy result may not hold up. Ioannidis believes that mistakes and tough going are at the essence of science. “In science we always start with the possibility that we can be wrong. If we don’t start there, we are just dogmatizing.”
It’s all about conflict of interest, people. The researchers don’t want their methods examined, the pharmaceutical companies are happy to have various ways to prove a new drug “effective”, and the FDA is clueless.
Another reason for an AMS panel to investigate public math models. If this isn’t in the public’s interest I don’t know what is.


