Archive
Data scientists and engineers needed for a weekend datafest exploring money and politics
I just signed up for an upcoming datafest called “Big Data, Big Money, and You” which will be co-hosted at Columbia University and Stanford University on February 2nd and 3rd.
The idea is to use data from:
- GovTrack.us,
- MapLight,
- National Institute on Money in State Politics,
- Open States,
- Pew Research Center,
- ProPublica,
- The Center for Responsive Politics,
- State Integrity, and
- The Sunlight Foundation
and open source tools such as R, python, and various api’s to model and explore various issues in the intersection of money and politics. Among those listed are things like: “look for correlation between the subject of bills introduced to state legislatures to big companies within those districts and campaign donations” and “comparing contributions per and post redistricting”.
As usual, a weekend-long datafest is just the beginning of a good data exploration: if you’re interested in this, think of this as an introduction to the ideas and the people involved; it’s just as much about networking with like-minded people as it is about finding an answer in two days.
So sign up, come on by, and get ready to roll up your sleeves and have a great time for that weekend, but also make sure you get people’s email addresses so you can keep in touch as things continue to develop down the road.
Data Science explained by the media, or: why I might just screw your wife while you’re at work
I wanted to mention two recent articles about data science. The first was in the New York Times, has a crappy title (“Big Data is Great, but Don’t Forget Intuition“), a positive outlook, and interviews skeptics like my co-author Rachel Schutt, who has the last word in the article:
“I don’t worship the machine”
The second article (hat tip Chris Wiggins) was published in Forbes, has a great title (“Data Science: Buyer Beware“), an enormously skeptical outlook, and takes quotes from data science celebrities. From the article:
Thomas Davenport and D.J. Patil’s rather hyperbolic declaration that the “data scientist is the sexiest job of the 21st century” deserves a double dose of skepticism.
These two articles are attempting to do totally different things and they both achieve them pretty well. The first brings up the need for thoughtfulness so that we don’t blindly follow algorithms:
Will Big Data usher in a digital surveillance state, mainly serving corporate interests?
…
Personally, my bigger concern is that the algorithms that are shaping my digital world are too simple-minded, rather than too smart.
The second article brings up the ideas that we’ve been through similar thought and management revolutions before, and trouble lies with anything that is considered the silver bullet. Here’s my favorite part:
…data science tries to create value through an economy of counterfeits:
- False expertise, arising as persons recognized as experts are conversant in methods and tools, and not the underlying business phenomena, thereby relegating subject matter knowledge below methodological knowledge,
- False elites, arising as persons are summarily promoted to high status (viz., “scientist”) without duly earning it or having prerequisite experiences or knowledge: functionaries become elevated to experts, and experts are regarded as gurus,
- False roles, arising as gatekeepers and bureaucrats emerge in order to manage numerous newly created administrative processes associated with data science activities, yet whose contributions to core value, efficiency, or effectiveness are questionable,
- False scarcity, arising as leaders and influencers define the data scientist role so narrowly as to consist of extremely rare, almost implausible combinations of skills, thereby assuring permanent scarcity and consequent overpricing of skills.
For the record, I’d rather define data science by what data scientists get paid to do, which is how we approached the book. Even better if we talk about data scientists as people who work on data science teams, where the “extremely rare, almost implausible combinations of skills” are represented not by one person but by the team as a whole (agreed wholeheartedly that nobody is everything a typical LinkedIn data scientist job description wants).
The only weird part of the second article is the part where writer Ray Rivera draws an analogy between data scientists and “icemen”, the guys who used to bring ice to your house daily before the invention of refrigerators. The idea here is, I guess, that you shouldn’t trust a data scientist to admit when he is not necessary because there’s better technology available, not can you trust a data scientist to invent such technology, nor can you trust a data scientist with your wife.
For whatever reason I get a thrill from the fact that I pose such a sexy threat to Rivera. I’ll end with the poem he quotes:
I don’t want no iceman
I’m gonna get me a Frigidaire …
I don’t want nobody
Who’s always hangin’ around.
The complexity feedback loop of modeling
Yesterday I was interviewed by a tech journalist about the concept of feedback loops in consumer-facing modeling. We ended up talking for a while about the death spiral of modeling, a term I coined for the tendency of certain public-facing models, like credit scoring models, to have such strong effects on people that they arguable create the future rather than forecast it. Of course this is generally presented from the perspective of the winners of this effect, but I care more about who is being forecast to fail.
Another feedback loop that we talked about was one that consumers have basically inheriting from the financial system, namely the “complexity feedback loop”.
In the example she and I discussed, which had to do with consumer-facing financial planning software, the complexity feedback loop refers to the fact that we are urged, as consumers, to keep track of our finances one way or another, including our cash flows, which leads to us worrying that we won’t be able to meet our obligations, which leads to us getting convinced we need to buy some kind of insurance (like overdraft insurance), which in turn has a bunch of complicated conditions on it.
The end result is increased complexity along with an increasing need for a complicated model to keep track of finances – in other words, a feedback loop.
Of course this sounds a lot like what happened in finance, where derivatives were invented to help disperse unwanted risk, but in turn complicated the portfolios so much that nobody understand them anymore, so we have endless discussions about how to measure the risk of the instruments that were created to remove risk.
The complexity feedback loop is generalizable outside of the realm of money as well.
In general models take certain things into account and ignore others, by their nature; models are simplified versions of the world, especially when they involve human behavior. So certain risks, or effects, are sufficiently small that the original model simply doesn’t see them – it may not even collect the data to measure it at all. Sometimes this omission is intentional, sometimes it isn’t.
But once the model is widely used, then the underlying approximation to the world is in some sense assumed, and then the remaining discrepancy is what we need to start modeling: the previously invisible becomes visible, and important. This leads to a second model tacked onto the first, or a modified version of the first. In either case it’s more complicated as it becomes more widely used.
This is not unlike saying that we’ve seen more vegetarian options on menus as restauranteurs realize they are losing out on a subpopulation of diners by ignoring their needs. From this example we can see that the complexity feedback loop can be good or bad, depending on your perspective. I think it’s something we should at least be aware of, as we increasingly interact with and depend on models.
Planning for the robot revolution
Yesterday I read this Wired magazine article about the robot revolution by Kevin Kelly called “Better than Human”. The idea of the article is to make peace with the inevitable robot revolution, and to realize that it’s already happened and that it’s good.
I like this line:
We have preconceptions about how an intelligent robot should look and act, and these can blind us to what is already happening around us. To demand that artificial intelligence be humanlike is the same flawed logic as demanding that artificial flying be birdlike, with flapping wings. Robots will think different. To see how far artificial intelligence has penetrated our lives, we need to shed the idea that they will be humanlike.
True! Let’s stop looking for a Star Trek Data-esque android (although he is very cool according to my 10-year-old during our most recent Star Trek marathon).
Data is very cool
Instead, let’s realize that the typical artificial intelligence we can expect to experience in our lives is the web itself, inasmuch as it is a problem-solving, decision-making system, and our interactions with it through browsing and searching is both how we benefit from artificial intelligence and how it takes us over.
What I can’t accept about the Wired article, though, is the last part, where we should consider it good. But maybe it is only supposed to be good for the Wired audience and I’m asking for too much. My concerns are touched on briefly here:
When robots and automation do our most basic work, making it relatively easy for us to be fed, clothed, and sheltered, then we are free to ask, “What are humans for?”
Here’s the thing: it’s already relatively easy for us to be fed, clothed, and sheltered, but we aren’t doing it. That doesn’t seem to be our goal. So why would it suddenly become our goal because there is increasing automation? Robots won’t change our moral values, as far as I know.
Also, the article obscures economic political reality. First imagines the audience as a land- and robot-owning master:
Imagine you run a small organic farm. Your fleet of worker bots do all the weeding, pest control, and harvesting of produce, as directed by an overseer bot, embodied by a mesh of probes in the soil. One day your task might be to research which variety of heirloom tomato to plant; the next day it might be to update your custom labels. The bots perform everything else that can be measured.
Great, so the landowners will not need any workers at all. But then what about the people who don’t have a job? Oh wait, something magical happens:
Everyone will have access to a personal robot, but simply owning one will not guarantee success. Rather, success will go to those who innovate in the organization, optimization, and customization of the process of getting work done with bots and machines.
Really? Everyone will own a robot? How is that going to work? It doesn’t seem to be a natural progression from our current system. Or maybe they mean like the way people own phones now. But owning a phone doesn’t help you get work done if there’s no work for you to do.
But maybe I’m being too cynical. I’m sure there’s deep thought being put to this question. Oh here, in this part:
I ask Brooks to walk with me through a local McDonald’s and point out the jobs that his kind of robots can replace. He demurs and suggests it might be 30 years before robots will cook for us.
I guess this means we don’t have to worry at all, since 30 years is such a long, long time.
Open data and the emergence of data philanthropy
This is a guest post. Crossposted at aluation.
I’m a bit late to this conversation, but I was reminded by Cathy’s post over the weekend on open data – which most certainly is not a panacea – of my own experience a couple of years ago with a group that is trying hard to do the right thing with open data.
The UN funded a new initiative in 2009 called Global Pulse, with a mandate to explore ways of using Big Data for the rapid identification of emerging crises as well as for crafting more effective development policy in general. Their working hypothesis at its most simple is that the digital traces individuals leave in their electronic life – whether through purchases, mobile phone activity, social media or other sources – can reveal emergent patterns that can help target policy responses. The group’s website is worth a visit for anyone interested in non-commercial applications of data science – they are absolutely the good guys here, doing the kind of work that embodies the social welfare promise of Big Data.
With that said, I think some observations about their experience in developing their research projects may shed some light on one of Cathy’s two main points from her post:
- How “open” is open data when there are significant differences in both the ability to access the data, and more important, in the ability to analyze it?
- How can we build in appropriate safeguards rather than just focusing on the benefits and doing general hand-waving about the risks?
I’ll focus on Cathy’s first question here since the second gets into areas beyond my pay grade.
The Global Pulse approach to both sourcing and data analytics has been to rely heavily on partnerships with academia and the private sector. To Cathy’s point above, this is true of both closed data projects (such as those that rely on mobile phone data) as well as open data projects (those that rely on blog posts, news sites and other sources). To take one example, the group partnered with two firms in Cambridge to build a real-time indicator of bread prices in Latin America in order. The data in this case was open, while the web-scraping analytics (generally using grocery-story website prices) were developed and controlled by the vendors. As someone who is very interested in food prices, I found their work fascinating. But I also found it unsettling that the only way to make sense of this open data – to turn it into information, in other words – was through the good will of a private company.
The same pattern of open data and closed analytics characterized another project, which tracked Twitter in Indonesia for signals of social distress around food, fuel prices, health and other issues. The project used publicly available Twitter data, so it was open to that extent, though the sheer volume of data and the analytical challenges of teasing meaningful patterns out of it called for a powerful engine. As we all know, web-based consumer analytics are far ahead of the rest of the world in terms of this kind of work. And that was precisely where Global Pulse rationally turned – to a company that has generally focused on analyzing social media on behalf of advertisers.
Does this make them evil? Of course not – as I said above, Global Pulse are the good guys here. My point is not about the nature of their work but about its fragility.
The group’s Director framed their approach this way in a recent blog post:
We are asking companies to consider a new kind of CSR – call it “data philanthropy.” Join us in our efforts by making anonymized data sets available for analysis, by underwriting technology and research projects, or by funding our ongoing efforts in Pulse Labs. The same technologies, tools and analysis that power companies’ efforts to refine the products they sell, could also help make sure their customers are continuing to improve their social and economic wellbeing. We are asking governments to support our efforts because data analytics can help the United Nations become more agile in understanding the needs of and supporting the most vulnerable populations around the globe, which in terms boosts the global economy, benefiting people everywhere.
What happens when corporate donors are no longer willing to be data philanthropists? And a question for Cathy – how can we ensure that these new Data Science programs like the one at Columbia don’t end up just feeding people into consumer analytics firms, in the same way that math and econ programs ended up feeding people into Wall Street jobs?
I don’t have any answers here, and would be skeptical of anyone who claimed to. But the answers to these questions will likely define a lot of the gap between the promise of open data and whatever it ends up becoming.
I totally trust experts, actually
I lied yesterday, as a friend at my Occupy meeting pointed out to me last night.
I made it seem like I look into every model before trusting it, and of course that’s not true. I eat food grown and prepared by other people daily. I go on airplanes and buses all the time, trusting that they will work and that they will be driven safely. I still have my money in a bank, and I also hire an accountant and sign my tax forms without reading them. So I’m a hypocrite, big-time.
There’s another thing I should clear up: I’m not claiming I understand everything about climate research just because I talked to an expert for 2 or 3 hours. I am certainly not an expert, nor am I planning to become one. Even so, I did learn a lot, and the research I undertook was incredibly useful to me.
So, for example, my father is a climate change denier, and I have heard him give a list of scientific facts to argue against climate change. I asked my expert to counter-argue these points, and he did so. I also asked him to explain the underlying model at a high level, which he did.
My conclusion wasn’t that I’ve looked carefully into the model and it’s right, because that’s not possible in such a short time. My conclusion was that this guy is trustworthy and uses logical argument, which he’s happy to share with interested people, and moreover he manages to defend against deniers without being intellectually defensive. In the end, I’m trusting him, an expert.
On the other hand, if I met another person with a totally different conclusion, who also impressed me as intellectually honest and curious, then I’d definitely listen to that guy too, and I’d be willing to change my mind.
So I do imbue models and theories with a limited amount of trust depending on how much sense they makes to me. I think that’s reasonable, and it’s in line with my advocacy of scientific interpreters. Obviously not all scientific interpreters would be telling the same story, but that’s not important – in fact it’s vital that they don’t, because it is a privilege to be allowed to listen to the different sides and be engaged in the debate.
If I sat down with an expert for a whole day, like my friend Jordan suggests, to determine if they were “right” on an issue where there’s argument among experts, then I’d fail, but even understanding what they were arguing about would be worthwhile and educational.
Let me say this another way: experts argue about what they don’t agree on, of course, since it would be silly for them to talk about what they do agree on. But it’s their commonality that we, the laypeople, are missing. And that commonality is often so well understood that we could understand it rather quickly if it was willingly explained to us. That would be a huge step.
So I wasn’t lying after all, if I am allowed to define the “it” that I did get at in the two hours with an expert. When I say I understood it, I didn’t mean everything, I meant a much larger chunk of the approach and method than I’d had before, and enough to evoke (limited) trust.
Something I haven’t addressed, which I need to think about more (please help!), is the question of what subjects require active skepticism. On of my commenters, Paul Stevens, brought this up:
… For me, lay people means John Q Public – public opinion because public opinion can shape policy. In practice, this only matters for a select few issues, such as climate change or science education. There is no impact to a lay person not understanding / believing in the Higgs particle for example.
On trusting experts, climate change research, and scientific translators
Stephanie Tai has written a thoughtful response on Jordan Ellenberg’s blog to my discussion with Jordan regarding trusting experts (see my Nate Silver post and the follow-up post for more context).
Trusting experts
Stephanie asks three important questions about trusting experts, which I paraphrase here:
- What does it take to look into a model yourself? How deeply must you probe?
- How do you avoid being manipulated when you do so?
- Why should we bother since stuff is so hard and we each have a limited amount of time?
I must confess I find the first two questions really interesting and I want to think about them, but I have a very little patience with the last question.
Here’s why:
- I’ve seen too many people (individual modelers) intentionally deflect investigations into models by setting them up as so hard that it’s not worth it (or at least it seems not worth it). They use buzz words and make it seem like there’s a magical layer of their model which makes it too difficult for mere mortals. But my experience (as an arrogant, provocative, and relentless questioner) is that I can always understand a given model if I’m talking to someone who really understands it and actually wants to communicate it.
- It smacks of an excuse rather than a reason. If it’s our responsibility to understand something, then by golly we should do it, even if it’s hard.
- Too many things are left up to people whose intentions are not reasonable using this “too hard” argument, and it gives those people reason to make entire systems seem too difficult to penetrate. For a great example, see the financial system, which is consistently too complicated for regulators to properly regulate.
I’m sure I seem unbelievably cynical here, but that’s where I got by working in finance, where I saw first-hand how manipulative and manipulated mathematical modeling can become. And there’s no reason at all such machinations wouldn’t translate to the world of big data or climate modeling.
Climate research
Speaking of climate modeling: first, it annoys me that people are using my “distrust the experts” line to be cast doubt on climate modelers.
People: I’m not asking you to simply be skeptical, I’m saying you should look into the models yourself! It’s the difference between sitting on a couch and pointing at a football game on TV and complaining about a missed play and getting on the football field yourself and trying to figure out how to throw the ball. The first is entertainment but not valuable to anyone but yourself. You are only adding to the discussion if you invest actual thoughtful work into the matter.
To that end, I invited an expert climate researcher to my house and asked him to explain the climate models to me and my husband, and although I’m not particularly skeptical of climate change research (more on that below when I compare incentives of the two sides), I asked obnoxious, relentless questions about the model until I was satisfied. And now I am satisfied. I am considering writing it up as a post.
As an aside, if climate researchers are annoyed by the skepticism, I can understand that, since football fans are an obnoxious group, but they should not get annoyed by people who want to actually do the work to understand the underlying models.
Another thing about climate research. People keep talking about incentives, and yes I agree wholeheartedly that we should follow the incentives to understand where manipulation might be taking place. But when I followed the incentives with respect to climate modeling, they bring me straight to climate change deniers, not to researchers.
Do we really think these scientists working with their research grants have more at stake than multi-billion dollar international companies who are trying to ignore the effect of their polluting factories on the environment? People, please. The bulk of the incentives are definitely with the business owners. Which is not to say there are no incentives on the other side, since everyone always wants to feel like their research is meaningful, but let’s get real.
Scientific translators
I like this idea Stephanie comes up with:
Some sociologists of science suggest that translational “experts”–that is, “experts” who aren’t necessarily producing new information and research, but instead are “expert” enough to communicate stuff to those not trained in the area–can help bridge this divide without requiring everyone to become “experts” themselves. But that can also raise the question of whether these translational experts have hidden agendas in some way. Moreover, one can also raise questions of whether a partial understanding of the model might in some instances be more misleading than not looking into the model at all–examples of that could be the various challenges to evolution based on fairly minor examples that when fully contextualized seem minor but may pop out to someone who is doing a less systematic inquiry.
First, I attempt to make my blog something like a platform for this, and I also do my best to make my agenda not at all hidden so people don’t have to worry about that.
This raises a few issues for me:
- Right now we depend mostly on press to do our translations, but they aren’t typically trained as scientists. Does that make them more prone to being manipulated? I think it does.
- How do we encourage more translational expertise to emerge from actual experts? Currently, in academia, the translation to the general public of one’s research is not at all encouraged or rewarded, and outside academia even less so.
- Like Stephanie, I worry about hidden agendas and partial understandings, but I honestly think they are secondary to getting a robust system of translation started to begin with, which would hopefully in turn engage the general public with the scientific method and current scientific knowledge. In other words, the good outweighs the bad here.
Open data is not a panacea
I’ve talked a lot recently about how there’s an information war currently being waged on consumers by companies that troll the internet and collect personal data, search histories, and other “attributes” in data warehouses which then gets sold to the highest bidders.
It’s natural to want to balance out this information asymmetry somehow. One such approach is open data, defined in Wikipedia as the idea that certain data should be freely available to everyone to use and republish as they wish, without restrictions from copyright, patents or other mechanisms of control.
I’m going to need more than one blog post to think this through, but I wanted to make two points this morning.
The first is my issue with the phrase “freely available to everyone to use”. What does that mean? Having worked in futures trading, where we put trading machines and algorithms in close proximity with exchanges for large fees so we can get to the market data a few nanoseconds before anyone else, it’s clear to me that availability and access to data is an incredibly complicated issue.
And it’s not just about speed. You can have hugely important, rich, and large data sets sitting in a lump on a publicly available website like wikipedia, and if you don’t have fancy parsing tools and algorithms you’re not going to be able to make use of it.
When important data goes public, the edge goes to the most sophisticated data engineer, not the general public. The Goldman Sachs’s of the world will always know how to make use of “freely available to everyone” data before the average guy.
Which brings me to my second point about open data. It’s general wisdom that we should hope for the best but prepare for the worst. My feeling is that as we move towards open data we are doing plenty of the hoping part but not enough of the preparing part.
If there’s one thing I learned working in finance, it’s not to be naive about how information will be used. You’ve got to learn to think like an asshole to really see what to worry about. It’s a skill which I don’t regret having.
So, if you’re giving me information on where public schools need help, I’m going to imagine using that information to cut off credit for people who live nearby. If you tell me where environmental complaints are being served, I’m going to draw a map and see where they aren’t being served so I can take my questionable business practices there.
I’m not saying proponents of open data aren’t well-meaning, they often seem to be. And I’m not saying that the bad outweighs the good, because I’m not sure. But it’s something we should figure out how to measure, and in this information war it’s something we should keep a careful eye on.
Consumer segmentation taken to the extreme
I’m up in Western Massachusetts with the family, hidden off in a hotel with a pool and a nearby yarn superstore. My blogging may be spotty for the next few days but rest assured I haven’t forgotten about mathbabe (or Aunt Pythia).
I have just enough time this morning to pose a thought experiment. It’s in three steps. First, read this Reuters article which ends with:
Imagine if Starbucks knew my order as I was pulling into the parking lot, and it was ready the second I walked in. Or better yet, if a barista could automatically run it out to my car the exact second I pulled up. I may not pay more for that everyday, but I sure as hell would if I were late to a meeting with a screaming baby in the car. A lot more. Imagine if my neighborhood restaurants knew my local, big-tipping self was the one who wanted a reservation at 8 pm, not just an anonymous user on OpenTable. They might find some room. And odds are, I’d tip much bigger to make sure I got the preferential treatment the next time. This is why Uber’s surge pricing is genius when it’s not gouging victims of a natural disaster. There are select times when I’ll pay double for a cab. Simply allowing me to do so makes everyone happy.
In a world where the computer knows where we are and who we are and can seamlessly charge us, the world might get more expensive. But it could also get a whole lot less annoying. ”This is what big data means to me,” Rosensweig says.
Second, think about just how not “everyone” is happy. It’s a pet peeve of mine that people who like their personal business plan consistently insist that everybody wins, when clearly there are often people (usually invisible) who are definitely losing. In this case the losers are people whose online personas don’t correlate (in a given model) with big tips. Should those people not be able to reserve a table at a restaurant now? How is that model going to work?
And now I’ve gotten into the third step. It used to be true that if you went to a restaurant enough, the chef and the waitstaff would get to know you and might even keep a table open for you. It was old-school personalization.
What if that really did start to happen at every restaurant and store automatically, based on your online persona? On the one hand, how weird would that be, and on the other hand how quickly would we all get used to it? And what would that mean for understanding each other’s perspectives?
Whom can you trust?
My friend Jordan has written a response to yesterday’s post about Nate Silver. He is a major fan of Silver and contends that I’m not fair to him:
I think Cathy’s distrust is warranted, but I think Silver shares it. The central concern of his chapter on weather prediction is the vast difference in accuracy between federal hurricane forecasters, whose only job is to get the hurricane track right, and TV meteorologists, whose very different incentive structure leads them to get the weather wrong on purpose. He’s just as hard on political pundits and their terrible, terrible predictions, which are designed to be interesting, not correct.
To this I’d say, Silver mocks TV meteorologists and political pundits in a dismissive way, as not being scientific enough. That’s not the same as taking them seriously and understanding their incentives, and it doesn’t translate to the much more complicated world of finance.
In any case, he could have understood incentives in every field except finance and I’d still be mad, because my direct experience with finance made me understand it, and the outsized effect it has on our economy makes it hugely important.
But Jordan brings up an important question about trust:
But what do you do with cases like finance, where the only people with deep domain knowledge are the ones whose incentive structure is socially suboptimal? (Cathy would use saltier language here.) I guess you have to count on mavericks like Cathy, who’ve developed the domain knowledge by working in the financial industry, but who are now separated from the incentives that bind the insiders.
But why do I trust what Cathy says about finance?
Because she’s an expert.
Is Cathy OK with this?
No, Cathy isn’t okay with this. The trust problem is huge, and I address it directly in my post:
This raises a larger question: how can the public possibly sort through all the noise that celebrity-minded data people like Nate Silver hand to them on a silver platter? Whose job is it to push back against rubbish disguised as authoritative scientific theory?
It’s not a new question, since PR men disguising themselves as scientists have been around for decades. But I’d argue it’s a question that is increasingly urgent considering how much of our lives are becoming modeled. It would be great if substantive data scientists had a way of getting together to defend the subject against sensationalist celebrity-fueled noise.
One hope I nurture is that, with the opening of the various data science institutes such as the one at Columbia which was a announced a few months ago, there will be a way to form exactly such a committee. Can we get a little peer review here, people?
I do think domain-expertise-based peer review will help, but not when the entire field is captured, like in some subfields of medical research and in some subfields of economics and finance (for a great example see Glen Hubbard get destroyed in Matt Taibbi’s recent blogpost for selling his economic research).
The truth is, some fields are so yucky that people who want to do serious research just leave because they are disgusted. Then the people who remain are the “experts”, and you can’t trust them.
The toughest part is that you don’t know which fields are like this until you try to work inside them.
Bottomline: I’m telling you not to trust Nate Silver, and I would also urge you not to trust any one person, including me. For that matter don’t necessarily trust crowds of people either. Instead, carry a healthy dose of skepticism and ask hard questions.
This is asking a lot, and will get harder as time goes on and as the world becomes more complicated. On the one hand, we need increased transparency for scientific claims like projects such as runmycode provide. On the other, we need to understand the incentive structure inside a field like finance to make sure it is aligned with its stated mission.
When accurate modeling is not good
I liked Andrew Gelman’s recent post (hat tip Suresh Naidu) about predatory modeling going on in casinos, specifically Caesars in Iowa. The title of the post is already good, and is a riff on Caesars Entertainment CEO Gary Loveman said:
There are four ways to get fired from Caesars: (1) theft, (2) sexual harassment, (3) running an experiment without a control group, and (4) keeping a gambling addict away from the casino
He tells a story about a woman who loses lots of money at the casino, but who moreover gets manipulated to come back and lose more and more based on the data the people collected at Caesars and based on the models built by the quants there. You should read the whole thing, which as usual with Gelman is quirky and fun. His main point comes here (emphasis mine):
The Caesars case (I keep wanting to write Caesar’s but apparently no, it’s Caesars, just like Starbucks) interested me because of the role of statistics. I’m used to thinking of probability and statistics as a positive social force (helping medical research or, in earlier days, helping the allies in World War 2), or mildly positive (for example, helping design measures to better evaluate employees), or maybe neutral (exotic financial instruments which serve no redeeming social value but presumably don’t do much harm) or moderately negative (“Moneyball”-style strategies such as going for slow sluggers who foul off endless pitches and walk a lot; it may win games but it makes for boring baseball). And then there are statisticians who do fishy analyses, for example trying to hide that some drug causes damage so it can stay on the market. But that’s a bit different because such a statistical analysis, no matter how crafty, is inherently a bad analysis, trying to obscure rather than learn.
The Caesars case seems different, in that there is a very direct tradeoff: the better the statistics and the better the science, the worse the human outcomes. These guys are directly optimizing their ability to ruin some people’s lives.
It’s not the only one, but they are not usually this clear-cut.
It’s time we started scoring models on various dimensions. Accuracy is one, predatoriness is another. They’re distinct.
Fighting the information war (but only on behalf of rich people)
There’s an information war out there which we have to be prepared for. Actually there a few of them.
And according to this New York Times piece, there’s now a way to fight against the machine, for a fee. Companies like Reputation.com will try to scour the web and remove data you don’t want floating around about you, and when that’s impossible they’ll flood the web with other good data to balance out the bad stuff.
At least that’s what I’m assuming they do, because they of course don’t really explain their techniques. And that’s the other information war, where they scare rich people with technical sounding jargon and tell them unlikely stories to get their money.
I’m not claiming predatory information-gatherers aren’t out there. But this is the wrong way to deal with it.
First of all, most of the data out there systematically being used for nefarious purposes, at least in this country, is used against the poor, denying them reasonable terms on their loans and other services. So the idea that people will need to pay for a service to protect their information is weird. It’s like saying the air quality is bad for poor people, so let’s charge rich people for better air.
So what kind of help is Reputation.com actually providing? Here’s my best guess.
First it targets people to get overly scared in the spirit of this recent BusinessWeek article, which explains that cosmetic companies have gone to China and started a campaign to convince Chinese women they are too hairy so they’ll start buying products to remove hair. From that article, which is guaranteed to make you understand something about American beauty culture too:
Despite such plays on women’s fears of embarrassment, Reckitt Benckiser’s Sehgal says that Chinese women are too “independent-minded” to be coaxed into using a product they don’t really need. Others aren’t so sure. Veet’s Chinese marketing “plays a role that is very similar to that of the apple in the Bible,” says Benjamin Voyer, a social psychologist and assistant professor of marketing at ESCP Europe business school. “It creates an awareness, which subsequently creates a feeling of shame and need.”
Second, Reputation.com gets their clients off nuisance lists, like the modern version of a do-not-call program (which, importantly, is run by the government). This is probably equivalent to setting up a bunch of email filters and clearing their cookies every now and then, but they can’t tell their clients that.
Finally, for those rich people who are also super vain, they will try to do things like replace the unflattering photos of them that come up in a google image search with better-looking ones they choose. Things like that, image issues.
I just want to point out one more salient fact about Reputation.com. It’s not just in their interest to scare-monger, it’s actually in their interest to make the data warehouses more complete (they have themselves amassed an enormous database on people), and to have people who don’t pay for their services actually need their services more. They could well create a problem to produce a market for their product.
What drives me nuts about this is how elitist it is.
There are very real problems in the information-gathering space, and we need to address them, but one of the most important issues is that the very people who can’t afford to pay for their reputation to be kept clean are the real victims of the system.
There is literally nobody who will make good money off of actually solving this problem: I challenge any libertarian to explain how the free market will address this. It has to be addressed through policy, and specifically through legislating what can and cannot be done with personal data.
Probably the worst part is that, through using the services from companies Reputation.com and because of the nature of the personalization of internet usage, the very legislators who need to act on behalf of their most vulnerable citizens won’t even see the problem since they don’t share it.
Columbia Data Science course, week 14: Presentations
In the final week of Rachel Schutt’s Columbia Data Science course we heard from two groups of students as well as from Rachel herself.
Data Science; class consciousness
The first team of presenters consisted of Yegor, Eurry, and Adam. Many others whose names I didn’t write down contributed to the research, visualization, and writing.
First they showed us the very cool graphic explaining how self-reported skills vary by discipline. The data they used came from the class itself, which did this exercise on the first day:

so the star in the middle is the average for the whole class, and each star along the side corresponds to the average (self-reported) skills of people within a specific discipline. The dotted lines on the outside stars shows the “average” star, so it’s easier to see how things vary per discipline compared to the average.
Surprises: Business people seem to think they’re really great at everything except communication. Journalists are better at data wrangling than engineers.
We will get back to the accuracy of self-reported skills later.
We were asked, do you see your reflection in your star?
Also, take a look at the different stars. How would you use them to build a data science team? Would you want people who are good at different skills? Is it enough to have all the skills covered? Are there complementary skills? Are the skills additive, or do you need overlapping skills among team members?
Thought Experiment
If all data which had ever been collected were freely available to everyone, would we be better off?
Some ideas were offered:
- all nude photos are included. [Mathbabe interjects: it’s possible to not let people take nude pics of you. Just sayin’.]
- so are passwords, credit scores, etc.
- how do we make secure transactions between a person and her bank considering this?
- what does it mean to be “freely available” anyway?
The data of power; the power of data
You see a lot of people posting crap like this on Facebook:

But here’s the thing: the Berner Convention doesn’t exist. People are posting this to their walls because they care about their privacy. People think they can exercise control over their data but they can’t. Stuff like this give one a false sense of security.
In Europe the privacy laws are stricter, and you can request data from Irish Facebook and they’re supposed to do it, but it’s still not easy to successfully do.
And it’s not just data that’s being collected about you – it’s data you’re collecting. As scientists we have to be careful about what we create, and take responsibility for our creations.
As Francois Rabelais said,
Wisdom entereth not into a malicious mind, and science without conscience is but the ruin of the soul.

Or as Emily Bell from Columbia said,
Every algorithm is editorial.

We can’t be evil during the day and take it back at hackathons at night. Just as journalists need to be aware that the way they report stories has consequences, so do data scientists. As a data scientist one has impact on people’s lives and how they think.
Here are some takeaways from the course:
- We’ve gained significant powers in this course.
- In the future we may have the opportunity to do more.
- With data power comes data responsibility.
Who does data science empower?
The second presentation was given by Jed and Mike. Again, they had a bunch of people on their team helping out.
Thought experiment
Let’s start with a quote:
“Anything which uses science as part of its name isn’t political science, creation science, computer science.”
– Hal Abelson, MIT CS prof
Keeping this in mind, if you could re-label data science, would you? What would you call it?
Some comments from the audience:
- Let’s call it “modellurgy,” the craft of beating mathematical models into shape instead of metal
- Let’s call it “statistics”
Does it really matter what data science is? What should it end up being?
Chris Wiggins from Columbia contends there are two main views of what data science should end up being. The first stems from John Tukey, inventor of the fast fourier transform and the box plot, and father of exploratory data analysis. Tukey advocated for a style of research he called “data analysis”, emphasizing the primacy of data and therefore computation, which he saw as part of statistics. His descriptions of data analysis, which he saw as part of doing statistics, are very similar to what people call data science today.
The other prespective comes from Jim Gray, Computer Scientist from Microsoft. He saw the scientific ideals of the enlightenment age as expanding and evolving. We’ve gone from the theories of Darwin and Newton to experimental and computational approaches of Turing. Now we have a new science, a data-driven paradigm. It’s actually the fourth paradigm of all the sciences, the first three being experimental, theoretical, and computational. See more about this here.
Wait, can data science be both?

Note it’s difficult to stick Computer Science and Data Science on this line.
Statistics is a tool that everyone uses. Data science also could be seen that way, as a tool rather than a science.
Who does data science?
Here’s a graphic showing the make-up of Kaggle competitors. Teams of students collaborated to collect, wrangle, analyze and visualize this data:

The size of the blocks correspond to how many people in active competitions have an education background in a given field. We see that almost a quarter of competitors are computer scientists. The shading corresponds to how often they compete. So we see the business finance people do more competitions on average than the computer science people.
Consider this: the only people doing math competitions are math people. If you think about it, it’s kind of amazing how many different backgrounds are represented above.
We got some cool graphics created by the students who collaborated to get the data, process it, visualize it and so on.
Which universities offer courses on Data Science?

There will be 26 universities in total by 2013 that offer data science courses. The balls are centered at the center of gravity of a given state, and the balls are bigger if there are more in that state.
Where are data science jobs available?

Observations:
- We see more professional schools offering data science courses on the west coast.
- It would also would be interesting to see this corrected for population size.
- Only two states had no jobs.
- Massachusetts #1 per capita, then Maryland
Crossroads
McKinsey says there will be hundreds of thousands of data science jobs in the next few years. There’s a massive demand in any case. Some of us will be part of that. It’s up to us to make sure what we’re doing is really data science, rather than validating previously held beliefs.
We need to advance human knowledge if we want to take the word “scientist” seriously.
How did this class empower you?
You are one of the first people to take a data science class. There’s something powerful there.
Thank you Rachel!

Last Day of Columbia Data Science Class, What just happened? from Rachel’s perspective
Recall the stated goals of this class were:
- learn about what it’s like to be a data scientists
- be able to do some of what a data scientist does
Hey we did this! Think of all the guest lectures; they taught you a lot of what it’s like to be a data scientist, which was goal 1. Here’s what I wanted you guys to learn before the class started based on what a data scientist does, and you’ve learned a lot of that, which was goal 2:

Mission accomplished! Mission accomplished?
Thought experiment that I gave to myself last Spring
How would you design a data science class?
Comments I made to myself:
- It’s not a well-defined body of knowledge, subject, no textbook!
- It’s popularized and celebrated in the press and media, but there’s no “authority” to push back
- I’m intellectually disturbed by idea of teaching a course when the body of knowledge is ill-defined
- I didn’t know who would show up, and what their backgrounds and motivations would be
- Could it become redundant with a machine learning class?
My process
I asked questions of myself and from other people. I gathered information, and endured existential angst about data science not being a “real thing.” I needed to give it structure.
Then I started to think about it this way: while I recognize that data science has the potential to be a deep research area, it’s not there yet, and in order to actually design a class, let’s take a pragmatic approach: Recognize that data science exists. After all, there are jobs out there. I want to help students to be qualified for them. So let me teach them what it takes to get those jobs. That’s how I decided to approach it.
In other words, from this perspective, data science is what data scientists do. So it’s back to the list of what data scientists do. I needed to find structure on top of that, so the structure I used as a starting point were the data scientist profiles.
Data scientist profiles
This was a way to think about your strengths and weaknesses, as well as a link between speakers. Note it’s easy to focus on “technical skills,” but it can also be problematic in being too skills-based, as well as being problematic because it has no scale, and no notion of expertise. On the other hand it’s good in that it allows for and captures variability among data scientists.
I assigned weekly guest speakers topics related to their strengths. We held lectures, labs, and (optional) problem sessions. From this you got mad skillz:
- programming in R
- some python
- you learned some best practices about coding
From the perspective of machine learning,
- you know a bunch of algorithms like linear regression, logistic regression, k-nearest neighbors, k-mean, naive Bayes, random forests,
- you know what they are, what they’re used for, and how to implement them
- you learned machine learning concepts like training sets, test sets, over-fitting, bias-variance tradeoff, evaluation metrics, feature selection, supervised vs. unsupervised learning
- you learned about recommendation systems
- you’ve entered a Kaggle competition
Importantly, you now know that if there is an algorithm and model that you don’t know, you can (and will) look it up and figure it out. I’m pretty sure you’ve all improved relative to how you started.
You’ve learned some data viz by taking flowing data tutorials.
You’ve learned statistical inference, because we discussed
- observational studies,
- causal inference, and
- experimental design.
- We also learned some maximum likelihood topics, but I’d urge you to take more stats classes.
In the realm of data engineering,
- we showed you map reduce and hadoop
- we worked with 30 separate shards
- we used an api to get data
- we spent time cleaning data
- we’ve processed different kinds of data
As for communication,
- you wrote thoughts in response to blog posts
- you observed how different data scientists communicate or present themselves, and have different styles
- your final project required communicating among each other
As for domain knowledge,
- lots of examples were shown to you: social networks, advertising, finance, pharma, recommender systems, dallas art museum
I heard people have been asking the following: why didn’t we see more data science coming from non-profits, governments, and universities? Note that data science, the term, was born in for-profits. But the truth is I’d also like to see more of that. It’s up to you guys to go get that done!
How do I measure the impact of this class I’ve created? Is it possible to incubate awesome data science teams in the classroom? I might have taken you from point A to point B but you might have gone there anyway without me. There’s no counterfactual!
Can we set this up as a data science problem? Can we use a causal modeling approach? This would require finding students who were more or less like you but didn’t take this class and use propensity score matching. It’s not a very well-defined experiment.
But the goal is important: in industry they say you can’t learn data science in a university, that it has to be on the job. But maybe that’s wrong, and maybe this class has proved that.
What has been the impact on you or to the outside world? I feel we have been contributing to the broader discourse.
Does it matter if there was impact? and does it matter if it can be measured or not? Let me switch gears.
What is data science again?
Data science could be defined as:
- A set of best practices used in tech companies, which is how I chose to design the course
- A space of problems that could be solved with data
- A science of data where you can think of the data itself as units
The bottom two have the potential to be the basis of a rich and deep research discipline, but in many cases, the way the term is currently used is:
- Pure hype
But it doesn’t matter how we define it, as much as that I want for you:
- to be problem solvers
- to be question askers
- to think about your process
- to use data responsibly and make the world better, not worse.
More on being problem solvers: cultivate certain habits of mind
Here’s a possible list of things to strive for, taken from here:

Here’s the thing. Tons of people can implement k-nearest neighbors, and many do it badly. What matters is that you cultivate the above habits, remain open to continuous learning.
In education in traditional settings, we focus on answers. But what we probably should focus on is how a student behaves when they don’t know the answer. We need to have qualities that help us find the answer.
Thought experiment
How would you design a data science class around habits of mind rather than technical skills? How would you quantify it? How would you evaluate? What would students be able to write on their resumes?
Comments from the students:
- You’d need to keep making people doing stuff they don’t know how to do while keeping them excited about it.
- have people do stuff in their own domains so we keep up wonderment and awe.
- You’d use case studies across industries to see how things work in different contexts
More on being question-askers
Some suggestions on asking questions of others:
- start with assumption that you’re smart
- don’t assume the person you’re talking to knows more or less. You’re not trying to prove anything.
- be curious like a child, not worried about appearing stupid
- ask for clarification around notation or terminology
- ask for clarification around process: where did this data come from? how will it be used? why is this the right data to use? who is going to do what? how will we work together?
Some questions to ask yourself
- does it have to be this way?
- what is the problem?
- how can I measure this?
- what is the appropriate algorithm?
- how will I evaluate this?
- do I have the skills to do this?
- how can I learn to do this?
- who can I work with? Who can I ask?
- how will it impact the real world?
Data Science Processes
In addition to being problem-solvers and question-askers, I mentioned that I want you to think about process. Here are a couple processes we discussed in this course:
(1) Real World –> Generates Data –>
–> Collect Data –> Clean, Munge (90% of your time)
–> Exploratory Data Analysis –>
–> Feature Selection –>
–> Build Model, Build Algorithm, Visualize
–> Evaluate –>Iterate–>
–> Impact Real World
(2) Asking questions of yourselves and others –>
Identifying problems that need to be solved –>
Gathering information, Measuring –>
Learning to find structure in unstructured situations–>
Framing Problem –>
Creating Solutions –> Evaluating
Thought experiment
Come up with a business that improves the world and makes money and uses data
Comments from the students:
- autonomous self-driving cars you order with a smart phone
- find all the info on people and then show them how to make it private
- social network with no logs and no data retention
10 Important Data Science Ideas
Of all the blog posts I wrote this semester, here’s one I think is important:
10 Important Data Science Ideas
Confidence and Uncertainty
Let’s talk about confidence and uncertainty from a couple perspectives.
First, remember that statistical inference is extracting information from data, estimating, modeling, explaining but also quantifying uncertainty. Data Scientists could benefit from understanding this more. Learn more statistics and read Ben’s blog post on the subject.
Second, we have the Dunning-Kruger Effect.
Have you ever wondered why don’t people say “I don’t know” when they don’t know something? This is partly explained through an unconscious bias called the Dunning-Kruger effect.
Basically, people who are bad at something have no idea that they are bad at it and overestimate their confidence. People who are super good at something underestimate their mastery of it. Actual competence may weaken self-confidence.
Thought experiment
Design an app to combat the dunning-kruger effect.
Optimizing your life, Career Advice
What are you optimizing for? What do you value?
- money, need some minimum to live at the standard of living you want to, might even want a lot.
- time with loved ones and friends
- doing good in the world
- personal fulfillment, intellectual fulfillment
- goals you want to reach or achieve
- being famous, respected, acknowledged
- ?
- some weighted function of all of the above. what are the weights?
What constraints are you under?
- external factors (factors outside of your control)
- your resources: money, time, obligations
- who you are, your education, strengths & weaknesses
- things you can or cannot change about yourself
There are many possible solutions that optimize what you value and take into account the constraints you’re under.
So what should you do with your life?
Remember that whatever you decide to do is not permanent so don’t feel too anxious about it, you can always do something else later –people change jobs all the time
But on the other hand, life is short, so always try to be moving in the right direction (optimizing for what you care about).
If you feel your way of thinking or perspective is somehow different than what those around you are thinking, then embrace and explore that, you might be onto something.
I’m always happy to talk to you about your individual case.
Next Gen Data Scientists
The second blog post I think is important is this “manifesto” that I wrote:
Next-Gen Data Scientists. That’s you! Go out and do awesome things, use data to solve problems, have integrity and humility.
Here’s our class photo!

How math departments hire faculty
I just got back from a stimulating trip to Stony Brook to give the math colloquium there. I had a great time thanks to my gracious host Jason Starr (this guy, not this guy), and besides giving my talk (which I will give again in San Diego at the joint meetings next month) I enjoyed two conversations about the field of math which I think could be turned into data science projects. Maybe Ph.D. theses or something.
First, a system for deciding whether a paper on the arXiv is “good.” I will post about that on another day because it’s actually pretty involved and possible important.
Second is the way people hire in math departments. This conversation will generalize to other departments, some more than others.
So first of all, I want to think about how the hiring process actually works. There are people who look at folders of applicants, say for tenure-track jobs. Since math is a pretty disjointed field, a majority of the folders will only be understood well enough for evaluation purposes by a few people in the department.
So in other words, the department naturally splits into clusters more or less along field lines: there are the number theorists and then there are the algebraic geometers and then there are the low-dimensional topologists, say.
Each group of people reads the folders from the field or fields that they have enough expertise in to understand. Then from among those they choose some they want to go to bat for. It becomes a political battle, where each group tries to convince the other groups that their candidates are more qualified. But of course it’s really hard to know who’s telling the honest truth. There are probably lots of biases in play too, so people could be overstating their cases unconsciously.
Some potential problems with this system:
- if you are applying to a department where nobody is in your field, nobody will read your folder, and nobody will go to bat for you, even if you are really great. An exaggeration but kinda true.
- in order to be convincing that “your guy is the best applicant,” people use things like who the advisor is or which grad school this person went to more than the underlying mathematical content.
- if your department grows over time, this tends to mean that you get bigger clusters rather than more clusters. So if you never had a number theorist, you tend to never get one, even if you get more positions. This is a problem for grad students who want to become number theorists, but that probably isn’t enough to affect the politics of hiring.
So here’s my data science plan: test the above hypotheses. I said them because I think they are probably true, but it would be not be impossible to create the dataset to test them thoroughly and measure the effects.
The easiest and most direct one to test is the third: cluster departments by subject by linking the people with their published or arXiv’ed papers. Watch the department change over time and see how the clusters change and grow versus how it might happen randomly. Easy peasy lemon squeazy if you have lots of data. Start collecting it now!
The first two are harder but could be related to the project of ranking papers. In other words, you have to define “is really great” to do this. It won’t mean you can say with confidence that X should have gotten a job at University Y, but it would mean you could say that if X’s subject isn’t represented in University Y’s clusters, then X’s chances of getting a job there, all other things being equal, is diminished by Z% on average. Something like that.
There are of course good things about the clustering. For example, it’s not that much fun to be the only person representing a field in your department. I’m not actually passing judgment on this fact, and I’m also not suggesting a way to avoid it (if it should be avoided).
How do we quantitatively foster leadership?
I was really impressed with yesterday’s Tedx Women at Barnard event yesterday, organized by Nathalie Molina, who organizes the Athena Mastermind group I’m in at Barnard. I went to the morning talks to see my friend and co-author Rachel Schutt‘s presentation and then came home to spend the rest of the day with my kids, but they other three I saw were also interesting and food for thought.
Unfortunately the videos won’t be available for a month or so, and I plan to blog again when they are for content, but I wanted to discuss an issue that came up during the Q&A session, namely:
what we choose to quantify and why that matters, especially to women.
This may sound abstract but it isn’t. Here’s what I mean. The talks were centered around the following 10 themes:
- Inspiration: Motivate, and nurture talented people and build collaborative teams
- Advocacy: Speak up for yourself and on behalf of others
- Communication: Listen actively; speak persuasively and with authority
- Vision: Develop strategies, make decisions and act with purpose
- Leverage: Optimize your networks, technology, and financing to meet strategic goals; engage mentors and sponsors
- Entrepreneurial Spirit: Be innovative, imaginative, persistent, and open to change
- Ambition: Own your power, expertise and value
- Courage: Experiment and take bold, strategic risks
- Negotiation: Bridge differences and find solutions that work effectively for all parties
- Resilience: Bounce back and learn from adversity and failure
The speakers were extraordinary and embodied their themes brilliantly. So Rachel spoke about advocating for humanity through working with data, and this amazing woman named Christa Bell spoke about inspiration, and so on. Again, the actual content is for another time, but you get the point.
A high school teacher was there with five of her female students. She spoke eloquently of how important and inspiring it was that these girls saw these talk. She explained that, at their small-town school, there’s intense pressure to do well on standardized tests and other quantifiable measures of success, but that there’s essentially no time in their normal day to focus on developing the above attributes.
Ironic, considering that you don’t get to be a “success” without ambition and courage, communication and vision, or really any of the themes.
In other words, we have these latent properties that we really care about and are essential to someone’s success, but we don’t know how to measure them so we instead measure stuff that’s easy to measure, and reward people based on those scores.
By the way, I’m not saying we don’t also need to be good at content, and tasks, which are easier to measure. I’m just saying that, by focusing on content and tasks, and rewarding people good at that, we’re not developing people to be more courageous, or more resilient, or especially be better advocates of others.
And that’s where the women part comes in. Women, especially young women, are sensitive to the expectations of the culture. If they are getting scored on X, they tend to focus on getting good at X. That’s not a bad thing, because they usually get really good at X, but we have to understand the consequences of it. We have to choose our X’s well.
I’d love to see a system evolve wherein young women (and men) are trained to be resilient and are rewarded for that just as they’re trained to do well on the SAT’s and rewarded for that. How do you train people to be courageous? I’m sure it can be done. How crazy would it be to see a world where advocating for others is directly encouraged?
Let’s try to do this, and hell let’s quantify it too, since that desire, to quantify everything, is not going away. Instead of giving up because important things are hard to quantify, let’s just figure out a way to quantify them. After all, people didn’t think their musical tastes could be quantified 15 years ago but now there’s Pandora.
Update: Ok to quantify this, but the resulting data should not be sold or publicly available. I don’t want our sons’ and daughters’ “resilience scores” to be part of their online personas for everyone to see.
Columbia Data Science course, week 13: MapReduce
The week in Rachel Schutt’s Data Science course at Columbia we had two speakers.
The first was David Crawshaw, a Software Engineer at Google who was trained as a mathematician, worked on Google+ in California with Rachel, and now works in NY on search.
David came to talk to us about MapReduce and how to deal with too much data.
Thought Experiment
Let’s think about information permissions and flow when it comes to medical records. David related a story wherein doctors estimated that 1 or 2 patients died per week in a certain smallish town because of the lack of information flow between the ER and the nearby mental health clinic. In other words, if the records had been easier to match, they’d have been able to save more lives. On the other hand, if it had been easy to match records, other breaches of confidence might also have occurred.
What is the appropriate amount of privacy in health? Who should have access to your medical records?
Comments from David and the students:
- We can assume we think privacy is a generally good thing.
- Example: to be an atheist is punishable by death in some places. It’s better to be private about stuff in those conditions.
- But it takes lives too, as we see from this story.
- Many egregious violations happen in law enforcement, where you have large databases of license plates etc., and people who have access abuse it. In this case it’s a human problem, not a technical problem.
- It’s also a philosophical problem: to what extent are we allowed to make decisions on behalf of other people?
- It’s also a question of incentives. I might cure cancer faster with more medical data, but I can’t withhold the cure from people who didn’t share their data with me.
- To a given person it’s a security issue. People generally don’t mind if someone has their data, they mind if the data can be used against them and/or linked to them personally.
- It’s super hard to make data truly anonymous.
MapReduce
What is big data? It’s a buzzword mostly, but it can be useful. Let’s start with this:
You’re dealing with big data when you’re working with data that doesn’t fit into your compute unit. Note that’s an evolving definition: big data has been around for a long time. The IRS had taxes before computers.
Today, big data means working with data that doesn’t fit in one computer. Even so, the size of big data changes rapidly. Computers have experienced exponential growth for the past 40 years. We have at least 10 years of exponential growth left (and I said the same thing 10 years ago).
Given this, is big data going to go away? Can we ignore it?
No, because although the capacity of a given computer is growing exponentially, those same computers also make the data. The rate of new data is also growing exponentially. So there are actually two exponential curves, and they won’t intersect any time soon.
Let’s work through an example to show how hard this gets.
Word frequency problem
Say you’re told to find the most frequent words in the following list: red, green, bird, blue, green, red, red.
The easiest approach for this problem is inspection, of course. But now consider the problem for lists containing 10,000, or 100,000, or 
The simplest approach is to list the words and then count their prevalence. Here’s an example code snippet from the language Go:
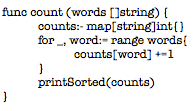
Since counting and sorting are fast, this scales to ~100 million words. The limit is now computer memory – if you think about it, you need to get all the words into memory twice.
We can modify it slightly so it doesn’t have to have all words loaded in memory. keep them on the disk and stream them in by using a channel instead of a list. A channel is something like a stream: you read in the first 100 items, then process them, then you read in the next 100 items.
Wait, there’s still a potential problem, because if every word is unique your program will still crash; it will still be too big for memory. On the other hand, this will probably work nearly all the time, since nearly all the time there will be repetition. Real programming is a messy game.
But computers nowadays are many-core machines, let’s use them all! Then the bandwidth will be the problem, so let’s compress the inputs… There are better alternatives that get complex. A heap of hashed values has a bounded size and can be well-behaved (a heap seems to be something like a poset, and I guess you can throw away super small elements to avoid holding everything in memory). This won’t always work but it will in most cases.
Now we can deal with on the order of 10 trillion words, using one computer.
Now say we have 10 computers. This will get us 100 trillion words. Each computer has 1/10th of the input. Let’s get each computer to count up its share of the words. Then have each send its counts to one “controller” machine. The controller adds them up and finds the highest to solve the problem.
We can do the above with hashed heaps too, if we first learn network programming.
Now take a hundred computers. We can process a thousand trillion words. But then the “fan-in”, where the results are sent to the controller, will break everything because of bandwidth problem. We need a tree, where every group of 10 machines sends data to one local controller, and then they all send to super controller. This will probably work.
But… can we do this with 1000 machines? No. It won’t work. Because at that scale one or more computer will fail. If we denote by 


But this means, when you have 1000 computers, that the chance that no computer is broken is 


We address this problem by talking about fault tolerance for distributed work. This usually involves replicating the input (the default is to have three copies of everything), and making the different copies available to different machines, so if one blows another one will still have the good data. We might also embed checksums in the data, so the data itself can be audited for erros, and we will automate monitoring by a controller machine (or maybe more than one?).
In general we need to develop a system that detects errors, and restarts work automatically when it detects them. To add efficiency, when some machines finish, we should use the excess capacity to rerun work, checking for errors.
Q: Wait, I thought we were counting things?! This seems like some other awful rat’s nest we’ve gotten ourselves into.
A: It’s always like this. You cannot reason about the efficiency of fault tolerance easily, everything is complicated. And note, efficiency is just as important as correctness, since a thousand computers are worth more than your salary. It’s like this:
- The first 10 computers are easy,
- The first 100 computers are hard, and
- The first 1,000 computers are impossible.
There’s really no hope. Or at least there wasn’t until about 8 years ago. At Google I use 10,000 computers regularly.
In 2004 Jeff and Sanjay published their paper on MapReduce (and here’s one on the underlying file system).
MapReduce allows us to stop thinking about fault tolerance; it is a platform that does the fault tolerance work for us. Programming 1,000 computers is now easier than programming 100. It’s a library to do fancy things.
To use MapReduce, you write two functions: a mapper function, and then a reducer function. It takes these functions and runs them on many machines which are local to your stored data. All of the fault tolerance is automatically done for you once you’ve placed the algorithm into the map/reduce framework.
The mapper takes each data point and produces an ordered pair of the form (key, value). The framework then sorts the outputs via the “shuffle”, and in particular finds all the keys that match and puts them together in a pile. Then it sends these piles to machines which process them using the reducer function. The reducer function’s outputs are of the form (key, new value), where the new value is some aggregate function of the old values.
So how do we do it for our word counting algorithm? For each word, just send it to the ordered with the key that word and the value being the integer 1. So
red —> (“red”, 1)
blue —> (“blue”, 1)
red —> (“red”, 1)
Then they go into the “shuffle” (via the “fan-in”) and we get a pile of (“red”, 1)’s, which we can rewrite as (“red”, 1, 1). This gets sent to the reducer function which just adds up all the 1’s. We end up with (“red”, 2), (“blue”, 1).
Key point: one reducer handles all the values for a fixed key.
Got more data? Increase the number of map workers and reduce workers. In other words do it on more computers. MapReduce flattens the complexity of working with many computers. It’s elegant and people use it even when they “shouldn’t” (although, at Google it’s not so crazy to assume your data could grow by a factor of 100 overnight). Like all tools, it gets overused.
Counting was one easy function, but now it’s been split up into two functions. In general, converting an algorithm into a series of MapReduce steps is often unintuitive.
For the above word count, distribution needs to be uniform. It all your words are the same, they all go to one machine during the shuffle, which causes huge problems. Google has solved this using hash buckets heaps in the mappers in one MapReduce iteration. It’s called CountSketch, and it is built to handle odd datasets.
At Google there’s a realtime monitor for MapReduce jobs, a box with “shards” which correspond to pieces of work on a machine. It indicates through a bar chart how the various machines are doing. If all the mappers are running well, you’d see a straight line across. Usually, however, everything goes wrong in the reduce step due to non-uniformity of the data – lots of values on one key.
The data preparation and writing the output, which take place behind the scenes, take a long time, so it’s good to try to do everything in one iteration. Note we’re assuming distributed file system is already there – indeed we have to use MapReduce to get data to the distributed file system – once we start using MapReduce we can’t stop.
Once you get into the optimization process, you find yourself tuning MapReduce jobs to shave off nanoseconds 10^{-9} whilst processing petabytes of data. These are order shifts worthy of physicists. This optimization is almost all done in C++. It’s highly optimized code, and we try to scrape out every ounce of power we can.
Josh Wills
Our second speaker of the night was Josh Wills. Josh used to work at Google with Rachel, and now works at Cloudera as a Senior Director of Data Science. He’s known for the following quote:
Data Science (n.): Person who is better at statistics than any software engineer and better at software engineering than any statistician.
Thought experiment
How would you build a human-powered airplane? What would you do? How would you form a team?
Student: I’d run an X prize. Josh: this is exactly what they did, for $50,000 in 1950. It took 10 years for someone to win it. The story of the winner is useful because it illustrates that sometimes you are solving the wrong problem.
The first few teams spent years planning and then their planes crashed within seconds. The winning team changed the question to: how do you build an airplane you can put back together in 4 hours after a crash? After quickly iterating through multiple prototypes, they solved this problem in 6 months.
Josh had some observations about the job of a data scientist:
- I spend all my time doing data cleaning and preparation. 90% of the work is data engineering.
- On solving problems vs. finding insights: I don’t find insights, I solve problems.
- Start with problems, and make sure you have something to optimize against.
- Parallelize everything you do.
- It’s good to be smart, but being able to learn fast is even better.
- We run experiments quickly to learn quickly.
Data abundance vs. data scarcity
Most people think in terms of scarcity. They are trying to be conservative, so they throw stuff away.
I keep everything. I’m a fan of reproducible research, so I want to be able to rerun any phase of my analysis. I keep everything.
This is great for two reasons. First, when I make a mistake, I don’t have to restart everything. Second, when I get new sources of data, it’s easy to integrate in the point of the flow where it makes sense.
Designing models
Models always turn into crazy Rube Goldberg machines, a hodge-podge of different models. That’s not necessarily a bad thing, because if they work, they work. Even if you start with a simple model, you eventually add a hack to compensate for something. This happens over and over again, it’s the nature of designing the model.
Mind the gap
The thing you’re optimizing with your model isn’t the same as the thing you’re optimizing for your business.
Example: friend recommendations on Facebook doesn’t optimize you accepting friends, but rather maximizing the time you spend on Facebook. Look closely: the suggestions are surprisingly highly populated by attractive people of the opposite sex.
How does this apply in other contexts? In medicine, they study the effectiveness of a drug instead of the health of the patients. They typically focus on success of surgery rather than well-being of the patient.
When I graduated in 2001, we had two options for file storage.
1) Databases:
- structured schemas
- intensive processing done where data is stored
- somewhat reliable
- expensive at scale
2) Filers:
- no schemas
- no data processing capability
- reliable
- expensive at scale
Since then we’ve started generating lots more data, mostly from the web. It brings up the natural idea of a data economic indicator, return on byte. How much value can I extract from a byte of data? How much does it cost to store? If we take the ratio, we want it to be bigger than one or else we discard.
Of course this isn’t the whole story. There’s also a big data economic law, which states that no individual record is particularly valuable, but having every record is incredibly valuable. So for example in any of the following categories,
- web index
- recommendation systems
- sensor data
- market basket analysis
- online advertising
one has an enormous advantage if they have all the existing data.
A brief introduction to Hadoop
Back before Google had money, they had crappy hardware. They came up with idea of copying data to multiple servers. They did this physically at the time, but then they automated it. The formal automation of this process was the genesis of GFS.
There are two core components to Hadoop. First is the distributed file system (HDFS), which is based on the google file system. The data stored in large files, with block sizes of 64MB to 256MB. As above, the blocks are replicated to multiple nodes in the cluster. The master node notices if a node dies.
Data engineering on hadoop
Hadoop is written in java, Whereas Google stuff is in C++.
Writing map reduce in the java API not pleasant. Sometimes you have to write lots and lots of map reduces. However, if you use hadoop streaming, you can write in python, R, or other high-level languages. It’s easy and convenient for parallelized jobs.
Cloudera
Cloudera is like Red hat for hadoop. It’s done under aegis of the Apache Software Foundation. The code is available for free, but Cloudera packages it together, gives away various distributions for free, and waits for people to pay for support and to keep it up and running.
Apache hive is a data warehousing system on top of hadoop. It uses an SQL-based query language (includes some map reduce -specific extensions), and it implements common join and aggregation patterns. This is nice for people who know databases well and are familiar with stuff like this.
Workflow
- Using hive, build records that contain everything I know about an entity (say a person) (intensive mapReduce stuff)
- Write python scripts to process the records over and over again (faster and iterative, also mapReduce)
- Update the records when new data arrives
Note phase 2 are typically map-only jobs, which makes parallelization easy.
I prefer standard data formats: text is big and takes up space. Thrift, Avro, protobuf are more compact, binary formats. I also encourage you to use the code and metadata repository Github. I don’t keep large data files in git.
How to evaluate a black box financial system
I’ve been blogging about evaluation methods for modeling, for example here and here, as part of the book I’m writing with Rachel Schutt based on her Columbia Data Science class this semester.
Evaluation methods are important abstractions that allow us to measure models based only on their output.
Using various metrics of success, we can contrast and compare two or more entirely different models. And it means we don’t care about their underlying structure – they could be based on neural nets, logistic regression, or decision trees, but for the sake of measuring the accuracy, or the ranking, or the calibration, the evaluation method just treats them like black boxes.
It recently occurred to me a that we could generalize this a bit, to systems rather than models. So if we wanted to evaluate the school system, or the political system, or the financial system, we could ignore the underlying details of how they are structured and just look at the output. To be reasonable we have to compare two systems that are both viable; it doesn’t make sense to talk about a current, flawed system relative to perfection, since of course every version of reality looks crappy compared to an ideal.
The devil is in the articulated evaluation metric, of course. So for the school system, we can ask various questions: Do our students know how to read? Do they finish high school? Do they know how to formulate an argument? Have they lost interest in learning? Are they civic-minded citizens? Do they compare well to other students on standardized tests? How expensive is the system?
For the financial system, we might ask things like: Does the average person feel like their money is safe? Does the system add to stability in the larger economy? Does the financial system mitigate risk to the larger economy? Does it put capital resources in the right places? Do fraudulent players inside the system get punished? Are the laws transparent and easy to follow?
The answers to those questions aren’t looking good at all: for example, take note of the recent Congressional report that blames Jon Corzine for MF Global’s collapse, pins him down on illegal and fraudulent activity, and then does absolutely nothing about it. To conserve space I will only use this example but there are hundreds more like this from the last few years.
Suffice it to say, what we currently have is a system where the agents committing fraud are actually glad to be caught because the resulting fines are on the one hand smaller than their profits (and paid by shareholders, not individual actors), and on the other hand are cemented as being so, and set as precedent.
But again, we need to compare it to another system, we can’t just say “hey there are flaws in this system,” because every system has flaws.
I’d like to compare it to a system like ours except where the laws are enforced.
That may sounds totally naive, and in a way it is, but then again we once did have laws, that were enforced, and the financial system was relatively tame and stable.
And although we can’t go back in a time machine to before Glass-Steagall was revoked and keep “financial innovation” from happening, we can ask our politicians to give regulators the power to simplify the system enough so that something like Glass-Steagall can once again work.
Systematized racism in online advertising, part 1
There is no regulation of how internet ad models are built. That means that quants can use any information they want, usually historical, to decide what to expect in the future. That includes associating arrests with african-american sounding names.
In a recent Reuters article, this practice was highlighted:
Instantcheckmate.com, which labels itself the “Internet’s leading authority on background checks,” placed both ads. A statistical analysis of the company’s advertising has found it has disproportionately used ad copy including the word “arrested” for black-identifying names, even when a person has no arrest record.
Luckily, Professor Sweeney, a Harvard University professor of government with a doctorate in computer science, is on the case:
According to preliminary findings of Professor Sweeney’s research, searches of names assigned primarily to black babies, such as Tyrone, Darnell, Ebony and Latisha, generated “arrest” in the instantcheckmate.com ad copy between 75 percent and 96 percent of the time. Names assigned at birth primarily to whites, such as Geoffrey, Brett, Kristen and Anne, led to more neutral copy, with the word “arrest” appearing between zero and 9 percent of the time.
Of course when I say there’s no regulation, that’s an exaggeration. There is some, and if you claim to be giving a credit report, then regulations really do exist. But as for the above, here’s what regulators have to say:
“It’s disturbing,” Julie Brill, an FTC commissioner, said of Instant Checkmate’s advertising. “I don’t know if it’s illegal … It’s something that we’d need to study to see if any enforcement action is needed.”
Let’s be clear: this is just the beginning.
Columbia Data Science course, week 12: Predictive modeling, data leakage, model evaluation
This week’s guest lecturer in Rachel Schutt’s Columbia Data Science class was Claudia Perlich. Claudia has been the Chief Scientist at m6d for 3 years. Before that she was a data analytics group at the IBM center that developed Watson, the computer that won Jeopardy!, although she didn’t work on that project. Claudia got her Ph.D. in information systems at NYU and now teaches a class to business students in data science, although mostly she addresses how to assess data science work and how to manage data scientists. Claudia also holds a masters in Computer Science.
Claudia is a famously successful data mining competition winner. She won the KDD Cup in 2003, 2007, 2008, and 2009, the ILP Challenge in 2005, the INFORMS Challenge in 2008, and the Kaggle HIV competition in 2010.
She’s also been a data mining competition organizer, first for the INFORMS Challenge in 2009 and then for the Heritage Health Prize in 2011. Claudia claims to be retired from competition.
Claudia’s advice to young people: pick your advisor first, then choose the topic. It’s important to have great chemistry with your advisor, and don’t underestimate the importance.
Background
Here’s what Claudia historically does with her time:
- predictive modeling
- data mining competitions
- publications in conferences like KDD and journals
- talks
- patents
- teaching
- digging around data (her favorite part)
Claudia likes to understand something about the world by looking directly at the data.
Here’s Claudia’s skill set:
- plenty of experience doing data stuff (15 years)
- data intuition (for which one needs to get to the bottom of the data generating process)
- dedication to the evaluation (one needs to cultivate a good sense of smell)
- model intuition (we use models to diagnose data)
Claudia also addressed being a woman. She says it works well in the data science field, where her intuition is useful and is used. She claims her nose is so well developed by now that she can smell it when something is wrong. This is not the same thing as being able to prove something algorithmically. Also, people typically remember her because she’s a woman, even when she don’t remember them. It has worked in her favor, she says, and she’s happy to admit this. But then again, she is where she is because she’s good.
Someone in the class asked if papers submitted for journals and/or conferences are blind to gender. Claudia responded that it was, for some time, typically double-blind but now it’s more likely to be one-sided. And anyway there was a cool analysis that showed you can guess who wrote a paper with 80% accuracy just by knowing the citations. So making things blind doesn’t really help. More recently the names are included, and hopefully this doesn’t make things too biased. Claudia admits to being slightly biased towards institutions – certain institutions prepare better work.
Skills and daily life of a Chief Data Scientist
Claudia’s primary skills are as follows:
- Data manipulation: unix (sed, awk, etc), Perl, SQL
- Modeling: various methods (logistic regression, nearest neighbors, k-nearest neighbors, etc)
- Setting things up
She mentions that the methods don’t matter as much as how you’ve set it up, and how you’ve translated it into something where you can solve a question.
More recently, she’s been told that at work she spends:
- 40% of time as “contributor”: doing stuff directly with data
- 40% of time as “ambassador”: writing stuff, giving talks, mostly external communication to represent m6d, and
- 20% of time in “leadership” of her data group
At IBM it was much more focused in the first category. Even so, she has a flexible schedule at m6d and is treated well.
The goals of the audience
She asked the class, why are you here? Do you want to:
- become a data scientist? (good career choice!)
- work with data scientist?
- work for a data scientist?
- manage a data scientist?
Most people were trying their hands at the first, but we had a few in each category.
She mentioned that it matters because the way she’d talk to people wanting to become a data scientist would be different from the way she’d talk to someone who wants to manage them. Her NYU class is more like how to manage one.
So, for example, you need to be able to evaluate their work. It’s one thing to check a bubble sort algorithm or check whether a SQL server is working, but checking a model which purports to give the probability of people converting is different kettle of fish.
For example, try to answer this: how much better can that model get if you spend another week on it? Let’s face it, quality control is hard for yourself as a data miner, so it’s definitely hard for other people. There’s no easy answer.
There’s an old joke that comes to mind: What’s the difference between the scientist and a consultant? The scientists asks, how long does it take to get this right? whereas the consultant asks, how right can I get this in a week?
Insights into data
A student asks, how do you turn a data analysis into insights?
Claudia: this is a constant point of contention. My attitude is: I like to understand something, but what I like to understand isn’t what you’d consider an insight. My message may be, hey you’ve replaced every “a” by a “0”, or, you need to change the way you collect your data. In terms of useful insight, Ori’s lecture from last week, when he talked about causality, is as close as you get.
For example, decision trees you interpret, and people like them because they’re easy to interpret, but I’d ask, why does it look like it does? A slightly different data set would give you a different tree and you’d get a different conclusion. This is the illusion of understanding. I tend to be careful with delivering strong insights in that sense.
For more in this vein, Claudia suggests we look at Monica Rogati‘s talk “Lies, damn lies, and the data scientist.”
Data mining competitions
Claudia drew a distinction between different types of data mining competitions.
On the one hand you have the “sterile” kind, where you’re given a clean, prepared data matrix, a standard error measure, and where the features are often anonymized. This is a pure machine learning problem.
Examples of this first kind are: KDD Cup 2009 and 2011 (Netflix). In such competitions, your approach would emphasize algorithms and computation. The winner would probably have heavy machines and huge modeling ensembles.
On the other hand, you have the “real world” kind of data mining competition, where you’re handed raw data, which is often in lots of different tables and not easily joined, where you set up the model yourself and come up with task-specific evaluations. This kind of competition simulates real life more.
Examples of this second kind are: KDD cup 2007, 2008, and 2010. If you’re competing in this kind of competition your approach would involve understanding the domain, analyzing the data, and building the model. The winner might be the person who best understands how to tailor the model to the actual question.
Claudia prefers the second kind, because it’s closer to what you do in real life. In particular, the same things go right or go wrong.
How to be a good modeler
Claudia claims that data and domain understanding is the single most important skill you need as a data scientist. At the same time, this can’t really be taught – it can only be cultivated.
A few lessons learned about data mining competitions that Claudia thinks are overlooked in academics:
- Leakage: the contestants best friend and the organizers/practitioners worst nightmare. There’s always something wrong with the data, and Claudia has made an artform of figuring out how the people preparing the competition got lazy or sloppy with the data.
- Adapting learning to real-life performance measures beyond standard measures like MSE, error rate, or AUC (profit?)
- Feature construction/transformation: real data is rarely flat (i.e. given to you in a beautiful matrix) and good, practical solutions for this problem remains a challenge.
Leakage
Leakage refers to something that helps you predict something that isn’t fair. It’s a huge problem in modeling, and not just for competitions. Oftentimes it’s an artifact of reversing cause and effect.
Example 1: There was a competition where you needed to predict S&P in terms of whether it would go up or go down. The winning entry had a AUC (area under the ROC curve) of 0.999 out of 1. Since stock markets are pretty close to random, either someone’s very rich or there’s something wrong. There’s something wrong.
In the good old days you could win competitions this way, by finding the leakage.
Example 2: Amazon case study: big spenders. The target of this competition was to predict customers who spend a lot of money among customers using past purchases. The data consisted of transaction data in different categories. But a winning model identified that “Free Shipping = True” was an excellent predictor
What happened here? The point is that free shipping is an effect of big spending. But it’s not a good way to model big spending, because in particular it doesn’t work for new customers or for the future. Note: timestamps are weak here. The data that included “Free Shipping = True” was simultaneous with the sale, which is a no-no. We need to only use data from beforehand to predict the future.
Example 3: Again an online retailer, this time the target is predicting customers who buy jewelry. The data consists of transactions for different categories. A very successful model simply noted that if sum(revenue) = 0, then it predicts jewelry customers very well?
What happened here? The people preparing this data removed jewelry purchases, but only included people who bought something in the first place. So people who had sum(revenue) = 0 were people who only bought jewelry. The fact that you only got into the dataset if you bought something is weird: in particular, you wouldn’t be able to use this on customers before they finished their purchase. So the model wasn’t being trained on the right data to make the model useful. This is a sampling problem, and it’s common.
Example 4: This happened at IBM. The target was to predict companies who would be willing to buy “websphere” solutions. The data was transaction data + crawled potential company websites. The winning model showed that if the term “websphere” appeared on the company’s website, then they were great candidates for the product.
What happened? You can’t crawl the historical web, just today’s web.
Thought experiment
You’re trying to study who has breast cancer. The patient ID, which seemed innocent, actually has predictive power. What happened?

In the above image, red means cancerous, green means not. it’s plotted by patient ID. We see three or four distinct buckets of patient identifiers. It’s very predictive depending on the bucket. This is probably a consequence of using multiple databases, some of which correspond to sicker patients are more likely to be sick.
A student suggests: for the purposes of the contest they should have renumbered the patients and randomized.
Claudia: would that solve the problem? There could be other things in common as well.
A student remarks: The important issue could be to see the extent to which we can figure out which dataset a given patient came from based on things besides their ID.
Claudia: Think about this: what do we want these models for in the first place? How well can you predict cancer?
Given a new patient, what would you do? If the new patient is in a fifth bin in terms of patient ID, then obviously don’t use the identifier model. But if it’s still in this scheme, then maybe that really is the best approach.
This discussion brings us back to the fundamental problem that we need to know what the purpose of the model is and how is it going to be used in order to decide how to do it and whether it’s working.
Pneumonia
During an INFORMS competition on pneumonia predictions in hospital records, where the goal was to predict whether a patient has pneumonia, a logistic regression which included the number of diagnosis codes as a numeric feature (AUC of 0.80) didn’t do as well as the one which included it as a categorical feature (0.90). What’s going on?
This had to do with how the person prepared the data for the competition:

The diagnosis code for pneumonia was 486. So the preparer removed that (and replaced it by a “-1”) if it showed up in the record (rows are different patients, columns are different diagnoses, there are max 4 diagnoses, “-1” means there’s nothing for that entry).
Moreover, to avoid telling holes in the data, the preparer moved the other diagnoses to the left if necessary, so that only “-1″‘s were on the right.
There are two problems with this:
- If the column has only “-1″‘s, then you know it started out with only pneumonia, and
- If the column has no “-1″‘s, you know there’s no pneumonia (unless there are actually 5 diagnoses, but that’s less common).
This was enough information to win the competition.
Note: winning competition on leakage is easier than building good models. But even if you don’t explicitly understand and game the leakage, your model will do it for you. Either way, leakage is a huge problem.
How to avoid leakage
Claudia’s advice to avoid this kind of problem:
- You need a strict temporal cutoff: remove all information just prior to the event of interest (patient admission).
- There has to be a timestamp on every entry and you need to keep
- Removing columns asks for trouble
- Removing rows can introduce inconsistencies with other tables, also causing trouble
- The best practice is to start from scratch with clean, raw data after careful consideration
- You need to know how the data was created! I only work with data I pulled and prepared myself (or maybe Ori).
Evaluations
How do I know that my model is any good?
With powerful algorithms searching for patterns of models, there is a serious danger of over fitting. It’s a difficult concept, but the general idea is that “if you look hard enough you’ll find something” even if it does not generalize beyond the particular training data.
To avoid overfitting, we cross-validate and we cut down on the complexity of the model to begin with. Here’s a standard picture (although keep in mind we generally work in high dimensional space and don’t have a pretty picture to look at):

The picture on the left is underfit, in the middle is good, and on the right is overfit.
The model you use matters when it concerns overfitting:

So for the above example, unpruned decision trees are the most over fitting ones. This is a well-known problem with unpruned decision trees, which is why people use pruned decision trees.
Accuracy: meh
Claudia dismisses accuracy as a bad evaluation method. What’s wrong with accuracy? It’s inappropriate for regression obviously, but even for classification, if the vast majority is of binary outcomes are 1, then a stupid model can be accurate but not good (guess it’s always “1”), and a better model might have lower accuracy.
Probabilities matter, not 0’s and 1’s.
Nobody makes decisions on binary outcomes. I want to know the probability I have breast cancer, I don’t want to be told yes or no. It’s much more information. I care about probabilities.
How to evaluate a probability model
We separately evaluate the ranking and the calibration. To evaluate the ranking, we use the ROC curve and calculate the area under it, typically ranges from 0.5-1.0. This is independent of scaling and calibration. Here’s an example of how to draw an ROC curve:

Sometimes to measure rankings, people draw the so-called lift curve:

The key here is that the lift is calculated with respect to a baseline. You draw it at a given point, say 10%, by imagining that 10% of people are shown ads, and seeing how many people click versus if you randomly showed 10% of people ads. A lift of 3 means it’s 3 times better.
How do you measure calibration? Are the probabilities accurate? If the model says probability of 0.57 that I have cancer, how do I know if it’s really 0.57? We can’t measure this directly. We can only bucket those predictions and then aggregately compare those in that prediction bucket (say 0.50-0.55) to the actual results for that bucket.
For example, here’s what you get when your model is an unpruned decision tree, where the blue diamonds are buckets:
 A good model would show buckets right along the x=y curve, but here we’re seeing that the predictions were much more extreme than the actual probabilities. Why does this pattern happen for decision trees?
Claudia says that this is because trees optimize purity: it seeks out pockets that have only positives or negatives. Therefore its predictions are more extreme than reality. This is generally true about decision trees: they do not generally perform well with respect to calibration.
Logistic regression looks better when you test calibration, which is typical:

Takeaways:
- Accuracy is almost never the right evaluation metric.
- Probabilities, not binary outcomes.
- Separate ranking from calibration.
- Ranking you can measure with nice pictures: ROC, lift
- Calibration is measured indirectly through binning.
- Different models are better than others when it comes to calibration.
- Calibration is sensitive to outliers.
- Measure what you want to be good at.
- Have a good baseline.
Choosing an algorithm
This is not a trivial question and in particular small tests may steer you wrong, because as you increase the sample size the best algorithm might vary: often decision trees perform very well but only if there’s enough data.
In general you need to choose your algorithm depending on the size and nature of your dataset and you need to choose your evaluation method based partly on your data and partly on what you wish to be good at. Sum of squared error is maximum likelihood loss function if your data can be assumed to be normal, but if you want to estimate the median, then use absolute errors. If you want to estimate a quantile, then minimize the weighted absolute error.
We worked on predicting the number of ratings of a movie will get in the next year, and we assumed a poisson distributions. In this case our evaluation method doesn’t involve minimizing the sum of squared errors, but rather something else which we found in the literature specific to the Poisson distribution, which depends on the single parameter 

Charity direct mail campaign
Let’s put some of this together.
Say we want to raise money for a charity. If we send a letter to every person in the mailing list we raise about $9000. We’d like to save money and only send money to people who are likely to give – only about 5% of people generally give. How can we do that?
If we use a (somewhat pruned, as is standard) decision tree, we get $0 profit: it never finds a leaf with majority positives.
If we use a neural network we still make only $7500, even if we only send a letter in the case where we expect the return to be higher than the cost.
This looks unworkable. But if you model is better, it’s not. A person makes two decisions here. First, they decide whether or not to give, then they decide how much to give. Let’s model those two decisions separately, using:

Note we need the first model to be well-calibrated because we really care about the number, not just the ranking. So we will try logistic regression for first half. For the second part, we train with special examples where there are donations.
Altogether this decomposed model makes a profit of $15,000. The decomposition made it easier for the model to pick up the signals. Note that with infinite data, all would have been good, and we wouldn’t have needed to decompose. But you work with what you got.
Moreover, you are multiplying errors above, which could be a problem if you have a reason to believe that those errors are correlated.
Parting thoughts
We are not meant to understand data. Data are outside of our sensory systems and there are very few people who have a near-sensory connection to numbers. We are instead meant to understand language.
We are not mean to understand uncertainty: we have all kinds of biases that prevent this from happening and are well-documented.
Modeling people in the future is intrinsically harder than figuring out how to label things that have already happened.
Even so we do our best, and this is through careful data generation, careful consideration of what our problem is, making sure we model it with data close to how it will be used, making sure we are optimizing to what we actually desire, and doing our homework in learning which algorithms fit which tasks.
Whither the fake clicks?
My friend Ori explained to me last week about where all those fake clicks are coming from and going to and why. He blogged about it on m6d’s website.
As usual, it’s all about incentives. They’re gaming the online advertising model for profit.
To understand the scam, the first thing to know is that advertisers bid for placement on websites, and they bid higher if they think high quality people will see their ad and if they think a given website is well-connected in the larger web.
Say you want that advertising money. You set up a website for the express purpose of selling ads to the people who come to your website.
First, if your website gets little or no traffic, nobody is willing to bid up that advertising. No problem, just invent robots that act like people clicking.
Next, this still wouldn’t work if your website seems unconnected to the larger web. So what these guy have done is to create hundreds if not thousands of websites, which just constantly shovel fake people around their own network from place to place. That creates the impression, using certain calculations of centrality, that these are very well connected websites.
Finally, you might ask how the bad guys convince advertisers that these robots are “high quality” clicks. Here they rely on the fact that advertisers use different definition of quality.
Whereas you might only want to count people as high quality if they actually buy your product, it’s often hard to know if that has happened (especially if it’s a store-bought item) so proxies are used instead. Often it’s as simple as whether the online user visits the website of the product, which of course can be done by robots instead.
So there it is, an entire phantom web set up just to game the advertisers’ bid system and collect ad money that should by all rights not exist.
Two comments:
- First, I’m not sure this is illegal. Which is not to say it’s unavoidable, because it’s not so hard to track if you’re fighting against it. The beginning of a very large war.
- Second, even if there weren’t this free-for-the-gaming advertiser money out there, there’d still be another group of people incentivized to create fake clicks. Namely, the advertisers give out bonuses to their campaign-level people based on click-through rates. So these campaign managers have a natural incentive to artificially inflate the click-through rates (which would work against their companies’ best interest to be sure). I’m not saying that those people are the architects of the fake clicks, just that they have incentive to be. In particular, they have no incentive to fix this problem.


