Archive
Aunt Pythia’s advice and a request for cool math books
First, my answer to last week’s question which you guys also answered:
Aunt Pythia,
My loving, wonderful, caring boyfriend slurps his food. Not just soup — everything (even cereal!). Should I just deal with it, or say something? I think if I comment on it he’ll be offended, but I find it distracting during our meals together.
Food (Consumption) Critic
——
You guys did well with answering the question, and I’d like to nominate the following for “most likely to actually make the problem go away”, from Richard:
I’d go with blunt but not particularly bothered – halfway through his next bowl of cereal, exclaim “Wow, you really slurp your food, don’t you?! I never noticed that before.”
But then again, who says we want this problem to go away? My firm belief is that every relationship needs to have an unimportant thing that bugs the participants. Sometimes it’s how high the toaster is set, sometimes it’s how the other person stacks the dishes in the dishwasher, but there’s always that thing. And it’s okay: if we didn’t have the thing we’d invent it. In fact having the thing prevents all sorts of other things from becoming incredible upsetting. My theory anyway.
So my advice to Food Consumption Critic is: don’t do anything! Cherish the slurping! Enjoy something this banal and inconsequential being your worst criticism of this lovely man.
Unless you’re like Liz, also a commenter from last week, who left her husband because of the way he breathed. If it’s driving you that nuts, you might want to go with Richard’s advice.
——
Aunt Pythia,
Dear Aunt Pythia, I want to write to an advice column, but I don’t know whether or not to trust the advice I will receive. What do you recommend?
Perplexed in SoPo
Dear PiSP,
I hear you, and you’re right to worry. Most people only ask things they kind of know the answer to, or to get validation that they’re not a total jerk, or to get permission to do something that’s kind of naughty. If the advice columnist tells them something they disagree with, they ignore it entirely anyway. It’s a total waste of time if you think about it.
However, if your question is super entertaining and kind of sexy, then I suggest you write in ASAP. That’s the very kind of question that columnists know how to answer in deep, meaningful and surprising ways.
Yours,
AP
——
Aunt Pythia,
With global warming and hot summers do you think it’s too early to bring the toga back in style?
John Doe
Dear John,
It’s never to early to wear sheets. Think about it: you get to wear the very same thing you sleep in. It’s like you’re a walking bed.
Auntie
——
Aunt Pythia,
Is it unethical not to tell my dad I’m starting a business? I doubt he’d approve and I’m inclined to wait until it’s successful to tell him about it.
Angsty New Yorker
Dear ANY,
Wait, what kind of business is this? Are we talking hedge fund or sex toy shop?
In either case, I don’t think you need to tell your parents anything about your life if you are older than 18 and don’t want to, it’s a rule of american families. Judging by my kids, this rule actually starts when they’re 11.
Of course it depends on your relationship with your father how easy that will be and what you’d miss out on by being honest, but the fear of his disapproval is, to me, a bad sign: you’re gonna have to be tough as nails to be a business owner, so get started by telling, not asking, your dad. Be prepared for him to object, and if he does, tell him he’ll get used to it with time.
Aunt Pythia
——
Aunt Pythia,
I’m a philosophy grad school dropout turned programmer who hasn’t done math since high school. But I want to learn, partly for professional reasons but mainly out of curiosity. I recently bought *Proofs From the Book* but found that I lacked the requisite mathematical maturity to work through much of it. Where should I start? What should I read? (p.s. Thanks for the entertaining blog!)
Confused in Brooklyn
Readers, this question is for you! I don’t know of too many good basic math books, so Confused in Brooklyn is counting on you. There have actually been lots of people asking similar questions, so you’d be helping them too. If I get enough good suggestions I’ll create a separate reading list for cool math page on mathbabe. Thanks in advance for your suggestions!
——
Please take a moment to ask me a question:
It’s Pro-American to be Anti-Christmas
This is a guest post by Becky Jaffe.
I know what you’re thinking: Don’t Christmas and America go together like Santa and smoking?
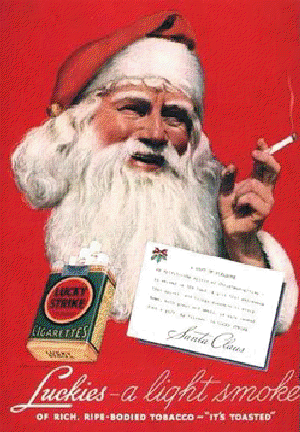
Why, of course they do! Just ask Saint Nickotine, patron saint of profit. This Lucky Strike advertisement is an early introduction to Santa the corporate shill, the seasonal cash cow whose avuncular mug endorses everything from Coca-Cola to Siri to yes, even competing brands of cigarettes like Pall Mall. Sorry Lucky Strike, Santa’s a bit of a sellout.

Nearly a century after these advertisements were published, the secular trinity of Santa, consumerism and America has all but supplanted the holy trinity the holiday was purportedly created to commemorate. I’ll let Santa the Spokesmodel be the cheerful bearer of bad news:

Christmas and consumerism have been boxed up, gift-wrapped and tied with a red-white-and-blue ribbon. In this guest post I’ll unwrap this package and explain why I, for one, am not buying it.
____________________
Yesterday was Thanksgiving, followed inexorably by Black Friday; one day we’re collectively meditating on gratitude, the next we’re jockeying for position in line to buy a wall-mounted 51” plasma HDTV. Some would argue that’s quintessentially American. As social critic and artist Andy Warhol wryly observed, “Shopping is more American than thinking.”
Such a dour view may accurately describe post WW II America, but not the larger trends nor longer traditions of our nation’s history. Although we may have become profligate of late, we were at the outset a frugal people; consumerism and America need not be inextricably linked in our collective imagination if we take a longer view. Long before there was George Bush telling us the road to recovery was to have faith in the American economy, there was Henry David Thoreau, who spoke to a faith in a simpler economy:
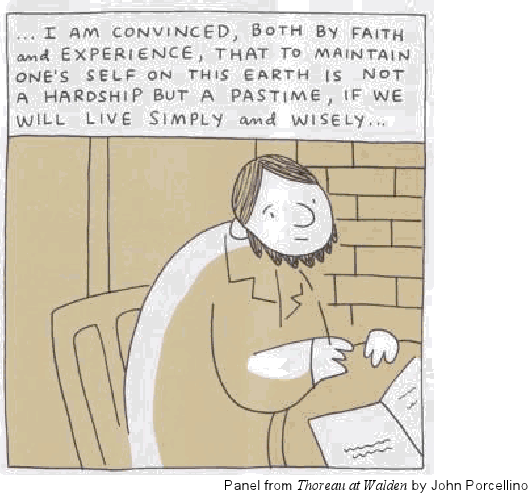
The Simple Living experiment he undertook and chronicled in his classic Walden was guided by values shared in common by many of the communities who sought refuge in the American colonies at the outset of our nation: the Mennonites, the Quakers, and the Shakers. These groups comprise not only a great name for a punk band, but also our country’s temperamental and ethical ancestry. The contemporary relationship between consumerism and Christmas is decidedly un-American, according to our nation’s founders. And what could be more American than the Amish? Or the secular version thereof: The Simplicity Collective.
Being anti-Christmas™ is as uniquely American as Thoreau, who summed up his anti-consumer credo succinctly: “Men have become the tools of their tools.” If he were alive today, I have no doubt that curmudgeonly minimalist would be marching with Occupy Wall Street instead of queuing with the tools on Occupy Mall Street.
Being anti-Christmas™ is as American as Mark Twain, who wrote, “The approach of Christmas brings harrassment and dread to many excellent people. They have to buy a cart-load of presents, and they never know what to buy to hit the various tastes; they put in three weeks of hard and anxious work, and when Christmas morning comes they are so dissatisfied with the result, and so disappointed that they want to sit down and cry. Then they give thanks that Christmas comes but once a year.” (From Following the Equator)
Being anti-Christmas™ is as American as “Oklahoma’s favorite son,” Will Rogers, 1920’s social commentator who made the acerbic observation, “Too many people spend money they haven’t earned, to buy things they don’t want, to impress people they don’t like.”
He may have been referring to presents like this, which are just, well, goyish:

Being anti-Christmas is as American as Robert Frost, recipient of four Pulitzer prizes in poetry, who had this to say in a Christmas Circular Letter:
He asked if I would sell my Christmas trees;
My woods—the young fir balsams like a place
Where houses all are churches and have spires.
I hadn’t thought of them as Christmas Trees.
I doubt if I was tempted for a moment
To sell them off their feet to go in cars
And leave the slope behind the house all bare,
Where the sun shines now no warmer than the moon.
I’d hate to have them know it if I was.
Yet more I’d hate to hold my trees except
As others hold theirs or refuse for them,
Beyond the time of profitable growth,
The trial by market everything must come to.
We inherit from these American thinkers a unique intellectual legacy that might make us pause at the commercialism that has come to consume us. To put it in other words:
- John Porcellino’s Thoreau at Walden: $18
- Walt Whitman’s Leaves of Grass: $5.95
- Mary Oliver’s American Primitive: $9.99
- The Life and Letters of John Muir: $12.99
- Transcendentalist Intellectual Legacy: Priceless.
The intellectual and spiritual founders of our country caution us to value our long-term natural resources over short-term consumptive titillation. Unheeding their wisdom, last year on Black Friday American consumers spent $11.4 billion, more than the annual Gross Domestic Product of 73 nations.
And American intellectual legacy aside, isn’t that a good thing? Doesn’t Christmas spending stimulate our stagnant economy and speed our recovery from the recession? If you believe organizations like Made in America, it’s our patriotic duty to spend money over the holidays. The exhortation from their website reads, “If each of us spent just $64 on American made goods during our holiday shopping, the result would be 200,000 new jobs. Now we want to know, are you in?”
That depends once again on whether or not we take the long view. Christmas spending might create a few temporary, low-wage, part-time jobs without benefits of the kind described in Barbara Ehrenreich’s Nickel and Dimed: On (Not) Getting By In America, but it’s not likely to create lasting economic health, especially if we fail to consider the long-term environmental and social costs of our short-term consumer spending sprees. The answer to Made in America’s question depends on the validity of the economic model we use to assess their spurious claim, as Mathbabe has argued time and again in this blog. The logic of infinite growth as an unequivocal net good is the same logic that underlies such flawed economic models as the Gross National Product (GNP) and the Gross Domestic Product (GDP).
These myopic measures fail to take into account the value of the natural resources from which our consumer products are manufactured. In this accounting system, when an old-growth forest is clearcut to make way for a Best Buy parking lot, that’s counted as an unequivocal economic boon since the economic value of the lost trees/habitat is not considered as a debit. Feminist economist and former New Zealand parliamentarian Marilyn Waring explains the idea accessibly in this documentary: Who’s Counting? Marilyn Waring on Sex, Lies, and Global Economics.
If we were to adopt a model that factors in the lost value of nonrenewable natural resources, such as the proposed Green National Product, we might skip the stampede at Walmart and go for a walk in the woods instead to stimulate the economy.
Other critics of these standard models for measuring economic health point out that they overvalue quantity of production and, by failing to take into account such basic measures of economic health as wealth distribution, undervalue quality of life. And the growing gap in income inequality is a trend that we cannot afford to overlook as we consider the best options for economic recovery. According to this New York Times article, “Income inequality has soared to the highest levels since the Great Depression, and the recession has done little to reverse the trend, with the top 1 percent of earners taking 93 percent of the income gains in the first full year of the recovery.”
For the majority of Americans who are still struggling to make ends meet, the Black Friday imperative to BUY! means racking up more credit card debt. (As American poet ee cummings quipped,” “I’m living so far beyond my income that we may almost be said to be living apart.”) The specter of Christmas spending is particularly ominous this season, during a recession, after a national wave of foreclosures has left Americans with insecure housing, exorbitant rents, and our beleaguered Santa with fewer chimneys to squeeze into.
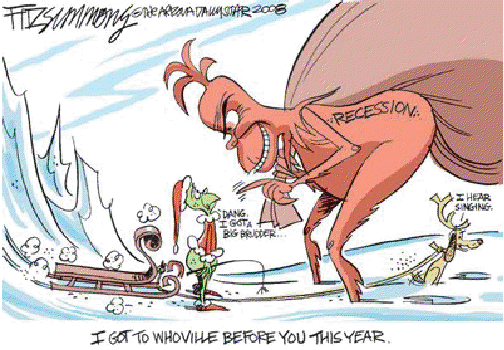
Some proposed alternatives to the GDP and GNP that factor in income distribution are the Human Progress Index, the Genuine Progress Indicator, and yes, even a proposed Gross National Happiness.

A dose of happiness could be just the antidote to the dread many Americans feel at the prospect of another hectic holiday season. As economist Paul Heyne put it, “The gap in our economy is between what we have and what we think we ought to have – and that is a moral problem, not an economic one.”
____________________
Mind you, I’m not anti-Christmas, just anti-Christmas™. I’ve been referring thus far to the secular rites of the latter, but practicing Christians for whom the former is a meaningful spiritual meditation might equally take offense at its runaway commercialization, which the historical Jesus would decidedly not have endorsed.

I hate to pull the Bible card, but, seriously, what part of Ecclesiastes don’t you understand?

Photo by Becky Jaffe. http://www.beckyjaffe.com
Better is an handful with quietness, than both the hands full with travail and vexation of spirit. – Ecclesiastes 4:6
Just imagine if Buddhism were hijacked by greed in the same fashion.
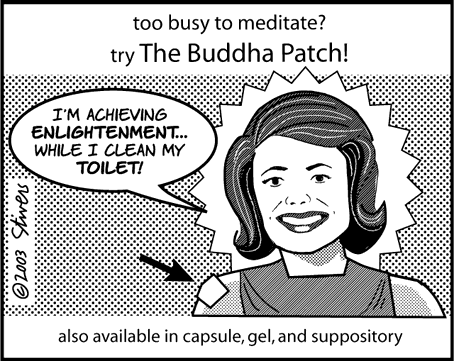
After all,

Right?
Or is it axial tilt?

Whether you’re a practicing Christian, a Born-Again Pagan celebrating the Winter Solstice (“Mithras is the Reason for the Season”), or a fundamentalist atheist (“You know it’s a myth! This season, celebrate reason.”), we all have reason to be concerned about the corporatization of our cultural rituals.
The meaning of Christmas has gotten lost in translation:

So this year, let’s give Santa a much-needed smoke break, pour him a glass of Kwanzaa Juice, and consider these alternatives for a change:
1. Presence, not presents. Skip the spending binge (and maybe even another questionable Christmas tradition, the drinking binge), and give the gift of time to the people you love. I’m talking luxurious swaths of time: unstructured time, unproductive time, time wasted exquisitely together.
I’m talking about turning off the television in preparation for Screen-Free Week 2013, and going for a slow walk in nature, which can create more positive family connection than the harried shopping trip. And if Richard Louv’s thesis about Nature Deficit Disorder is merited, it may be healthier for your child to take a walk in the woods than to camp out in front of the X-Box you can’t afford anyway.
Whether you’re choosing to spend the holidays with your family of origin or your family of choice, playing a game together is a great way to reconnect. How about kibitzing over this new card game 52 Shades of Greed? It’s quite the conversation starter. And what better soundtrack for a card game than Sweet Honey in the Rock’s musical musings on Greed? Or Tracy Chapman’s Mountains of Things.
Or how about seeing a show together? You can take the whole family to see Reverend Billy and the Church of Stop Shopping at the Highline Ballroom in New York this Sunday, November 25th. He’s on a “mission to save Christmas from the Shopocalypse.” From the makers of the film What Would Jesus Buy?
2. Give a group gift. There is a lot of talk about family values, but how well do we know each other’s values? One way to find out is to pool our giving together and decide as a group who the beneficiaries should be. You might elect to skip Black Friday and Cyber Monday and make a donation instead to Giving Tuesday’s Hurricane Sandy relief efforts. Other organizations worth considering:
3. Think outside the box. If you’re looking for alternatives to the gift-giving economy, how about bartering? Freecycle is a grassroots organization that puts a tourniquet on the flow of luxury goods destined for the landfill by creating local voluntary swap networks.
Or how about giving the gift of debt relief? Check out the Rolling Jubilee, a “bailout for the people by the people.”
4. Give the Buddhist gift: Nothing!
Buy Nothing Do Something is the slogan of an organization proposing an alternative to Black Friday: On Brave Friday, we “choose family over frenzy.” One contributor to the project shared this family tradition: “We have a “Five Hands” gift giving policy. We can exchange items that are HANDmade (by us), HAND-me-down and secondHAND. We can choose to gift a helping HAND (donations to charities). Lastly and my favorite, we can gift a HAND-in-hand, which is a dedication of time spent with one another. (Think date night or a day at the museum as a family.)”
Adbusters magazine sponsors an annual boycott of consumerism in England called Buy Nothing Day.

5. Invent your own holiday. Americans pride ourselves on our penchant for innovation. We amalgamate and synthesize novelty out of eclectic sources. Although we often talk about “traditional values,” we’re on the whole much less tradition-bound than say, the Serbs, who collectively recall several thousand years of history as relevant to the modern instant. We tend to abandon tradition when it is incovenient (e.g. marriage), which is perhaps why we harken back to its fantasy status in such a treacly manner. Making stuff up is what we do well as a nation. Isn’t “DIY Christmas” a no-brainer? Happy Christmahannukwanzaka, y’all!
6. Keep it weird. Several of you wrote with these suggestions for Black Friday street theater:
“Someone said go for a hike in a park, not the Wal*Mart parking lot. But why not the Wal*Mart parking lot? With all your hiking gear and everything.”
“I’d love for 5-6 of us to sit at Union Square in front of Macy’s and sit and meditate. Perhaps passer-bys will take a notice and ponder. Anyone in? Friday 2-3 hours.”
Few pranksters have been so elaborate in their anti-corporate antics as the Yes Men. You may get inspired to come up with some political theater of your own after watching the documentary The Yes Men: The True Story of the End of the World Trade Organization.
____________________
However we choose to celebrate the holidays in this relativist pluralistic era, whatever our preferred religious and/or cultural December-based holiday celebration may be, we can disentangle our rituals from obligatory consumerism.
I’m not suggesting this is an easy task. Our consumer habits are wrapped up with our identities as social critic Alain de Botton observes: “We need objects to remind us of the commitments we’ve made. That carpet from Morocco reminds us of the impulsive, freedom-loving side of ourselves we’re in danger of losing touch with. Beautiful furniture gives us something to live up to. All designed objects are propaganda for a way of life.”
This year, let’s skip the propaganda.
We can choose to

Yes, we can.
Happy Solstice, everyone!
(If only I had a Celestron CPC 1100 Telescope with Nikon D700 DSLR adapter to admire the Solstice skies….)
A primer on time wasting
Hello, Aaron here.
Cathy asked me to write a post about wasting time. But I never got around to it.
Just kidding. I’m actually doing it.
Things move fast here in New York City, but where the hell is everyone going anyway?
When I was writing my dissertation, I lived on the west coast and Cathy lived on the east coast. I used to get up around 7 every morning. She was very pregnant (for the first time), and I was very stressed out. We talked on the phone every morning, and we got in the habit of doing the New York Times crossword puzzle. Mind you, this was before it was online – she actually had a newspaper, with ink and everything, and she read me the clues over the phone and we did the puzzle together. It helped get me going in the morning, and it warmed me up for dissertation writing.
After a long time of not doing crossword puzzles, I’ve taken it up again in recent years. Sometimes Cathy and I do it together, online, using the app where two people can solve it at the same time. [NYT, if you’re listening, the new version is much worse than the old! Gotta fix up the interfacing.] Sometimes I do it myself. Sometimes, like today, it’s Thanksgiving, and it’s a real treat to do the puzzle with Cathy in person. But one way or another, I do it just about every day.
At one point, early in the current phase of my habit, I got stuck and I wanted to cheat. I looked for the answers online, since I couldn’t just wait until the next day. I came across this blog, which I call rexword for short.
I got addicted. As happens so frequently with the internets, I discovered an entire community of people who are both really into something mildly obscure (read: nerdy) and also actually insightful, funny, and interesting (read: nerdy).
I’ve learned a lot about puzzling from rexword. I like to tell my students they have to learn how to get “behind” what I write on the chalkboard, to see it before it’s being written or as it’s being written as if they were doing it themselves, the way a musician hears music or the way anyone does anything at an expert level. Rex’s blog took me behind the crossword puzzle for the first time. I’m nowhere near as good at it as he is, or as many of his readers seem to be, but seeing it from the other side is a lot of fun. I appreciate puzzles in a completely different way now: I no longer just try to complete it (which is still a challenge a lot of the time, e.g. most Saturdays), but I look it over and imagine how it might have been different or better or whatever. Then, especially if I think there’s something especially notable about it, I go to the blog expecting some amusing discussion.
Usually I find it. In fact, usually I find amusing discussion and insights about way more things than I would ever notice myself about the puzzle. I also find hilarious things like this:
We just did last Sunday’s puzzle, and at the end we noticed that the completed puzzle contained all of the following: g-spot, tits, ass, cock. Once upon a time I might not have thought much of this (or noticed) but now my reaction was, “I bet there’s something funny about this on the blog.” I was sure this would be amply noted and wittily de- and re-constructed. In fact, it barely got a mention, although predictably, several commenters picked up the slack.
Anyway, I’ve got this particular addiction under control – I no longer read the blog every day, but as I said, when there’s something notable or funny I usually check it out and sometimes comment myself, if no one else seems to have noticed whatever I found.
What is the point of all this? In case you forgot, Cathy asked me to write about wasting time. I think she made this request because of the relish with which I tread the fine line between being super nerdy about something and just wasting time (don’t get me started about the BCS….).
Today, I am especially thankful to be alive and in such a luxurious condition that I can waste time doing crossword puzzles, and then reading blogs about doing crossword puzzles, and then writing blogs about reading blogs about doing crossword puzzles.
Happy Thanksgiving everyone.
Black Friday resistance plan
The hype around Black Friday is building. It’s reaching its annual fever pitch. Let’s compare it to something much less important to americans like “global warming”, shall we? Here we go:
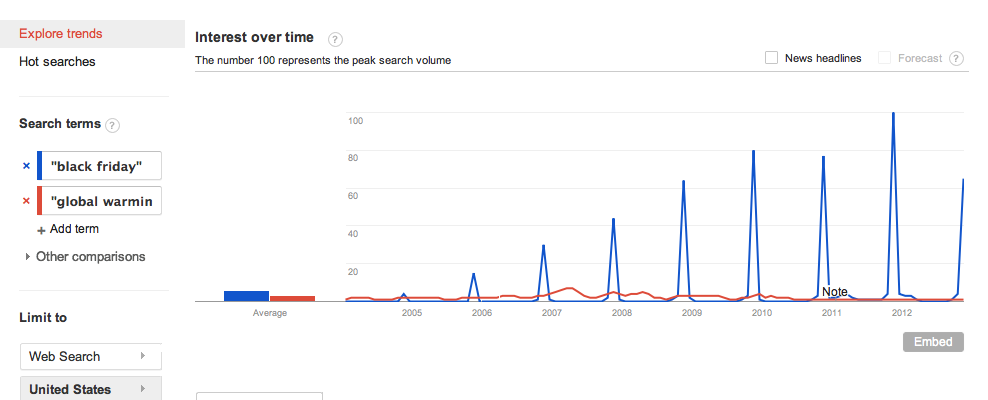
Note how, as time passes, we become more interested in Black Friday and less interested in global warming.
How do you resist, if not the day itself, the next few weeks of crazy consumerism that is relentlessly plied? Lots of great ideas were posted here, when I first wrote about this. There will be more coming soon.
In the meantime, here’s one suggestion I have, which I use all the time to avoid over-buying stuff and which this Jane Brody article on hoarding reminded me of.
Mathbabe’s Black Friday Resistance plan, step 1:
Go through your closets and just look at all the stuff you already have. Go through your kids’ closets and shelves and books and toychests to catalog their possessions. Count how many appliances you own, in your kitchen alone.
Be amazed that anyone could ever own that much stuff, and think about what we really need to survive, and indeed, what we really need to be content.
In case you need more, here’s an optional step 2. Think about the Little House on the Prairie series, and how Laura made a doll out of scraps of cloth left over from the dresses, and how once a year when Pa sold his crop they’d have penny candy and it would be a huge treat. For Christmas one year, Laura got an orange. Compared to that we binge on consumerism on a daily basis and we’ve become enured to its effects.
Now, I’m not a huge fan of going back to those roots entirely. After all, during The Long Winter, as I’m sure you recall and which was very closely based on her real experience, Mary went blind from hunger and Carrie was permanently affected. If it hadn’t been for Almonzo coming to their rescue with food for the whole town, many might have died. Now that was a man.
I think we need a bit more insurance than that. Even so, we might have all the material possessions we need for now.
Columbia Data Science course, week 12: Predictive modeling, data leakage, model evaluation
This week’s guest lecturer in Rachel Schutt’s Columbia Data Science class was Claudia Perlich. Claudia has been the Chief Scientist at m6d for 3 years. Before that she was a data analytics group at the IBM center that developed Watson, the computer that won Jeopardy!, although she didn’t work on that project. Claudia got her Ph.D. in information systems at NYU and now teaches a class to business students in data science, although mostly she addresses how to assess data science work and how to manage data scientists. Claudia also holds a masters in Computer Science.
Claudia is a famously successful data mining competition winner. She won the KDD Cup in 2003, 2007, 2008, and 2009, the ILP Challenge in 2005, the INFORMS Challenge in 2008, and the Kaggle HIV competition in 2010.
She’s also been a data mining competition organizer, first for the INFORMS Challenge in 2009 and then for the Heritage Health Prize in 2011. Claudia claims to be retired from competition.
Claudia’s advice to young people: pick your advisor first, then choose the topic. It’s important to have great chemistry with your advisor, and don’t underestimate the importance.
Background
Here’s what Claudia historically does with her time:
- predictive modeling
- data mining competitions
- publications in conferences like KDD and journals
- talks
- patents
- teaching
- digging around data (her favorite part)
Claudia likes to understand something about the world by looking directly at the data.
Here’s Claudia’s skill set:
- plenty of experience doing data stuff (15 years)
- data intuition (for which one needs to get to the bottom of the data generating process)
- dedication to the evaluation (one needs to cultivate a good sense of smell)
- model intuition (we use models to diagnose data)
Claudia also addressed being a woman. She says it works well in the data science field, where her intuition is useful and is used. She claims her nose is so well developed by now that she can smell it when something is wrong. This is not the same thing as being able to prove something algorithmically. Also, people typically remember her because she’s a woman, even when she don’t remember them. It has worked in her favor, she says, and she’s happy to admit this. But then again, she is where she is because she’s good.
Someone in the class asked if papers submitted for journals and/or conferences are blind to gender. Claudia responded that it was, for some time, typically double-blind but now it’s more likely to be one-sided. And anyway there was a cool analysis that showed you can guess who wrote a paper with 80% accuracy just by knowing the citations. So making things blind doesn’t really help. More recently the names are included, and hopefully this doesn’t make things too biased. Claudia admits to being slightly biased towards institutions – certain institutions prepare better work.
Skills and daily life of a Chief Data Scientist
Claudia’s primary skills are as follows:
- Data manipulation: unix (sed, awk, etc), Perl, SQL
- Modeling: various methods (logistic regression, nearest neighbors, k-nearest neighbors, etc)
- Setting things up
She mentions that the methods don’t matter as much as how you’ve set it up, and how you’ve translated it into something where you can solve a question.
More recently, she’s been told that at work she spends:
- 40% of time as “contributor”: doing stuff directly with data
- 40% of time as “ambassador”: writing stuff, giving talks, mostly external communication to represent m6d, and
- 20% of time in “leadership” of her data group
At IBM it was much more focused in the first category. Even so, she has a flexible schedule at m6d and is treated well.
The goals of the audience
She asked the class, why are you here? Do you want to:
- become a data scientist? (good career choice!)
- work with data scientist?
- work for a data scientist?
- manage a data scientist?
Most people were trying their hands at the first, but we had a few in each category.
She mentioned that it matters because the way she’d talk to people wanting to become a data scientist would be different from the way she’d talk to someone who wants to manage them. Her NYU class is more like how to manage one.
So, for example, you need to be able to evaluate their work. It’s one thing to check a bubble sort algorithm or check whether a SQL server is working, but checking a model which purports to give the probability of people converting is different kettle of fish.
For example, try to answer this: how much better can that model get if you spend another week on it? Let’s face it, quality control is hard for yourself as a data miner, so it’s definitely hard for other people. There’s no easy answer.
There’s an old joke that comes to mind: What’s the difference between the scientist and a consultant? The scientists asks, how long does it take to get this right? whereas the consultant asks, how right can I get this in a week?
Insights into data
A student asks, how do you turn a data analysis into insights?
Claudia: this is a constant point of contention. My attitude is: I like to understand something, but what I like to understand isn’t what you’d consider an insight. My message may be, hey you’ve replaced every “a” by a “0”, or, you need to change the way you collect your data. In terms of useful insight, Ori’s lecture from last week, when he talked about causality, is as close as you get.
For example, decision trees you interpret, and people like them because they’re easy to interpret, but I’d ask, why does it look like it does? A slightly different data set would give you a different tree and you’d get a different conclusion. This is the illusion of understanding. I tend to be careful with delivering strong insights in that sense.
For more in this vein, Claudia suggests we look at Monica Rogati‘s talk “Lies, damn lies, and the data scientist.”
Data mining competitions
Claudia drew a distinction between different types of data mining competitions.
On the one hand you have the “sterile” kind, where you’re given a clean, prepared data matrix, a standard error measure, and where the features are often anonymized. This is a pure machine learning problem.
Examples of this first kind are: KDD Cup 2009 and 2011 (Netflix). In such competitions, your approach would emphasize algorithms and computation. The winner would probably have heavy machines and huge modeling ensembles.
On the other hand, you have the “real world” kind of data mining competition, where you’re handed raw data, which is often in lots of different tables and not easily joined, where you set up the model yourself and come up with task-specific evaluations. This kind of competition simulates real life more.
Examples of this second kind are: KDD cup 2007, 2008, and 2010. If you’re competing in this kind of competition your approach would involve understanding the domain, analyzing the data, and building the model. The winner might be the person who best understands how to tailor the model to the actual question.
Claudia prefers the second kind, because it’s closer to what you do in real life. In particular, the same things go right or go wrong.
How to be a good modeler
Claudia claims that data and domain understanding is the single most important skill you need as a data scientist. At the same time, this can’t really be taught – it can only be cultivated.
A few lessons learned about data mining competitions that Claudia thinks are overlooked in academics:
- Leakage: the contestants best friend and the organizers/practitioners worst nightmare. There’s always something wrong with the data, and Claudia has made an artform of figuring out how the people preparing the competition got lazy or sloppy with the data.
- Adapting learning to real-life performance measures beyond standard measures like MSE, error rate, or AUC (profit?)
- Feature construction/transformation: real data is rarely flat (i.e. given to you in a beautiful matrix) and good, practical solutions for this problem remains a challenge.
Leakage
Leakage refers to something that helps you predict something that isn’t fair. It’s a huge problem in modeling, and not just for competitions. Oftentimes it’s an artifact of reversing cause and effect.
Example 1: There was a competition where you needed to predict S&P in terms of whether it would go up or go down. The winning entry had a AUC (area under the ROC curve) of 0.999 out of 1. Since stock markets are pretty close to random, either someone’s very rich or there’s something wrong. There’s something wrong.
In the good old days you could win competitions this way, by finding the leakage.
Example 2: Amazon case study: big spenders. The target of this competition was to predict customers who spend a lot of money among customers using past purchases. The data consisted of transaction data in different categories. But a winning model identified that “Free Shipping = True” was an excellent predictor
What happened here? The point is that free shipping is an effect of big spending. But it’s not a good way to model big spending, because in particular it doesn’t work for new customers or for the future. Note: timestamps are weak here. The data that included “Free Shipping = True” was simultaneous with the sale, which is a no-no. We need to only use data from beforehand to predict the future.
Example 3: Again an online retailer, this time the target is predicting customers who buy jewelry. The data consists of transactions for different categories. A very successful model simply noted that if sum(revenue) = 0, then it predicts jewelry customers very well?
What happened here? The people preparing this data removed jewelry purchases, but only included people who bought something in the first place. So people who had sum(revenue) = 0 were people who only bought jewelry. The fact that you only got into the dataset if you bought something is weird: in particular, you wouldn’t be able to use this on customers before they finished their purchase. So the model wasn’t being trained on the right data to make the model useful. This is a sampling problem, and it’s common.
Example 4: This happened at IBM. The target was to predict companies who would be willing to buy “websphere” solutions. The data was transaction data + crawled potential company websites. The winning model showed that if the term “websphere” appeared on the company’s website, then they were great candidates for the product.
What happened? You can’t crawl the historical web, just today’s web.
Thought experiment
You’re trying to study who has breast cancer. The patient ID, which seemed innocent, actually has predictive power. What happened?

In the above image, red means cancerous, green means not. it’s plotted by patient ID. We see three or four distinct buckets of patient identifiers. It’s very predictive depending on the bucket. This is probably a consequence of using multiple databases, some of which correspond to sicker patients are more likely to be sick.
A student suggests: for the purposes of the contest they should have renumbered the patients and randomized.
Claudia: would that solve the problem? There could be other things in common as well.
A student remarks: The important issue could be to see the extent to which we can figure out which dataset a given patient came from based on things besides their ID.
Claudia: Think about this: what do we want these models for in the first place? How well can you predict cancer?
Given a new patient, what would you do? If the new patient is in a fifth bin in terms of patient ID, then obviously don’t use the identifier model. But if it’s still in this scheme, then maybe that really is the best approach.
This discussion brings us back to the fundamental problem that we need to know what the purpose of the model is and how is it going to be used in order to decide how to do it and whether it’s working.
Pneumonia
During an INFORMS competition on pneumonia predictions in hospital records, where the goal was to predict whether a patient has pneumonia, a logistic regression which included the number of diagnosis codes as a numeric feature (AUC of 0.80) didn’t do as well as the one which included it as a categorical feature (0.90). What’s going on?
This had to do with how the person prepared the data for the competition:

The diagnosis code for pneumonia was 486. So the preparer removed that (and replaced it by a “-1”) if it showed up in the record (rows are different patients, columns are different diagnoses, there are max 4 diagnoses, “-1” means there’s nothing for that entry).
Moreover, to avoid telling holes in the data, the preparer moved the other diagnoses to the left if necessary, so that only “-1″‘s were on the right.
There are two problems with this:
- If the column has only “-1″‘s, then you know it started out with only pneumonia, and
- If the column has no “-1″‘s, you know there’s no pneumonia (unless there are actually 5 diagnoses, but that’s less common).
This was enough information to win the competition.
Note: winning competition on leakage is easier than building good models. But even if you don’t explicitly understand and game the leakage, your model will do it for you. Either way, leakage is a huge problem.
How to avoid leakage
Claudia’s advice to avoid this kind of problem:
- You need a strict temporal cutoff: remove all information just prior to the event of interest (patient admission).
- There has to be a timestamp on every entry and you need to keep
- Removing columns asks for trouble
- Removing rows can introduce inconsistencies with other tables, also causing trouble
- The best practice is to start from scratch with clean, raw data after careful consideration
- You need to know how the data was created! I only work with data I pulled and prepared myself (or maybe Ori).
Evaluations
How do I know that my model is any good?
With powerful algorithms searching for patterns of models, there is a serious danger of over fitting. It’s a difficult concept, but the general idea is that “if you look hard enough you’ll find something” even if it does not generalize beyond the particular training data.
To avoid overfitting, we cross-validate and we cut down on the complexity of the model to begin with. Here’s a standard picture (although keep in mind we generally work in high dimensional space and don’t have a pretty picture to look at):

The picture on the left is underfit, in the middle is good, and on the right is overfit.
The model you use matters when it concerns overfitting:

So for the above example, unpruned decision trees are the most over fitting ones. This is a well-known problem with unpruned decision trees, which is why people use pruned decision trees.
Accuracy: meh
Claudia dismisses accuracy as a bad evaluation method. What’s wrong with accuracy? It’s inappropriate for regression obviously, but even for classification, if the vast majority is of binary outcomes are 1, then a stupid model can be accurate but not good (guess it’s always “1”), and a better model might have lower accuracy.
Probabilities matter, not 0’s and 1’s.
Nobody makes decisions on binary outcomes. I want to know the probability I have breast cancer, I don’t want to be told yes or no. It’s much more information. I care about probabilities.
How to evaluate a probability model
We separately evaluate the ranking and the calibration. To evaluate the ranking, we use the ROC curve and calculate the area under it, typically ranges from 0.5-1.0. This is independent of scaling and calibration. Here’s an example of how to draw an ROC curve:

Sometimes to measure rankings, people draw the so-called lift curve:

The key here is that the lift is calculated with respect to a baseline. You draw it at a given point, say 10%, by imagining that 10% of people are shown ads, and seeing how many people click versus if you randomly showed 10% of people ads. A lift of 3 means it’s 3 times better.
How do you measure calibration? Are the probabilities accurate? If the model says probability of 0.57 that I have cancer, how do I know if it’s really 0.57? We can’t measure this directly. We can only bucket those predictions and then aggregately compare those in that prediction bucket (say 0.50-0.55) to the actual results for that bucket.
For example, here’s what you get when your model is an unpruned decision tree, where the blue diamonds are buckets:
 A good model would show buckets right along the x=y curve, but here we’re seeing that the predictions were much more extreme than the actual probabilities. Why does this pattern happen for decision trees?
Claudia says that this is because trees optimize purity: it seeks out pockets that have only positives or negatives. Therefore its predictions are more extreme than reality. This is generally true about decision trees: they do not generally perform well with respect to calibration.
Logistic regression looks better when you test calibration, which is typical:

Takeaways:
- Accuracy is almost never the right evaluation metric.
- Probabilities, not binary outcomes.
- Separate ranking from calibration.
- Ranking you can measure with nice pictures: ROC, lift
- Calibration is measured indirectly through binning.
- Different models are better than others when it comes to calibration.
- Calibration is sensitive to outliers.
- Measure what you want to be good at.
- Have a good baseline.
Choosing an algorithm
This is not a trivial question and in particular small tests may steer you wrong, because as you increase the sample size the best algorithm might vary: often decision trees perform very well but only if there’s enough data.
In general you need to choose your algorithm depending on the size and nature of your dataset and you need to choose your evaluation method based partly on your data and partly on what you wish to be good at. Sum of squared error is maximum likelihood loss function if your data can be assumed to be normal, but if you want to estimate the median, then use absolute errors. If you want to estimate a quantile, then minimize the weighted absolute error.
We worked on predicting the number of ratings of a movie will get in the next year, and we assumed a poisson distributions. In this case our evaluation method doesn’t involve minimizing the sum of squared errors, but rather something else which we found in the literature specific to the Poisson distribution, which depends on the single parameter 

Charity direct mail campaign
Let’s put some of this together.
Say we want to raise money for a charity. If we send a letter to every person in the mailing list we raise about $9000. We’d like to save money and only send money to people who are likely to give – only about 5% of people generally give. How can we do that?
If we use a (somewhat pruned, as is standard) decision tree, we get $0 profit: it never finds a leaf with majority positives.
If we use a neural network we still make only $7500, even if we only send a letter in the case where we expect the return to be higher than the cost.
This looks unworkable. But if you model is better, it’s not. A person makes two decisions here. First, they decide whether or not to give, then they decide how much to give. Let’s model those two decisions separately, using:

Note we need the first model to be well-calibrated because we really care about the number, not just the ranking. So we will try logistic regression for first half. For the second part, we train with special examples where there are donations.
Altogether this decomposed model makes a profit of $15,000. The decomposition made it easier for the model to pick up the signals. Note that with infinite data, all would have been good, and we wouldn’t have needed to decompose. But you work with what you got.
Moreover, you are multiplying errors above, which could be a problem if you have a reason to believe that those errors are correlated.
Parting thoughts
We are not meant to understand data. Data are outside of our sensory systems and there are very few people who have a near-sensory connection to numbers. We are instead meant to understand language.
We are not mean to understand uncertainty: we have all kinds of biases that prevent this from happening and are well-documented.
Modeling people in the future is intrinsically harder than figuring out how to label things that have already happened.
Even so we do our best, and this is through careful data generation, careful consideration of what our problem is, making sure we model it with data close to how it will be used, making sure we are optimizing to what we actually desire, and doing our homework in learning which algorithms fit which tasks.
Whither the fake clicks?
My friend Ori explained to me last week about where all those fake clicks are coming from and going to and why. He blogged about it on m6d’s website.
As usual, it’s all about incentives. They’re gaming the online advertising model for profit.
To understand the scam, the first thing to know is that advertisers bid for placement on websites, and they bid higher if they think high quality people will see their ad and if they think a given website is well-connected in the larger web.
Say you want that advertising money. You set up a website for the express purpose of selling ads to the people who come to your website.
First, if your website gets little or no traffic, nobody is willing to bid up that advertising. No problem, just invent robots that act like people clicking.
Next, this still wouldn’t work if your website seems unconnected to the larger web. So what these guy have done is to create hundreds if not thousands of websites, which just constantly shovel fake people around their own network from place to place. That creates the impression, using certain calculations of centrality, that these are very well connected websites.
Finally, you might ask how the bad guys convince advertisers that these robots are “high quality” clicks. Here they rely on the fact that advertisers use different definition of quality.
Whereas you might only want to count people as high quality if they actually buy your product, it’s often hard to know if that has happened (especially if it’s a store-bought item) so proxies are used instead. Often it’s as simple as whether the online user visits the website of the product, which of course can be done by robots instead.
So there it is, an entire phantom web set up just to game the advertisers’ bid system and collect ad money that should by all rights not exist.
Two comments:
- First, I’m not sure this is illegal. Which is not to say it’s unavoidable, because it’s not so hard to track if you’re fighting against it. The beginning of a very large war.
- Second, even if there weren’t this free-for-the-gaming advertiser money out there, there’d still be another group of people incentivized to create fake clicks. Namely, the advertisers give out bonuses to their campaign-level people based on click-through rates. So these campaign managers have a natural incentive to artificially inflate the click-through rates (which would work against their companies’ best interest to be sure). I’m not saying that those people are the architects of the fake clicks, just that they have incentive to be. In particular, they have no incentive to fix this problem.
Support Naked Capitalism
Crossposted on Naked Capitalism.
Being a quantitative, experiment-minded person, I’ve decided to go about helping Yves Smith raise funds for Naked Capitalism using the scientific approach.
After a bit of research on what makes people haul their asses off the couch to write checks, I stumbled upon this blogpost, from nonprofitquarterly.org, which explains that I should appeal to readers’ emotions rather than reason. From the post:
The essential difference between emotion and reason is that emotion leads to action, while reason leads to conclusions.
Let’s face it, regular readers of Naked Capitalism have come to enough conclusions to last a life time, and that’s why they come back for more! But now it’s time for action!
According to them, the leading emotions I should appeal to are as follows:
anger, fear, greed, guilt, flattery, exclusivity, and salvation.
This is a model. The model is that, if I appeal to the above emotions, you guys will write checks. Actually the barrier to entry is even lower, because it’s all done electronically through Paypal. So you can’t even use the excuse that you’ve run out of checks or have lost your pen in the cushions of your sofa.
Here’s the experiment. This time I’ll do my best to appeal to the above emotions. Next time, so a year from now, I’ll instead write a well-reasoned, well-articulated explanation of how reasonable it would be for you to donate some funds towards the continuation of Naked Capitalism.
I’ll do my best to give them both my best shot so as to keep the experiment unbiased, but note I’m choosing this method first.
Anger
This one is kind of too easy. How many time have you gotten extremely pissed off at yet another example of the regulators giving a pass at outright criminal behavior in the financial industry? And where do you go to join in a united chorus of vitriol? Who’s got your back on this, people? That’s right, Yves does.
Fear
Have you guys wondered what the consequences of fighting back for your rights are when you’re foreclosed on and feeling all along fighting against a big bank? Yves has got your back here too, and she helps explain your rights, she helps inspire you to fight, and she gives voice to the voiceless.
Greed
You know what’s amazing about NC? It’s free consulting. Yves has an amazing background and could be charging the very big bucks for this research, but instead she’s giving it away free. That’s like free money.
Guilt
And you know what else? The New York Times charges you for their news, and it’s not even high quality, it has no depth, and they don’t dare touch anything that might harm their comfortable liberal existence. Pussies. Oh wait, maybe that goes into the “anger” section.
Back to guilt: how much money do you regularly spend on crappy stuff that doesn’t actually improve your life and doesn’t inform and inspire you?
Flattery
You know what’s super sexy? You, giving a bit of your money to NC in thanks and appreciation. Hot.
Exclusivity
Not everyone can do this, you know. Only people who are invited even know about this. Which to say, anyone reading this right now, so you. You!
Salvation
Be honest. How much work did you do in the financial sector before you saw the light? Maybe you’re even still working in that cesspool! Maybe you’re even feeling sorry for yourself because your bonus is gonna be shit again this year. Well, it’s time for a wee reality check and some serious paying of the piper. Where by “the piper” I of course refer to Yves Smith of Naked Capitalism.
I believe there’s a way to give to the “Tip Jar” on the top right-hand corner of this page. It might even be filled out for you! Please feel free to add “0”‘s to that number on the right, before clicking the “donate” button. I know it will make you feel better to atone.
Aunt Pythia’s advice
Readers, one great thing about not collecting your email addresses when I collect your questions is that I can’t contact you to edit your questions down to reasonable size, so I just go ahead and do it myself. I hope you don’t mind.
Also, new this week: Aunt Pythia lets you answer a question! See below.
Finally, if you want to ask Aunt Pythia a question (please do, and thanks!), please find the form at the bottom.
—–
Dear Aunt Pythia,
Do you think that it makes sense that people in leadership position whose extramarital affair becomes uncovered should resign?
Alpha Liberal
Dear Alpha Liberal,
Here’s what I think. In thirty years, if we haven’t seen a politician naked, people will exclaim,
“Hey, What are you hiding? Where’s the dic pic??“
I know that’s not answering your question, but I think it’s gonna happen, and I wanted to mention it.
Going back to your question: I don’t think simply having an affair should be held against somebody. Sleeping around is far too common, possibly universally pervasive among successful, powerful people; it’s like firing someone for admitting they sometimes let the elevator close when they see someone coming. Everyone does it sometimes, it’s a way of letting out our urban aggression.
But possibly even that is not a great analogy, because it implies an ethically questionable act. For all we know, the politician (or anyone, really) has an open marriage and is just plain not being shady at all.
Having said that, we do need to be able to trust our leaders and the heads of secret service; we don’t want them to be blackmail-able and to do crazy things to hide their (possibly inevitable) affair. And by firing them for letting it out, we are just giving them an even stronger incentive to hide it under any condition.
My suggestion is this: only elect politicians who have already had an affair, admitted to them, and have kept their marriages intact. That way we know they can deal with those situations like grown-ups and the world isn’t going to end when it happens again next time.
I hope that helps,
Aunt Pythia
—–
Dear Aunt Pythia,
The mortgage interest deduction is a terrible regressive policy. How can I get my liberal friends question it? Or at least talk about it? Or am I wrong?
Big Bald Guy
Dear BBG,
First of all, I agree that it’s terrible. In terms of how to talk about it, I think it kind of depends on how much time you have and how nerdy they are, but try this and write back to give me feedback on whether it works.
Start the conversation by talking about any kind of governmental policy that fixes prices. So for example you can discuss the fact that the price of milk is set by the federal government (which doesn’t mean that the price is always low or affordable).
Ask your liberal friend, who does that benefit? Since it doesn’t apply to organic milk, the answer is the poor (note: a cursory look at the organic v. conventional milk production industry reveals that it’s insanely complicated and interesting and that I’d hate to be a dairy farmer).
Next, mention that the price of houses is fixed in the opposite direction, so higher, by dint of the mortgage tax deduction – it’s easier to pay the monthly mortgage bill after figuring the tax relief, so I can afford a larger price.
And who does that benefit? The people who own houses. Moreover, a family trying to buy a house in this system of inflated housing prices has to come up with a larger 20% downpayment than they otherwise would without it.
So in other words, it benefits already rich people, or people who can borrow from their rich friends for the downpayment, and it keeps the poor out of the market with a higher-than-reasonable obstacle of entry. Once you get them there, they might see it as a bad policy, or at least might admit they have a vested interest if they own a house themselves.
I hope that helps,
AP
—–
Dear Aunt Pythia,
I like the Rolling Jubilee idea in theory, but can’t get past the random purchase of the debt. I don’t like the idea of buying the debt of someone who made choices to live beyond their means. Where do you, personally, draw the line between anger at the banking policies and capitalist focus versus the need for individuals to be responsible for making decent decisions about their own lives?
Curious
Dear Curious,
Most people declaring bankruptcy because of their debt problems do so because of their medical debt. Most people who rack up credit card debt do so because their monthly bills and living expenses overwhelm them and they end up putting groceries on their credit cards.
I used to complain about people buying flat-screen TV’s for no good reason but I haven’t seen nearly as much of that behavior since the credit crisis, have you?
Aunt Pythia
—–
Aunt Pythia,
My loving, wonderful, caring boyfriend slurps his food. Not just soup — everything (even cereal!). Should I just deal with it, or say something? I think if I comment on it he’ll be offended, but I find it distracting during our meals together.
Food (Consumption) Critic
(Readers: please leave your answer as a comment below. I’ll choose my favorite for next week as well as answering the question myself.)
—–
O’Reilly book deal signed for “Doing Data Science”
I’m very happy to say I just signed a book contract with my co-author, Rachel Schutt, to publish a book with O’Reilly called Doing Data Science.
The book will be based on the class Rachel is giving this semester at Columbia which I’ve been blogging about here.
For those of you who’ve been reading along for free as I’ve been blogging it, there might not be a huge incentive to buy it, but I can promise you more and better math, more explicit usable formulas, some sample code, and an overall better and more thought-out narrative.
It’s supposed to be published in May with a possible early release coming up at the end of February, in time for the O’Reilly Strata Santa Clara conference, where Rachel will be speaking about it and about other stuff curriculum related. Hopefully people will pick it up in time to teach their data science courses in Fall 2013.
Speaking of Rachel, she’s also been selected to give a TedXWomen talk at Barnard on December 1st, which is super exciting. She’s talking about advocating for the social good using data. Unfortunately the event is invitation-only, otherwise I’d encourage you all to go and hear her words of wisdom. Update: word on the street is that it will be video-taped.
Columbia Data Science course, week 11: Estimating causal effects
The week in Rachel Schutt’s Data Science course at Columbia we had Ori Stitelman, a data scientist at Media6Degrees.
We also learned last night of a new Columbia course: STAT 4249 Applied Data Science, taught by Rachel Schutt and Ian Langmore. More information can be found here.
Ori’s background
Ori got his Ph.D. in Biostatistics from UC Berkeley after working at a litigation consulting firm. He credits that job with allowing him to understand data through exposure to tons of different data sets; since his job involved creating stories out of data to let experts testify at trials, e.g. for asbestos. In this way Ori developed his data intuition.
Ori worries that people ignore this necessary data intuition when they shove data into various algorithms. He thinks that when their method converges, they are convinced the results are therefore meaningful, but he’s here today to explain that we should be more thoughtful than that.
It’s very important when estimating causal parameters, Ori says, to understand the data-generating distributions and that involves gaining subject matter knowledge that allows you to understand if you necessary assumptions are plausible.
Ori says the first step in a data analysis should always be to take a step back and figure out what you want to know, write that down, and then find and use the tools you’ve learned to answer those directly. Later of course you have to decide how close you came to answering your original questions.
Thought Experiment
Ori asks, how do you know if your data may be used to answer your question of interest? Sometimes people think that because they have data on a subject matter then you can answer any question.
Students had some ideas:
- You need coverage of your parameter space. For example, if you’re studying the relationship between household income and holidays but your data is from poor households, then you can’t extrapolate to rich people. (Ori: but you could ask a different question)
- Causal inference with no timestamps won’t work.
- You have to keep in mind what happened when the data was collected and how that process affected the data itself
- Make sure you have the base case: compared to what? If you want to know how politicians are affected by lobbyists money you need to see how they behave in the presence of money and in the presence of no money. People often forget the latter.
- Sometimes you’re trying to measure weekly effects but you only have monthly data. You end up using proxies. Ori: but it’s still good practice to ask the precise question that you want, then come back and see if you’ve answered it at the end. Sometimes you can even do a separate evaluation to see if something is a good proxy.
- Signal to noise ratio is something to worry about too: as you have more data, you can more precisely estimate a parameter. You’d think 10 observations about purchase behavior is not enough, but as you get more and more examples you can answer more difficult questions.
Ori explains confounders with a dating example
Frank has an important decision to make. He’s perusing a dating website and comes upon a very desirable woman – he wants her number. What should he write in his email to her? Should he tell her she is beautiful? How do you answer that with data?
You could have him select a bunch of beautiful women and half the time chosen at random, tell them they’re beautiful. Being random allows us to assume that the two groups have similar distributions of various features (not that’s an assumption).
Our real goal is to understand the future under two alternative realities, the treated and the untreated. When we randomize we are making the assumption that the treated and untreated populations are alike.
OK Cupid looked at this and concluded:

But note:
- It could say more about the person who says “beautiful” than the word itself. Maybe they are otherwise ridiculous and overly sappy?
- The recipients of emails containing the word “beautiful” might be special: for example, they might get tons of email, which would make it less likely for Frank to get any response at all.
- For that matter, people may be describing themselves as beautiful.
Ori points out that this fact, that she’s beautiful, affects two separate things:
- whether Frank uses the word “beautiful” or not in his email, and
- the outcome (i.e. whether Frank gets the phone number).
For this reason, the fact that she’s beautiful qualifies as a confounder. The treatment is Frank writing “beautiful” in his email.
Causal graphs
Denote by 
Denote by 
Denote by 
We are forming the following causal graph:

In a causal graph, each arrow means that the ancestor is a cause of the descendent, where ancestor is the node the arrow is coming out of and the descendent is the node the arrow is going into (see this book for more).
In our example with Frank, the arrow from beauty means that the woman being beautiful is a cause of Frank writing “beautiful” in the message. Both the man writing “beautiful” and and the woman being beautiful are direct causes of her probability to respond to the message.
Setting the problem up formally
The building blocks in understanding the above causal graph are:
- Ask question of interest.
- Make causal assumptions (denote these by
).
- Translate question into a formal quantity (denote this by
).
- Estimate quantity (denote this by
).
We need domain knowledge in general to do this. We also have to take a look at the data before setting this up, for example to make sure we may make the
Positivity Assumption. We need treatment (i.e. data) in all strata of things we adjust for. So if think gender is a confounder, we need to make sure we have data on women and on men. If we also adjust for age, we need data in all of the resulting bins.
Asking causal questions
What is the effect of ___ on ___?
This is the natural form of a causal question. Here are some examples:
- What is the effect of advertising on customer behavior?
- What is the effect of beauty on getting a phone number?
- What is the effect of censoring on outcome? (censoring is when people drop out of a study)
- What is the effect of drug on time until viral failure?, and the general case
- What is the effect of treatment on outcome?
Look, estimating causal parameters is hard. In fact the effectiveness of advertising is almost always ignored because it’s so hard to measure. Typically people choose metrics of success that are easy to estimate but don’t measure what they want! Everyone makes decision based on them anyway because it’s easier. This results in people being rewarded for finding people online who would have converted anyway.
Accounting for the effect of interventions
Thinking about that, we should be concerned with the effect of interventions. What’s a model that can help us understand that effect?
A common approach is the (randomized) A/B test, which involves the assumption that two populations are equivalent. As long as that assumption is pretty good, which it usually is with enough data, then this is kind of the gold standard.
But A/B tests are not always possible (or they are too expensive to be plausible). Often we need to instead estimate the effects in the natural environment, but then the problem is the guys in different groups are actually quite different from each other.
So, for example, you might find you showed ads to more people who are hot for the product anyway; it wouldn’t make sense to test the ad that way without adjustment.
The game is then defined: how do we adjust for this?
The ideal case
Similar to how we did this last week, we pretend for now that we have a “full” data set, which is to say we have god-like powers and we know what happened under treatment as well as what would have happened if we had not treated, as well as vice-versa, for every agent in the test.
Denote this full data set by


denotes the binary outcome if treated, and
denotes the binary outcome if untreated.
As a baseline check: if we observed this full data structure how would we measure the effect of A on Y? In that case we’d be all-powerful and we would just calculate:

Note that, since 

This would be calculating how much more likely someone is to convert if they see an ad.
Note these are outcomes you can really do stuff with. If you know people convert at 30% versus 10% in the presence of an ad, that’s real information. Similarly if they convert 3 times more often.
In reality people use silly stuff like log odds ratios, which nobody understands or can interpret meaningfully.
The ideal case with functions
In reality we don’t have god-like powers, and we have to make do. We will make a bunch of assumptions. First off, denote by 


i.e. the attributes
i.e. the treatment depends in a nice way on some exogenous variables as well the attributes we know about living in
i.e. the outcome is just a function of the treatment, the attributes, and some exogenous variables.
Note the various
But we want to intervene on this causal graph as though it’s the intervention we actually want to make. i.e. what’s the effect of treatment
Let’s look at this from the point of view of the joint distribution 
- the probability of a woman being beautiful,
- the probability that Frank writes and email to a her saying that she’s beautiful, and
- the probability that Frank gets her phone number.
What we really care about though is the distribution under intervention:

i.e. the probability knowing someone either got treated or not. To answer our question, we manipulate the value of 
Assumptions
We are making a “Consistency Assumption / SUTVA” which can be expressed like this:

We have also assumed that we have no unmeasured confounders, which can be expressed thus:

We are also assuming positivity, which we discussed above.
Down to brass tacks
We only have half the information we need. We need to somehow map the stuff we have to the full data set as defined above. We make use of the following identity:
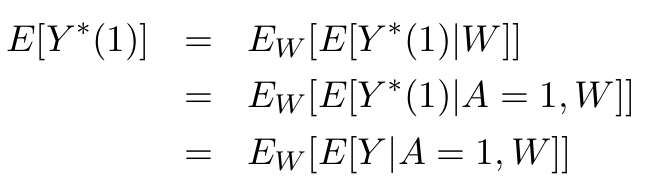
Recall we want to estimate 

We’re going to discuss three methods to estimate this quantity, namely:
- MLE-based substitution estimator (MLE),
- Inverse probability estimators (IPTW),
- Double robust estimating equations (A-IPTW)
For the above models, it’s useful to think of there being two machines, called 

IPTW
In this method, which is also called importance sampling, we weight individuals that are unlikely to be shown an ad more than those likely. In other words, we up-sample in order to generate the distribution, to get the estimation of the actual effect.
To make sense of this, imagine that you’re doing a survey of people to see how they’ll vote, but you happen to do it at a soccer game where you know there are more young people than elderly people. You might want to up-sample the elderly population to make your estimate.
This method can be unstable if there are really small sub-populations that you’re up-sampling, since you’re essentially multiplying by a reciprocal.
The formula in IPTW looks like this:

Note the formula depends on the
In words, when 

MLE
This method is based on the
This method is straight-forward: shove everyone in the machine and predict how the outcome would look under both treatment and non-treatment conditions, and take difference.
Note we don’t know anything about the underlying machine $latex Q$. It could be a logistic regression.
Get ready to get worried: A-IPTW
What if our machines are broken? That’s when we bring in the big guns: double robust estimators.
They adjust for confounding through the two machines we have on hand, 

and

Note: you are still screwed if both machines are broken. In some sense with a double robust estimator you’re hedging your bet.
“I’m glad you’re worried because I’m worried too.” – Ori
Simulate and test
I’ve shown you 3 distinct methods that estimate effects in observational studies. But they often come up with different answers. We set up huge simulation studies with known functions, i.e. where we know the functional relationships between everything, and then tried to infer those using the above three methods as well as a fourth method called TMLE (targeted maximal likelihood estimation).
As a side note, Ori encourages everyone to simulate data.
We wanted to know, which methods fail with respect to the assumptions? How well do the estimates work?
We started to see that IPTW performs very badly when you’re adjusting by very small thing. For example we found that the probability of someone getting sick is 132. That’s not between 0 and 1, which is not good. But people use these methods all the time.
Moreover, as things get more complicated with lots of nodes in our causal graph, calculating stuff over long periods of time, populations get sparser and sparser and it has an increasingly bad effect when you’re using IPTW. In certain situations your data is just not going to give you a sufficiently good answer.
Causal analysis in online display advertising
An overview of the process:
- We observe people taking actions (clicks, visits to websites, purchases, etc.).
- We use this observed data to build list of “prospects” (people with a liking for the brand).
- We subsequently observe same user during over the next few days.
- The user visits a site where a display ad spot exists and bid requests are made.
- An auction is held for display spot.
- If the auction is won, we display the ad.
- We observe the user’s actions after displaying the ad.
But here’s the problem: we’ve instituted confounders – if you find people who convert highly they think you’ve done a good job. In other words, we are looking at the treated without looking at the untreated.
We’d like to ask the question, what’s the effect of display advertising on customer conversion?
As a practical concern, people don’t like to spend money on blank ads. So A/B tests are a hard sell.
We performed some what-if analysis stipulated on the assumption that the group of users that sees ad is different. Our process was as follows:
- Select prospects that we got a bid request for on day 0
- Observe if they were treated on day 1. For those treated set
and those not treated set
collect attributes
- Create outcome window to be the next five days following treatment; observe if outcome event occurs (visit to the website whose ad was shown).
- Estimate model parameters using the methods previously described (our three methods plus TMLE).

Here are some results:
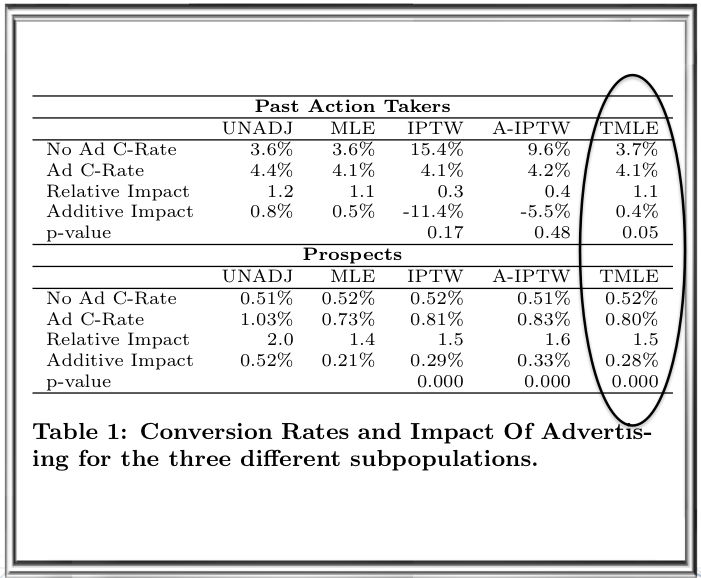
Note results vary depending on the method. And there’s no way to know which method is working the best. Moreover, this is when we’ve capped the size of the correction in the IPTW methods. If we don’t then we see ridiculous results:

The ABC Conjecture has not been proved
As I’ve blogged about before, proof is a social construct: it does not constitute a proof if I’ve convinced only myself that something is true. It only constitutes a proof if I can readily convince my audience, i.e. other mathematicians, that something is true. Moreover, if I claim to have proved something, it is my responsibility to convince others I’ve done so; it’s not their responsibility to try to understand it (although it would be very nice of them to try).
A few months ago, in August 2012, Shinichi Mochizuki claimed he had a proof of the ABC Conjecture:
For every 


The manuscript he wrote with the supposed proof of the ABC Conjecture is sprawling. Specifically, he wrote three papers to “set up” the proof and then the ultimate proof goes in a fourth. But even those four papers rely on various other papers he wrote, many of which haven’t been peer-reviewed.
The last four papers (see the end of the list here) are about 500 pages altogether, and the other papers put together are thousands of pages.
The issue here is that nobody understands what he’s talking about, even people who really care and are trying, and his write-ups don’t help.
For your benefit, here’s an excerpt from the very beginning of the fourth and final paper:
The present paper forms the fourth and final paper in a series of papers concerning “inter-universal Teichmuller theory”. In the first three papers of the series, we introduced and studied the theory surrounding the log-theta-lattice, a highly non-commutative two-dimensional diagram of “miniature models of conventional scheme theory”, called Θ±ell NF-Hodge theaters, that were associated, in the first paper of the series, to certain data, called initial Θ-data. This data includes an elliptic curve EF over a number field F , together with a prime number l ≥ 5. Consideration of various properties of the log-theta-lattice led naturally to the establishment, in the third paper of the series, of multiradial algorithms for constructing “splitting monoids of LGP-monoids”.
If you look at the terminology in the above paragraph, you will find many examples of mathematical objects that nobody has ever heard of: he introduces them in his tiny Mochizuki universe with one inhabitant.
When Wiles proved Fermat’s Last Theorem, he announced it to the mathematical community, and held a series of lectures at Cambridge. When he discovered a hole, he enlisted his former student, Richard Taylor, in helping him fill it, which they did. Then they explained the newer version to the world. They understood that it was new and hard and required explanation.
When Perelman proved the Poincare Conjecture, it was a bit tougher. He is a very weird guy, and he’d worked alone and really only written an outline. But he had used a well-known method, following Richard Hamilton, and he was available to answer questions from generous, hard-working experts. Ultimately, after a few months, this ended up working out as a proof.
I’m not saying Mochizuki will never prove the ABC Conjecture.
But he hasn’t yet, even if the stuff in his manuscript is correct. In order for it to be a proof, someone, preferably the entire community of experts who try, should understand it, and he should be the one explaining it. So far he hasn’t even been able to explain what the new idea is (although he did somehow fix a mistake at the prime 2, which is a good sign, maybe).
Let me say it this way. If Mochizuki died today, or stopped doing math for whatever reason, perhaps Grothendieck-style, hiding in the woods somewhere in Southern France and living off berries, and if someone (M) came along and read through all 6,000 pages of his manuscripts to understand what he was thinking, and then rewrote them in a way that uses normal language and is understandable to the expert number theorist, then I would claim that new person, M, should be given just as much credit for the proof as Mochizuki. It would be, by all rights, called the “Mochizuki and M Theorem”.
Come to think of it, whoever ends up interpreting this to the world will be responsible for the actual proof and should be given credit along with Mochizuki. It’s only fair, and it’s also the only thing that I can imagine would incentivize someone to do such a colossal task.
Update 5/13/13: I’ve closed comments on this post. I was getting annoyed with hostile comments. If you don’t agree with me feel free to start your own blog.
Data science in the natural sciences
This is a guest post written by Chris Wiggins, crossposted from strata.oreilly.com.
I find myself having conversations recently with people from increasingly diverse fields, both at Columbia and in local startups, about how their work is becoming “data-informed” or “data-driven,” and about the challenges posed by applied computational statistics or big data.
A view from health and biology in the 1990s
In discussions with, as examples, New York City journalists, physicists, or even former students now working in advertising or social media analytics, I’ve been struck by how many of the technical challenges and lessons learned are reminiscent of those faced in the health and biology communities over the last 15 years, when these fields experienced their own data-driven revolutions and wrestled with many of the problems now faced by people in other fields of research or industry.
It was around then, as I was working on my PhD thesis, that sequencing technologies became sufficient to reveal the entire genomes of simple organisms and, not long thereafter, the first draft of the human genome. This advance in sequencing technologies made possible the “high throughput” quantification of, for example,
- the dynamic activity of all the genes in an organism; or
- the set of all protein-protein interactions in an organism; or even
- statistical comparative genomics revealing how small differences in genotype correlate with disease or other phenotypes.
These advances required formation of multidisciplinary collaborations, multi-departmental initiatives, advances in technologies for dealing with massive datasets, and advances in statistical and mathematical methods for making sense of copious natural data.
The fourth paradigm
This shift wasn’t just a series of technological advances in biological research; the more important change was a realization that research in which data vastly outstrip our ability to posit models is qualitatively different. Much of science for the last three centuries advanced by deriving simple models from first principles — models whose predictions could then be compared with novel experiments. In modeling complex systems for which the underlying model is not yet known but for which data are abundant, however, as in systems biology or social network analysis, one may turn this process on its head by using the data to learn not only parameters of a single model but to select which among many or an infinite number of competing models is favored by the data. Just over a half-decade ago, the computer scientist Jim Gray described this as a “fourth paradigm” of science, after experimental, theoretical, and computational paradigms. Gray predicted that every sector of human endeavor will soon emulate biology’s example of identifying data-driven research and modeling as a distinct field.
In the years since then we’ve seen just that. Examples include data-driven social sciences (often leveraging the massive data now available through social networks) and even data-driven astronomy (cf., Astronomy.net). I’ve personally enjoyed seeing many students from Columbia’s School of Engineering and Applied Science (SEAS), trained in applications of big data to biology, go on to develop and apply data-driven models in these fields. As one example, a recent SEAS PhD student spent a summer as a “hackNY Fellow” applying machine learning methods at the data-driven dating NYC startup OKCupid. [Disclosure: I’m co-founder and co-president of hackNY.] He’s now applying similar methods to population genetics as a postdoctoral researcher at the University of Chicago. These students, often with job titles like “data scientist,” are able to translate to other fields, or even to the “real world” of industry and technology-driven startups, methods needed in biology and health for making sense of abundant natural data.
Data science: Combining engineering and natural sciences
In my research group, our work balances “engineering” goals, e.g., developing models that can make accurate quantitative predictions, with “natural science” goals, meaning building models that are interpretable to our biology and clinical collaborators, and which suggest to them what novel experiments are most likely to reveal the workings of natural systems. For example:
- We’ve developed machine-learning methods for modeling the expression of genes — the “on-off” state of the tens of thousands of individual processes your cells execute — by combining sequence data with microarray expression data. These models reveal which genes control which other genes, via what important sequence elements.
- We’ve analyzed large biological protein networks and shown how statistical signatures reveal what evolutionary laws can give rise to such graphs.
- In collaboration with faculty at Columbia’s chemistry department and NYU’s medical school, we’ve developed hierarchical Bayesian inference methods that can automate the analysis of thousands of time series data from single molecules. These techniques can identify the best model from models of varying complexity, along with the kinetic and biophysical parameters of interest to the chemist and clinician.
- Our current projects include, in collaboration with experts at Columbia’s medical school in pathogenic viral genomics, using machine learning methods to reveal whether a novel viral sequence may be carcinogenic or may lead to a pandemic. This research requires an abundant corpus of training data as well as close collaboration with the domain experts to ensure that the models exploit — and are interpretable in light of — the decades of bench work that has revealed what we now know of viral pathogenic mechanisms.
Throughout, our goals balance building models that are not only predictive but interpretable, e.g., revealing which sequence elements convey carcinogenicity or permit pandemic transmissibility.
Data science in health
More generally, we can apply big data approaches not only to biological examples as above but also to health data and health records. These approaches offer the possibility of, for example, revealing unknown lethal drug-drug interactions or forecasting future patient health problems; such models could have consequences for both public health policies and individual patent care. As one example, the Heritage Health Prize is a $3 million challenge ending in April 2013 “to identify patients who will be admitted to a hospital within the next year, using historical claims data.” Researchers at Columbia, both in SEAS and at Columbia’s medical school, are building the technologies needed for answering such big questions from big data.
The need for skilled data scientists
In 2011, the McKinsey Global Institute estimated that between 140,000 and 190,000 additional data scientistswill need to be trained by 2018 in order to meet the increased demand in academia and industry in the United States alone. The multidisciplinary skills required for data science applied to such fields as health and biology will include:
- the computational skills needed to work with large datasets usually shared online;
- the ability to format these data in a way amenable to mathematical modeling;
- the curiosity to explore these data to identify what features our models may be built on;
- the technical skills which apply, extend, and validate statistical and machine learning methods; and most importantly,
- the ability to visualize, interpret, and communicate the resulting insights in a way which advances science. (As the mathematician Richard Hamming said, “The purpose of computing is insight, not numbers.”)
More than a decade ago the statistician William Cleveland, then at Bell Labs, coined the term “data science” for this multidisciplinary set of skills and envisioned a future in which these skills would be needed for more fields of technology. The term has had a recent explosion in usage as more and more fields — both in academia and in industry — are realizing precisely this future.
Anti-black Friday ideas? (#OWS)
I’m trying to put together a post with good suggestions for what to do on Black Friday that would not include standing in line waiting for stores to open.
Speaking as a mother of 3 smallish kids, I don’t get the present-buying frenzy thing, and it honestly seems as bad as any other addiction this country has gotten itself into. In my opinion, we’d all be better off if pot were legalized country-wide but certain categories of plastic purchases were legal only through doctor’s orders.
One idea I had: instead of buying things your family and loved ones don’t need, help people get out of debt by donating to the Rolling Jubilee. I discussed this yesterday in the #OWS Alternative Banking meeting, it’s an awesome project.
Unfortunately you can’t choose whose debt you’re buying (yet) or even what kind of debt (medical or credit card etc.) but it still is an act of kindness and generosity (towards a stranger).
It begs the question, though, why can’t we buy the debt of people we know and love and who are in deep debt problems? Why is it that debt collectors can buy this stuff but consumers can’t?
In a certain sense we can buy our own debt, actually, by negotiating directly with debt-collectors when they call us. But if a debt-collector offers to let you pay 70 cents on the dollar, it probably means he or she bought it at 20 cents on the dollar; they pay themselves and their expenses (the daily harassing phone calls) with the margin, plus they buy a bunch of peoples’ debts and only actually successfully scare some of them into paying anything.
Question for readers:
- Is there a way to get a reasonable price on someone’s debt, i.e. closer to the 20 cents figure? This may require understanding the consumer debt market really well, which I don’t.
- Are there other good alternatives to participating in Black Friday?
Free people from their debt: Rolling Jubilee (#OWS)
Do you remember the group Strike Debt? It’s an offshoot of Occupy Wall Street which came out with the Debt Resistors Operation Manual on the one-year anniversary of Occupy; I blogged about this here, very cool and inspiring.
Well, Strike Debt has come up with another awesome idea; they are fundraising $50,000 (to start with) by holding a concert called the People’s Bailout this coming Thursday, featuring Jeff Mangum of Neutral Milk Hotel, possibly my favorite band besides Bright Eyes.
Actually that’s just the beginning, a kick-off to the larger fundraising campaign called the Rolling Jubilee.
The main idea is this: once they have money, they buy people’s debts with it, much like debt collectors buy debt. It’s mostly pennies-on-the-dollar debt, because it’s late and there is only a smallish chance that, through harassment legal and illegal, they will coax the debtor or their family members to pay.
But instead of harassing people over the phone, the Strike Debt group is simply going to throw away the debt. They might even call people up to tell them they are officially absolved from their debt, but my guess is nobody will answer the phone, from previous negative conditioning.
Get tickets to the concert here, and if you can’t make it, send donations to free someone from their debt here.
In the meantime enjoy some NMH:
Aunt Pythia’s advice
I’d like to preface Aunt Pythia’s inaugural advice column by thanking everyone who has sent me their questions. I can’t get to everything but I’ll do my best to tackle a few a week. If you have a question you’d like to submit, please do so below.
—
Dear Aunt Pythia,
My friend just started an advice column just now. She says she only wants “real” questions. But the membrane between truth and falsity is, as we all know, much more porous and permeable than this reductive boolean schema. What should I do?
Mergatroid
Dear Mergatroid,
Thanks for the question. Aunt Pythia’s answers are her attempts to be universal and useful whilst staying lighthearted and encouraging, as well as to answer the question, as she sees it, in a judgmental and over-reaching way, so yours is a fair concern.
If you don’t think she’s understood the ambiguity of a given question, please do write back and comment. If, however, you think advice columns are a waste of time altogether in terms of information gain, then my advice is to try to enjoy them for their entertainment value.
Aunt Pythia
—
Aunt Pythia,
I have a friend who always shows up to dinner parties empty-handed. What should I do?
Mergatroid
Mergatroid,
I’m glad you asked a real question too. The answer lies with you. Why are you having dinner parties and consistently inviting someone you aren’t comfortable calling up fifteen minutes beforehand screaming about not having enough parmesan cheese and to grab some on the way?
The only reason I can think of is that you’re trying to impress them. If so, then either they’ve been impressed by now or not. Stop inviting people over who you can’t demand parmesan from, it’s a simple but satisfying litmus test.
I hope that helps,
Aunt Pythia
—
Aunt Pythia,
Is a protracted discussion of “Reaganomics” the new pick-up path for meeting babes?
Tactile in Texas
T.i.T,
No idea, try me.
A.P.
—
Aunt Pythia,
A big fan of your insightful blog, I am interested in data analysis. Seemingly, marketers I have recently met with tend to misunderstand that they can find or identify causation just by utilizing quantitative methods, even if statistical software will never tell us the estimation results are causal. I’m using causation here is in the sense of potential outcomes framework.
Without knowing the idea of counterfactual, marketers could make a mistake when they calculate marketing ROI, for instance. I am wondering why people teaching Business Statistics 101 do not emphasize that we need to justify causality, for example, by employing randomization. Do you have similar impressions or experiences, auntie?
Somewhat Lonely in Asia
Dear SLiA,
I hear you. I talked about this just a couple days ago in my blog post about Rachel’s Data Science class when David Madigan guest lectured, and it’s of course a huge methodological and ethical problem when we are talking about drugs.
In industry, people make this mistake all the time, say when they start a new campaign, ROI goes up, and they assume it’s because of the new campaign but actually it’s just a seasonal effect.
The first thing to realize is that these are probably not life-or-death mistakes, except if you count the death of startups as an actual death (if you do, stop doing it). The second is that eventually someone smart figures out how to account for seasonality, and that smart person gets to keep their job because of that insight and others like it, which is a happy story for nerds everywhere.
The third and final point is that there’s no fucking way to prove causality in these cases most of the time, so it’s moot. Even if you set up an A/B test it’s often impossible to keep the experiment clean and to make definitive inferences, what with people clearing their cookies and such.
I hope that helps,
Cathy
—
Aunt Pythia,
What are the chances (mathematically speaking) that our electorial process picks the “best” person for the job? How could it be improved?
Olympian Heights
Dear OH,
Great question! And moreover it’s a great example of how, to answer a question, you have to pick a distribution first. In other words, if you think the elections are going to be not at all close, then the electoral process does a fine job. It’s only when the votes are pretty close that it makes a difference.
But having said that, the votes are almost always close on a national scale! That’s because the data collectors and pollsters do their damndest to figure out where people are in terms of voting, and the parties are constantly changing their platforms and tones to accommodate more people. So by dint of that machine, the political feedback loop, we can almost always expect a close election, and therefore we can almost always expect to worry about the electoral college versus popular vote.
Note one perverse consequence of our two-party system is that, if both sides are weak on an issue (to pull one out of a hat I’ll say financial reform), then the people who care will probably not vote at all, and so as long as they are equally weak on that issue, they can ignore it altogether.
AP
—
Dear Aunt Pythia,
Would you believe your dad is doing dishes when I teach now?
Mom
Dear Mom,
If by “your dad” you mean my dad, then no.
AP
—
Hey AP,
I have a close friend who has regularly touted his support for Obama, including on Facebook, but I found out that he has donated almost $2000 to the Romney campaign. His political donations are a matter of public record, but I had to actually look that up online. If I don’t say anything I feel our relationship won’t be the same. Do I call him on this? What would you do?
Rom-conned in NY
Dear Rom-conned,
Since the elections are safely over, right now I’d just call this guy a serious loser.
But before the election, I’d have asked you why you suspected your friend in the first place. There must have been something about him that seemed fishy or otherwise two-faced; either that or you check on all your friends’ political donation situations, which is creepy.
My advice is to bring it up with him in a direct but non-confrontational way. Something like, you ask him if he’s ever donated to a politician. If he looks you in the eye and says no, or even worse lies and says he donated to the Obama campaign, then you have your answer.
On the other hand, he may fess up and explain why he donated to Romney – maybe pressure from his parents? or work? I’m not saying it will be a good excuse but you might at least understand it more.
I hope that helps,
Aunt Pythia
—
Yo Auntie,
Caddyshack or Animal House?
UpTheArsenal
Dear UTA,
Duh, Animal House. Why do you think I had the picture I did on my zit post?
Auntie
—
Again, I didn’t get to all the questions, but I need to save some for next week just in case nobody ever asks me another question. In the meantime, please submit yours! I seriously love doing this!
Medical research needs an independent modeling panel
I am outraged this morning.
I spent yesterday morning writing up David Madigan’s lecture to us in the Columbia Data Science class, and I can hardly handle what he explained to us: the entire field of epidemiological research is ad hoc.
This means that people are taking medication or undergoing treatments that may do they harm and probably cost too much because the researchers’ methods are careless and random.
Of course, sometimes this is intentional manipulation (see my previous post on Vioxx, also from an eye-opening lecture by Madigan). But for the most part it’s not. More likely it’s mostly caused by the human weakness for believing in something because it’s standard practice.
In some sense we knew this already. How many times have we read something about what to do for our health, and then a few years later read the opposite? That’s a bad sign.
And although the ethics are the main thing here, the money is a huge issue. It required $25 million dollars for Madigan and his colleagues to implement the study on how good our current methods are at detecting things we already know. Turns out they are not good at this – even the best methods, which we have no reason to believe are being used, are only okay.
Okay, $25 million dollars is a lot, but then again there are literally billions of dollars being put into the medical trials and research as a whole, so you might think that the “due diligence” of such a large industry would naturally get funded regularly with such sums.
But you’d be wrong. Because there’s no due diligence for this industry, not in a real sense. There’s the FDA, but they are simply not up to the task.
One article I linked to yesterday from the Stanford Alumni Magazine, which talked about the work of John Ioannidis (I blogged about his work here called “Why Most Published Research Findings Are False“), summed the situation up perfectly (emphasis mine):
When it comes to the public’s exposure to biomedical research findings, another frustration for Ioannidis is that “there is nobody whose job it is to frame this correctly.” Journalists pursue stories about cures and progress—or scandals—but they aren’t likely to diligently explain the fine points of clinical trial bias and why a first splashy result may not hold up. Ioannidis believes that mistakes and tough going are at the essence of science. “In science we always start with the possibility that we can be wrong. If we don’t start there, we are just dogmatizing.”
It’s all about conflict of interest, people. The researchers don’t want their methods examined, the pharmaceutical companies are happy to have various ways to prove a new drug “effective”, and the FDA is clueless.
Another reason for an AMS panel to investigate public math models. If this isn’t in the public’s interest I don’t know what is.
Columbia Data Science course, week 10: Observational studies, confounders, epidemiology
This week our guest lecturer in the Columbia Data Science class was David Madigan, Professor and Chair of Statistics at Columbia. He received a bachelors degree in Mathematical Sciences and a Ph.D. in Statistics, both from Trinity College Dublin. He has previously worked for AT&T Inc., Soliloquy Inc., the University of Washington, Rutgers University, and SkillSoft, Inc. He has over 100 publications in such areas as Bayesian statistics, text mining, Monte Carlo methods, pharmacovigilance and probabilistic graphical models.
So Madigan is an esteemed guest, but I like to call him an “apocalyptic leprechaun”, for reasons which you will know by the end of this post. He’s okay with that nickname, I asked his permission.
Madigan came to talk to us about observation studies, of central importance in data science. He started us out with this:
Thought Experiment
We now have detailed, longitudinal medical data on tens of millions of patients. What can we do with it?
To be more precise, we have tons of phenomenological data: this is individual, patient-level medical record data. The largest of the databases has records on 80 million people: every prescription drug, every condition ever diagnosed, every hospital or doctor’s visit, every lab result, procedures, all timestamped.
But we still do things like we did in the Middle Ages; the vast majority of diagnosis and treatment is done in a doctor’s brain. Can we do better? Can you harness these data to do a better job delivering medical care?
Students responded:
1) There was a prize offered on Kaggle, called “Improve Healthcare, Win $3,000,000.” predicting who is going to go to the hospital next year. Doesn’t that give us some idea of what we can do?
Madigan: keep in mind that they’ve coarsened the data for proprietary reasons. Hugely important clinical problem, especially as a healthcare insurer. Can you intervene to avoid hospitalizations?
2) We’ve talked a lot about the ethical uses of data science in this class. It seems to me that there are a lot of sticky ethical issues surrounding this 80 million person medical record dataset.
Madigan: Agreed! What nefarious things could we do with this data? We could gouge sick people with huge premiums, or we could drop sick people from insurance altogether. It’s a question of what, as a society, we want to do.
What is modern academic statistics?
Madigan showed us Drew Conway’s Venn Diagram that we’d seen in week 1:
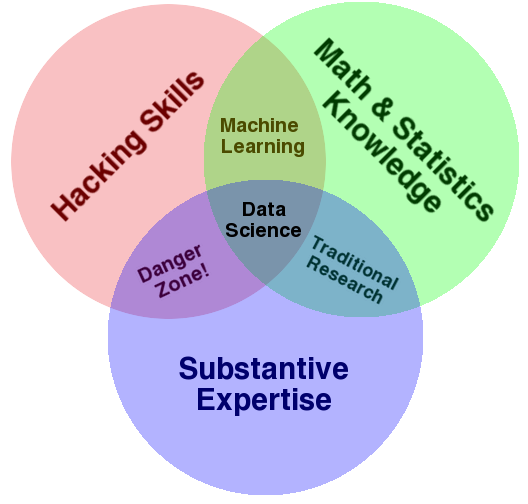 Madigan positioned the modern world of the statistician in the green and purple areas.
It used to be the case, say 20 years ago, according to Madigan, that academic statistician would either sit in their offices proving theorems with no data in sight (they wouldn’t even know how to run a t-test) or sit around in their offices and dream up a new test, or a new way of dealing with missing data, or something like that, and then they’d look around for a dataset to whack with their new method. In either case, the work of an academic statistician required no domain expertise.
Nowadays things are different. The top stats journals are more deep in terms of application areas, the papers involve deep collaborations with people in social sciences or other applied sciences. Madigan is setting an example tonight by engaging with the medical community.
Madigan went on to make a point about the modern machine learning community, which he is or was part of: it’s a newish academic field, with conferences and journals, etc., but is characterized by what stats was 20 years ago: invent a method, try it on datasets. In terms of domain expertise engagement, it’s a step backwards instead of forwards.
Comments like the above make me love Madigan.
Very few academic statisticians have serious hacking skills, with Mark Hansen being an unusual counterexample. But if all three is what’s required to be called data science, then I’m all for data science, says Madigan.
Madigan’s timeline
Madigan went to college in 1980, specialized on day 1 on math for five years. In final year, he took a bunch of stats courses, and learned a bunch about computers: pascal, OS, compilers, AI, database theory, and rudimentary computing skills. Then came 6 years in industry, working at an insurance company and a software company where he specialized in expert systems.
It was a mainframe environment, and he wrote code to price insurance policies using what would now be described as scripting languages. He also learned about graphics by creating a graphic representation of a water treatment system. He learned about controlling graphics cards on PC’s, but he still didn’t know about data.
Then he got a Ph.D. and went into academia. That’s when machine learning and data mining started, which he fell in love with: he was Program Chair of the KDD conference, among other things, before he got disenchanted. He learned C and java, R and S+. But he still wasn’t really working with data yet.
He claims he was still a typical academic statistician: he had computing skills but no idea how to work with a large scale medical database, 50 different tables of data scattered across different databases with different formats.
In 2000 he worked for AT&T labs. It was an “extreme academic environment”, and he learned perl and did lots of stuff like web scraping. He also learned awk and basic unix skills.
It was life altering and it changed everything: having tools to deal with real data rocks! It could just as well have been python. The point is that if you don’t have the tools you’re handicapped. Armed with these tools he is afraid of nothing in terms of tackling a data problem.
In Madigan’s opinion, statisticians should not be allowed out of school unless they know these tools.
He then went to a internet startup where he and his team built a system to deliver real-time graphics on consumer activity.
Since then he’s been working in big medical data stuff. He’s testified in trials related to medical trials, which was eye-opening for him in terms of explaining what you’ve done: “If you’re gonna explain logistical regression to a jury, it’s a different kind of a challenge than me standing here tonight.” He claims that super simple graphics help.
Carrotsearch
As an aside he suggests we go to this website, called carrotsearch, because there’s a cool demo on it.
What is an observational study?
Madigan defines it for us:
An observational study is an empirical study in which the objective is to elucidate cause-and-effect relationships in which it is not feasible to use controlled experimentation.
In tonight’s context, it will involve patients as they undergo routine medical care. We contrast this with designed experiment, which is pretty rare. In fact, Madigan contends that most data science activity revolves around observational data. Exceptions are A/B tests. Most of the time, the data you have is what you get. You don’t get to replay a day on the market where Romney won the presidency, for example.
Observational studies are done in contexts in which you can’t do experiments, and they are mostly intended to elucidate cause-and-effect. Sometimes you don’t care about cause-and-effect, you just want to build predictive models. Madigan claims there are many core issues in common with the two.
Here are some examples of tests you can’t run as designed studies, for ethical reasons:
- smoking and heart disease (you can’t randomly assign someone to smoke)
- vitamin C and cancer survival
- DES and vaginal cancer
- aspirin and mortality
- cocaine and birthweight
- diet and mortality
Pitfall #1: confounders
There are all kinds of pitfalls with observational studies.
For example, look at this graph, where you’re finding a best fit line to describe whether taking higher doses of the “bad drug” is correlated to higher probability of a heart attack:

It looks like, from this vantage point, the more drug you take the fewer heart attacks you have. But there are two clusters, and if you know more about those two clusters, you find the opposite conclusion:

Note this picture was rigged it so the issue is obvious. This is an example of a “confounder.” In other words, the aspirin-taking or non-aspirin-taking of the people in the study wasn’t randomly distributed among the people, and it made a huge difference.
It’s a general problem with regression models on observational data. You have no idea what’s going on.
Madigan: “It’s the wild west out there.”
Wait, and it gets worse. It could be the case that within each group there males and females and if you partition by those you see that the more drugs they take the better again. Since a given person either is male or female, and either takes aspirin or doesn’t, this kind of thing really matters.
This illustrates the fundamental problem in observational studies, which is sometimes called Simpson’s Paradox.
[Remark from someone in the class: if you think of the original line as a predictive model, it’s actually still the best model you can obtain knowing nothing more about the aspirin-taking habits or genders of the patients involved. The issue here is really that you’re trying to assign causality.]
The medical literature and observational studies
As we may not be surprised to hear, medical journals are full of observational studies. The results of these studies have a profound effect on medical practice, on what doctors prescribe, and on what regulators do.
For example, in this paper, entitled “Oral bisphosphonates and risk of cancer of oesophagus, stomach, and colorectum: case-control analysis within a UK primary care cohort,” Madigan report that we see the very same kind of confounding problem as in the above example with aspirin. The conclusion of the paper is that the risk of cancer increased with 10 or more prescriptions of oral bisphosphonates.
It was published on the front page of new york times, the study was done by a group with no apparent conflict of interest and the drugs are taken by millions of people. But the results were wrong.
There are thousands of examples of this, it’s a major problem and people don’t even get that it’s a problem.
Randomized clinical trials
One possible way to avoid this problem is randomized studies. The good news is that randomization works really well: because you’re flipping coins, all other factors that might be confounders (current or former smoker, say) are more or less removed, because I can guarantee that smokers will be fairly evenly distributed between the two groups if there are enough people in the study.
The truly brilliant thing about randomization is that randomization matches well on the possible confounders you thought of, but will also give you balance on the 50 million things you didn’t think of.
So, although you can algorithmically find a better split for the ones you thought of, that quite possible wouldn’t do as well on the other things. That’s why we really do it randomly, because it does quite well on things you think of and things you don’t.
But there’s bad news for randomized clinical trials as well. First off, it’s only ethically feasible if there’s something called clinical equipoise, which means the medical community really doesn’t know which treatment is better. If you know have reason to think treating someone with a drug will be better for them than giving them nothing, you can’t randomly not give people the drug.
The other problem is that they are expensive and cumbersome. It takes a long time and lots of people to make a randomized clinical trial work.
In spite of the problems, randomized clinical trials are the gold standard for elucidating cause-and-effect relationships.
Rubin causal model
The Rubin causal model is a mathematical framework for understanding what information we know and don’t know in observational studies.
It’s meant to investigate the confusion when someone says something like “I got lung cancer because I smoked”. Is that true? If so, you’d have to be able to support the statement, “If I hadn’t smoked I wouldn’t have gotten lung cancer,” but nobody knows that for sure.
Define:
to be the treatment applied to unit
(0 = control, 1= treatment),
to be the response for unit
,
to be the response for unit
.
Then the unit level causal effect is 

Example: 
Of course, on a population level we do know how to infer that there are quite a few “1”‘s among the population, but we will never be able to assign a given individual that number.
This is sometimes called the fundamental problem of causal inference.
Confounding and Causality
Let’s say we have a population of 100 people that takes some drug, and we screen them for cancer. Say 30 out of them get cancer, which gives them a cancer rate of 0.30. We want to ask the question, did the drug cause the cancer?
To answer that, we’d have to know what would’ve happened if they hadn’t taken the drug. Let’s play God and stipulate that, had they not taken the drug, we would have seen 20 get cancer, so a rate of 0.20. We typically say the causal effect is the ration of these two numbers (i.e. the increased risk of cancer), so 1.5.
But we don’t have God’s knowledge, so instead we choose another population to compare this one to, and we see whether they get cancer or not, whilst not taking the drug. Say they have a natural cancer rate of 0.10. Then we would conclude, using them as a proxy, that the increased cancer rate is the ratio 0.30 to 0.10, so 3. This is of course wrong, but the problem is that the two populations have some underlying differences that we don’t account for.
If these were the “same people”, down to the chemical makeup of each other molecules, this “by proxy” calculation would work of course.
The field of epidemiology attempts to adjust for potential confounders. The bad news is that it doesn’t work very well. One reason is that they heavily rely on stratification, which means partitioning the cases into subcases and looking at those. But there’s a problem here too.
Stratification can introduce confounding.
The following picture illustrates how stratification could make the underlying estimates of the causal effects go from good to bad:

In the top box, the values of b and c are equal, so our causal effect estimate is correct. However, when you break it down by male and female, you get worse estimates of causal effects.
The point is, stratification doesn’t just solve problems. There are no guarantees your estimates will be better if you stratify and all bets are off.
What do people do about confounding things in practice?
In spite of the above, experts in this field essentially use stratification as a major method to working through studies. They deal with confounding variables by essentially stratifying with respect to them. So if taking aspirin is believed to be a potential confounding factor, they stratify with respect to it.
For example, with this study, which studied the risk of venous thromboembolism from the use of certain kinds of oral contraceptives, the researchers chose certain confounders to worry about and concluded the following:
After adjustment for length of use, users of oral contraceptives were at least twice the risk of clotting compared with user of other kinds of oral contraceptives.
This report was featured on ABC, and it was a big hoo-ha.
Madigan asks: wouldn’t you worry about confounding issues like aspirin or something? How do you choose which confounders to worry about? Wouldn’t you worry that the physicians who are prescribing them are different in how they prescribe? For example, might they give the newer one to people at higher risk of clotting?
Another study came out about this same question and came to a different conclusion, using different confounders. They adjusted for a history of clots, which makes sense when you think about it.
This is an illustration of how you sometimes forget to adjust for things, and the outputs can then be misleading.
What’s really going on here though is that it’s totally ad hoc, hit or miss methodology.
Another example is a study on oral bisphosphonates, where they adjusted for smoking, alcohol, and BMI. But why did they choose those variables?
There are hundreds of examples where two teams made radically different choices on parallel studies. We tested this by giving a bunch of epidemiologists the job to design 5 studies at a high level. There was zero consistency. And an addition problem is that luminaries of the field hear this and say: yeah yeah yeah but I would know the right way to do it.
Is there a better way?
Madigan and his co-authors examined 50 studies, each of which corresponds to a drug and outcome pair, e.g. antibiotics with GI bleeding.
They ran about 5,000 analyses for every pair. Namely, they ran every epistudy imaginable on, and they did this all on 9 different databases.
For example, they looked at ACE inhibitors (the drug) and swelling of the heart (outcome). They ran the same analysis on the 9 different standard databases, the smallest of which has records of 4,000,000 patients, and the largest of which has records of 80,000,000 patients.
In this one case, for one database the drug triples the risk of heart swelling, but for another database it seems to have a 6-fold increase of risk. That’s one of the best examples, though, because at least it’s always bad news – it’s consistent.
On the other hand, for 20 of the 50 pairs, you can go from statistically significant in one direction (bad or good) to the other direction depending on the database you pick. In other words, you can get whatever you want. Here’s a picture, where the heart swelling example is at the top:

Note: the choice of database is never discussed in any of these published epidemiology papers.
Next they did an even more extensive test, where they essentially tried everything. In other words, every time there was a decision to be made, they did it both ways. The kinds of decisions they tweaker were of the following types: which database you tested on, the confounders you accounted for, the window of time you care about examining (spoze they have a heart attack a week after taking the drug, is it counted? 6 months?)
What they saw was that almost all the studies can get either side depending on the choices.
Final example, back to oral bisphosphonates. A certain study concluded that it causes esophageal cancer, but two weeks later JAMA published a paper on same issue which concluded it is not associated to elevated risk of esophageal cancer. And they were even using the same database. This is not so surprising now for us.
OMOP Research Experiment
Here’s the thing. Billions upon billions of dollars are spent doing these studies. We should really know if they work. People’s lives depend on it.
Madigan told us about his “OMOP 2010.2011 Research Experiment”
They took 10 large medical databases, consisting of a mixture of claims from insurance companies and EHR (electronic health records), covering records of 200 million people in all. This is big data unless you talk to an astronomer.
They mapped the data to a common data model and then they implemented every method used in observational studies in healthcare. Altogether they covered 14 commonly used epidemiology designs adapted for longitudinal data. They automated everything in sight. Moreover, there were about 5000 different “settings” on the 14 methods.
The idea was to see how well the current methods do on predicting things we actually already know.
To locate things they know, they took 10 old drug classes: ACE inhibitors, beta blockers, warfarin, etc., and 10 outcomes of interest: renal failure, hospitalization, bleeding, etc.
For some of these the results are known. So for example, warfarin is a blood thinner and definitely causes bleeding. There were 9 such known bad effects.
There were also 44 known “negative” cases, where we are super confident there’s just no harm in taking these drugs, at least for these outcomes.
The basic experiment was this: run 5000 commonly used epidemiological analyses using all 10 databases. How well do they do at discriminating between reds and blues?
This is kind of like a spam filter test. We have training emails that are known spam, and you want to know how well the model does at detecting spam when it comes through.
Each of the models output the same thing: a relative risk (causal effect estimate) and an error.
This was an attempt to empirically evaluate how well does epidemiology work, kind of the quantitative version of John Ioannidis’s work. we did the quantitative thing to show he’s right.
Why hasn’t this been done before? There’s conflict of interest for epidemiology – why would they want to prove their methods don’t work? Also, it’s expensive, it cost $25 million dollars (of course that pales in comparison to the money being put into these studies). They bought all the data, made the methods work automatically, and did a bunch of calculations in the Amazon cloud. The code is open source.
In the second version, we zeroed in on 4 particular outcomes. Here’s the $25,000,000 ROC curve:

To understand this graph, we need to define a threshold, which we can start with at 2. This means that if the relative risk is estimated to be above 2, we call it a “bad effect”, otherwise call it a “good effect.” The choice of threshold will of course matter.
If it’s high, say 10, then you’ll never see a 10, so everything will be considered a good effect. Moreover these are old drugs and it wouldn’t be on the market. This means your sensitivity will be low, and you won’t find any real problem. That’s bad! You should find, for example, that warfarin causes bleeding.
There’s of course good news too, with low sensitivity, namely a zero false-positive rate.
What if you set the threshold really low, at -10? Then everything’s bad, and you have a 100% sensitivity but very high false positive rate.
As you vary the threshold from very low to very high, you sweep out a curve in terms of sensitivity and false-positive rate, and that’s the curve we see above. There is a threshold (say 1.8) for which your false positive rate is 30% and your sensitivity is 50%.
This graph is seriously problematic if you’re the FDA. A 30% false-positive rate is out of control. This curve isn’t good.
The overall “goodness” of such a curve is usually measured as the area under the curve: you want it to be one, and if your curve lies on diagonal the area is 0.5. This is tantamount to guessing randomly. So if your area under the curve is less than 0.5, it means your model is perverse.
The area above is 0.64. Moreover, of the 5000 analysis we ran, this is the single best analysis.
But note: this is the best if I can only use the same method for everything. In that case this is as good as it gets, and it’s not that much better than guessing.
But no epidemiology would do that!
So what they did next was to specialize the analysis to the database and the outcome. And they got better results: for the medicare database, and for acute kidney injury, their optimal model gives them an AUC of 0.92. They can achieve 80% sensitivity with a 10% false positive rate.

They did this using a cross-validation method. Different databases have different methods attached to them. One winning method is called “OS”, which compares within a given patient’s history (so compares times when patient was on drugs versus when they weren’t). This is not widely used now.
The epidemiologists in general don’t believe the results of this study.
If you go to http://elmo/omop.org, you can see the AUM for a given database and a given method.
Note the data we used was up to mid-2010. To update this you’d have to get latest version of database, and rerun the analysis. Things might have changed.
Moreover, an outcome for which nobody has any idea on what drugs cause what outcomes you’re in trouble. This only applies to when we have things to train on where we know the outcome pretty well.
Parting remarks
Keep in mind confidence intervals only account for sampling variability. They don’t capture bias at all. If there’s bias, the confidence interval or p-value can be meaningless.
What about models that epidemiologists don’t use? We have developed new methods as well (SCCS). we continue to do that, but it’s a hard problem.
Challenge for the students: we ran 5000 different analyses. Is there a good way of combining them to do better? weighted average? voting methods across different strategies?
Note the stuff is publicly available and might make a great Ph.D. thesis.
When are taxes low enough?
What with the unrelenting election coverage (go Elizabeth Warren!) it’s hard not to think about the game theory that happens in the intersection of politics and economics.
[Disclaimer: I am aware that no idea in here is originally mine, but when has that ever stopped me? Plus, I think when economists talk about this stuff they generally use jargon to make it hard to follow, which I promise not to do, and perhaps also insert salient facts which I don’t know, which I apologize for. In any case please do comment if I get something wrong.]
Lately I’ve been thinking about the push and pull of the individual versus the society when it comes to tax rates. Individuals all want lower tax rates, in the sense that nobody likes to pay taxes. On the other hand, some people benefit more from what the taxes pay for than others, and some people benefit less. It’s fair to say that very rich people see this interaction as one-sided against them: they pay a lot, they get back less.
Well, that’s certainly how it’s portrayed. I’m not willing to say that’s true, though, because I’d argue business owners and generally rich people get a lot back actually, including things like rule of law and nobody stealing their stuff and killing them because they’re rich, which if you think about it does happen in other places. In fact they’d be huge targets in some places, so you could argue that rich people get the most protection from this system.
But putting that aside by assuming the rule of law for a moment, I have a lower-level question. Namely, might we expect equilibrium at some point, where the super rich realize they need the country’s infrastructure and educational system, to hire people and get them to work at their companies and the companies they’ve invested in, and of course so they will have customers for their products and the products of the companies they’ve invested in.
So in other words you might expect that, at a certain point, these super rich people would actually say taxes are low enough. Of course, on top of having a vested interest in a well-run and educated society, they might also have sense of fairness and might not liking seeing people die of hunger, they might want to be able to defend the country in war, and of course the underlying rule of law thingy.
But the above argument has kind of broken down lately, because:
- So many companies are off-shoring their work to places where we don’t pay for infrastructure,
- and where we don’t educate the population,
- and our customers are increasingly international as well, although this is the weakest effect since Europeans can’t be counted on that so much what with their recession.
In other words, the incentive for an individual rich person to argue for lower taxes is getting more and more to be about the rule of law and not the well-run society argument. And let’s face it, it’s a lot cheaper to teach people how to use guns than it is to give them a liberal arts education. So the optimal tax rate for them would be… possibly very low. Maybe even zero, if they can just hire their own militias.
This is an example of a system of equilibrium failing because of changing constraints. There’s another similar example in the land of finance which involves credit default swaps (CDS), described very well in this NYTimes Dealbook entry by Stephen Lubben.
Namely, it used to be true that bond holders would try to come to the table and renegotiate debt when a company or government was in trouble. After all, it’s better to get 40% of their money back than none.
But now it’s possible to “insure” their bonds with CDS contracts, and in fact you can even bet on the failure of a company that way, so you actually can set it up where you’d make money when a company fails, whether you’re a bond holder or not. This means less incentive to renegotiate debt and more of an incentive to see companies go through bankruptcy.
For the record, the suggestion Lubben has, which is a good one, is to have a disclosure requirement on how much CDS you have:
In a paper to appear in the Journal of Applied Corporate Finance, co-written with Rajesh P. Narayanan of Louisiana State University, I argue that one good starting point might be the Williams Act.
In particular, the Williams Act requires shareholders to disclose large (5 percent or more) equity positions in companies.
Perhaps holders of default swap positions should face a similar requirement. Namely, when a triggering event occurs, a holder of swap contracts with a notional value beyond 5 percent of the reference entity’s outstanding public debt would have to disclose their entire credit-default swap position.
I like this idea: it’s simple and is analogous to what’s already established for equities (of course I’d like to see CDS regulated like insurance, which goes further).
[Note, however, that the equities problem isn’t totally solved through this method: you can always short your exposure to an equity using options, although it’s less attractive in equities than in bonds because the underlying in equities is usually more liquid than the derivatives and the opposite is true for bonds. In other words, you can just sell your equity stake rather than hedge it, whereas your bond you might not be able to get rid of as easily, so it’s convenient to hedge with a liquid CDS.]
Lubben’s not a perfect solution to the problem of creating incentives to make companies work rather than fail, since it adds overhead and complexity, and the last thing our financial system needs is more complexity. But it moves the incentives in the right direction.
It makes me wonder, is there an analogous rule, however imperfect, for tax rates? How do we get super rich people to care about infrastructure and education, when they take private planes and send their kids to private schools? It’s not fair to put a tax law into place, because the whole point is that rich people have more power in controlling tax laws in the first place.
Money market regulation: a letter to Geithner and Schapiro from #OWS Occupy the SEC and Alternative Banking
#OWS working groups Occupy the SEC and Alternative Banking have released an open letter to Timothy Geithner, Secretary of the U.S. Treasury, and Mary Schapiro, Chairman of the SEC, calling on them to put into place reasonable regulation of money market funds (MMF’s).
Here’s the letter, I’m super proud of it. If you don’t have enough context, I give a more background below.
What are MMFs?
Money market funds make up the overall money market, which is a way for banks and businesses to finance themselves with short-term debt. It sounds really boring, but as it turns out it’s a vital issue for the functioning of the financial system.
Really simply put, money market funds invest in things like short-term corporate debt (like 30-day GM debt) or bank debt (Goldman or Chase short-term debt) and stuff like that. Their investments also include deposits and U.S. bonds.
People like you and me can put our money into money market funds via our normal big banks like Bank of America. In face I was told by my BofA banker to do this around 2007. He said it’s like a savings account, only better. If you do invest in a MMF, you’re told how much over a dollar your investments are worth. The implicit assumption then is that you never actually lose money.
What happened in the crisis?
MMF’s were involved in some of the early warning signs of the financial crisis. In August and September 2007, there was a run on subprime-related asset backed commercial paper.
In 2008, some of the funds which had invested in short-term Lehman Brother’s debt had huge problems when Lehman went down, and they “broke the buck”. This caused wide-spread panic and a bunch of money market funds had people pulling money from them.
In order to avoid a run on the MMF’s, the U.S. stepped in and guaranteed that nobody would actually lose money. It was a perfect example of something we had to do at the time, because we would literally not have had a functioning financial system given how central the money markets were at the time, in financing the shadow banking system, but something we should have figured out how to improve on by now.
This is a huge issue and needs to be dealt with before the next crisis.
What happened in 2010?
In 2010, regulators put into place rules that tightened restrictions within a fund. Things like how much cash they had to have on hand (liquidity requirements) and how long the average duration of their investments could be. This helped address the problem of what happens within a given fund when investors take their money out of that fund.
What they didn’t do in 2010 was to control systemic issues, and in particular how to make the MMF’s robust to large-scale panic.
What about Schapiro’s two MMF proposals?
More recently, Mary Schapiro, Chairman of the SEC, made two proposals to address the systemic issues. In the first proposal, instead of having the NAV’s set at one dollar, everything is allowed to float, just like every other kind of mutual fund. The industry didn’t like it, claiming it would make MMF’s less attractive.
In the second proposal, Schapiro suggesting that MMF managers keep a buffer of capital and that a new, weird lagged way for people to remove their money from their MMF’s, namely if you want to withdraw your funds you’ll only get 97%, and later (after 30 days) you’ll get 3% if the market doesn’t take a loss. If it does take a loss, will get only part of that last 3%.
The goal of this was to distribute losses more evenly, and to give people pause in times of crisis from withdrawing too quickly and causing a bank-like run.
Unfortunately, both of Schapiro’s proposals didn’t get passed by the 5 SEC Commissioners in August 2012 – it needed a majority vote, but they only got 2.
What happened when Geithner and Blackrock entered the picture?
The third, most recent proposal, comes out of the FSOC, a new meta-regulator, whose chair is Timothy Geithner. The guys proposed to the SEC in a letter dated September 27th that they should do something about money market regulation. Specifically, the FSOC letter suggests that either the SEC should go with one of Schapiro’s two ideas or a new third one.
The third one is again proposing a weird way for people to take their money out of a MMF, but this time it definitely benefits people who are “first movers”, in other words people who see a problem first and get the hell out. It depends on a parameter, called a trigger, which right now is set at 25 basis points (so 25 cents if you have $100 invested).
Specifically, if the value of the fund falls below 99.75, any withdrawal from that point on will be subject to a “withdrawal fee,” defined to be the distance between the fund’s level and 100. So if the fund is at 99.75, you have to pay a 25 cent fee and you only get out 99.50, whereas if the fund is at 99.76, you actually get out 100. So in other words, there’s an almost 50 cents difference at this critical value.
Is this third proposal really any better than either of Schapiro’s first two?
The industry and Timmy: bff’s?
Here’s something weird: on the same day the FSOC letter was published, BlackRock, which is a firm that does an enormous amount of money market managing and so stands to win or lose big on money market regulation, published an article in which they trashed Schapiro’s proposals and embellished this third one.
In other words, it looks like Geithner has been talking directly to Blackrock about how the money market regulation should be written.
In fact Geithner has seemingly invited industry insiders to talk to him at the Treasury. And now we have his proposal, which benefits insiders and also seems to have all of the unattractiveness that the other proposals had in terms of risks for normal people, i.e. non-insiders. That’s weird.
Update: in this Bloomberg article from yesterday (hat tip Matt Stoller), it looks like Geithner may be getting a fancy schmancy job at BlackRock after the election. Oh!
What’s wrong with simple?
Personally, and I say this as myself and not representing anyone else, I don’t see what’s wrong with Schapiro’s first proposal to keep the NAV floating. If there’s risk, investors should know about it, period, end of story. I don’t want the taxpayers on the hook for this kind of crap.
The NYC subway, Aunt Pythia, my zits, and Louis CK
Please pardon the meandering nature of this post. It’s that kind of Monday morning.
——————-
So much for coming together as a city after a disaster. The New York mood was absolutely brutal on the subway this morning.
I went into the subway station in awe of the wondrous infrastructure that is the NY subway, looking for someone to make out with in sheer rapture that my kids are all in school, but after about 15 minutes I was clawing my way, along with about 15 other people, onto the backs of people already stuffed like sausages on the 2 train at 96th street.
For god’s sakes, people, look at all that space up top! Can you people who are traveling together please give each other piggy-back rides so we don’t waste so much goddamn space? Sheesh.
——————-
I’m absolutely blown away by the questions I’ve received already for my Aunt Pythia advice column: you guys are brilliant, interesting, and only a little bit abusive.
My only complaint is that the questions so far are very, very deep, and I was hoping for some very silly and/or sexual questions so I could make this kind of lighthearted and fun in between solving the world’s pressing problem.
Even so, well done. I’m worried I might have to replace mathbabe altogether just to answer all these amazing questions. Please give me more!
——————-
After some amazing on-line and off-line comments for my zit model post from yesterday, I’ve come to a few conclusions:
- Benzoyl peroxide works for lots of people. I’ll try it, what the hell.
- An amazing number of people have done this experiment.
- It may be something you don’t actually want to do. For example, as Jordan pointed out yesterday, what if you find out it’s caused by something you really love doing? Then your pleasure doing that would be blemished.
- It may well be something you really don’t want other people to do. Can you imagine how annoyingly narcissistic and smug everyone’s going to be when they solve their acne/weight/baldness problems with this kind of stuff? The peer pressure to be perfect is gonna be even worse than it currently is. Blech! I love me some heterogeneity in my friends.
——————–
Finally, and I know I’m the last person to find out about everything (except Gangnam Style, which I’ll be sure to remind you guys of quite often), but I finally got around to absolutely digging Louis CK when he hosted SNL this weekend. A crazy funny man, and now I’m going through all his stuff (or at least the stuff available to me for free on Amazon Prime).


