Archive
K-Nearest Neighbors: dangerously simple
I spend my time at work nowadays thinking about how to start a company in data science. Since there are tons of companies now collecting tons of data, and they don’t know what do to do with it, nor who to ask, part of me wants to design (yet another) dumbed-down “analytics platform” so that business people can import their data onto the platform, and then perform simple algorithms themselves, without even having a data scientist to supervise.
After all, a good data scientist is hard to find. Sometimes you don’t even know if you want to invest in this whole big data thing, you’re not sure the data you’re collecting is all that great or whether the whole thing is just a bunch of hype. It’s tempting to bypass professional data scientists altogether and try to replace them with software.
I’m here to say, it’s not clear that’s possible. Even the simplest algorithm, like k-Nearest Neighbor (k-NN), can be naively misused by someone who doesn’t understand it well. Let me explain.
Say you have a bunch of data points, maybe corresponding to users on your website. They have a bunch of attributes, and you want to categorize them based on their attributes. For example, they might be customers that have spent various amounts of money on your product, and you can put them into “big spender”, “medium spender”, “small spender”, and “will never buy anything” categories.
What you really want, of course, is a way of anticipating the category of a new user before they’ve bought anything, based on what you know about them when they arrive, namely their attributes. So the problem is, given a user’s attributes, what’s your best guess for that user’s category?
Let’s use k-Nearest Neighbors. Let k be 5 and say there’s a new customer named Monica. Then the algorithm searches for the 5 customers closest to Monica, i.e. most similar to Monica in terms of attributes, and sees what categories those 5 customers were in. If 4 of them were “medium spenders” and 1 was “small spender”, then your best guess for Monica is “medium spender”.
Holy shit, that was simple! Mathbabe, what’s your problem?
The devil is all in the detail of what you mean by close. And to make things trickier, as in easier to be deceptively easy, there are default choices you could make (and which you would make) which would probably be totally stupid. Namely, the raw numbers, and Euclidean distance.
So, for example, say your customer attributes were: age, salary, and number of previous visits to your website. Don’t ask me how you know your customer’s salary, maybe you bought info from Acxiom.
So in terms of attribute vectors, Monica’s might look like:

And the nearest neighbor to Monica might look like:

In other words, because you’re including the raw salary numbers, you are thinking of Monica, who is 22 and new to the site, as close to a 75-year old who comes to the site a lot. The salary, being of a much larger scale, is totally dominating the distance calculation. You might as well have only that one attribute and scrap the others.
Note: you would not necessarily think about this problem if you were just pressing a big button on a dashboard called “k-NN me!”
Of course, it gets trickier. Even if you measured salary in thousands (so Monica would now be given the attribution vector 
Another problem is redundancy – if you have a bunch of attributes that are essentially redundant, i.e. that are highly correlated to each other, then including them all is tantamount to multiplying the scale of that factor.
Another problem is not all your attributes are even numbers, so you have string attributes. You might think you can solve this by using 0’s and 1’s, but in the case of k-NN, that becomes just another scaling problem.
One way around this might be to first use some kind of dimension-reducing algorithm, like PCA, to figure out what attribute combinations to actually use from the get-go. That’s probably what I’d do.
But that means you’re using a fancy algorithm in order to use a completely stupid algorithm. Not that there’s anything wrong with that, but it indicates the basic problem, which is that doing data analysis carefully is actually pretty hard and maybe should be done by professionals, or at least under the supervision of a one.
We don’t need more complicated models, we need to stop lying with our models
The financial crisis has given rise to a series of catastrophes related to mathematical modeling.
Time after time you hear people speaking in baffled terms about mathematical models that somehow didn’t warn us in time, that were too complicated to understand, and so on. If you have somehow missed such public displays of throwing the model (and quants) under the bus, stay tuned below for examples.
A common response to these problems is to call for those models to be revamped, to add features that will cover previously unforeseen issues, and generally speaking, to make them more complex.
For a person like myself, who gets paid to “fix the model,” it’s tempting to do just that, to assume the role of the hero who is going to set everything right with a few brilliant ideas and some excellent training data.
Unfortunately, reality is staring me in the face, and it’s telling me that we don’t need more complicated models.
If I go to the trouble of fixing up a model, say by adding counterparty risk considerations, then I’m implicitly assuming the problem with the existing models is that they’re being used honestly but aren’t mathematically up to the task.
But this is far from the case – most of the really enormous failures of models are explained by people lying. Before I give three examples of “big models failing because someone is lying” phenomenon, let me add one more important thing.
Namely, if we replace okay models with more complicated models, as many people are suggesting we do, without first addressing the lying problem, it will only allow people to lie even more. This is because the complexity of a model itself is an obstacle to understanding its results, and more complex models allow more manipulation.
Example 1: Municipal Debt Models
Many municipalities are in shit tons of problems with their muni debt. This is in part because of the big banks taking advantage of them, but it’s also in part because they often lie with models.
Specifically, they know what their obligations for pensions and school systems will be in the next few years, and in order to pay for all that, they use a model which estimates how well their savings will pay off in the market, or however they’ve invested their money. But they use vastly over-exaggerated numbers in these models, because that way they can minimize the amount of money to put into the pool each year. The result is that pension pools are being systematically and vastly under-funded.
Example 2: Wealth Management
I used to work at Riskmetrics, where I saw first-hand how people lie with risk models. But that’s not the only thing I worked on. I also helped out building an analytical wealth management product. This software was sold to banks, and was used by professional “wealth managers” to help people (usually rich people, but not mega-rich people) plan for retirement.
We had a bunch of bells and whistles in the software to impress the clients – Monte Carlo simulations, fancy optimization tools, and more. But in the end, the banks and their wealth managers put in their own market assumptions when they used it. Specifically, they put in the forecast market growth for stocks, bonds, alternative investing, etc., as well as the assumed volatility of those categories and indeed the entire covariance matrix representing how correlated the market constituents are to each other.
The result is this: no matter how honest I would try to be with my modeling, I had no way of preventing the model from being misused and misleading to the clients. And it was indeed misused: wealth managers put in absolutely ridiculous assumptions of fantastic returns with vanishingly small risk.
Example 3: JP Morgan’s Whale Trade
I saved the best for last. JP Morgan’s actions around their $6.2 billion trading loss, the so-called “Whale Loss” was investigated recently by a Senate Subcommittee. This is an excerpt (page 14) from the resulting report, which is well worth reading in full:
While the bank claimed that the whale trade losses were due, in part, to a failure to have the right risk limits in place, the Subcommittee investigation showed that the five risk limits already in effect were all breached for sustained periods of time during the first quarter of 2012. Bank managers knew about the breaches, but allowed them to continue, lifted the limits, or altered the risk measures after being told that the risk results were “too conservative,” not “sensible,” or “garbage.” Previously undisclosed evidence also showed that CIO personnel deliberately tried to lower the CIO’s risk results and, as a result, lower its capital requirements, not by reducing its risky assets, but by manipulating the mathematical models used to calculate its VaR, CRM, and RWA results. Equally disturbing is evidence that the OCC was regularly informed of the risk limit breaches and was notified in advance of the CIO VaR model change projected to drop the CIO’s VaR results by 44%, yet raised no concerns at the time.
I don’t think there could be a better argument explaining why new risk limits and better VaR models won’t help JPM or any other large bank. The manipulation of existing models is what’s really going on.
Just to be clear on the models and modelers as scapegoats, even in the face of the above report, please take a look at minute 1:35:00 of the C-SPAN coverage of former CIO head Ina Drew’s testimony when she’s being grilled by Senator Carl Levin (hat tip Alan Lawhon, who also wrote about this issue here).
Ina Drew firmly shoves the quants under the bus, pretending to be surprised by the failures of the models even though, considering she’d been at JP Morgan for 30 years, she might know just a thing or two about how VaR can be manipulated. Why hasn’t Sarbanes-Oxley been used to put that woman in jail? She’s not even at JP Morgan anymore.
Stick around for a few minutes in the testimony after Levin’s done with Drew, because he’s on a roll and it’s awesome to watch.
Value-added model doesn’t find bad teachers, causes administrators to cheat
There’ve been a couple of articles in the past few days about teacher Value-Added Testing that have enraged me.
If you haven’t been paying attention, the Value-Added Model (VAM) is now being used in a majority of the states (source: the Economist):

But it gives out nearly random numbers, as gleaned from looking at the same teachers with two scores (see this previous post). There’s a 24% correlation between the two numbers. Note that some people are awesome with respect to one score and complete shit on the other score:

Final thing you need to know about the model: nobody really understands how it works. It relies on error terms of an error-riddled model. It’s opaque, and no teacher can have their score explained to them in Plain English.
Now, with that background, let’s look into these articles.
First, there’s this New York Times article from yesterday, entitled “Curious Grade for Teachers: Nearly All Pass”. In this article, it describes how teachers are nowadays being judged using a (usually) 50/50 combination of classroom observations and VAM scores. This is different from the past, which was only based on classroom observations.
What they’ve found is that the percentage of teachers found “effective or better” has stayed high in spite of the new system – the numbers are all over the place but typically between 90 and 99 percent of teachers. In other words, the number of teachers that are fingered as truly terrible hasn’t gone up too much. What a fucking disaster, at least according to the NYTimes, which seems to go out of its way to make its readers understand how very much high school teachers suck.
A few things to say about this.
- Given that the VAM is nearly a random number generator, this is good news – it means they are not trusting the VAM scores blindly. Of course, it still doesn’t mean that the right teachers are getting fired, since half of the score is random.
- Another point the article mentions is that failing teachers are leaving before the reports come out. We don’t actually know how many teachers are affected by these scores.
- Anyway, what is the right number of teachers to fire each year, New York Times? And how did you choose that number? Oh wait, you quoted someone from the Brookings Institute: “It would be an unusual profession that at least 5 percent are not deemed ineffective.” Way to explain things so scientifically! It’s refreshing to know exactly how the army of McKinsey alums approach education reform.
- The overall article gives us the impression that if we were really going to do our job and “be tough on bad teachers,” then we’d weight the Value-Added Model way more. But instead we’re being pussies. Wonder what would happen if we weren’t pussies?
The second article explained just that. It also came from the New York Times (h/t Suresh Naidu), and it was a the story of a School Chief in Atlanta who took the VAM scores very very seriously.
What happened next? The teachers cheated wildly, changing the answers on their students’ tests. There was a big cover-up, lots of nasty political pressure, and a lot of good people feeling really bad, blah blah blah. But maybe we can take a step back and think about why this might have happened. Can we do that, New York Times? Maybe it had to do with the $500,000 in “performance bonuses” that the School Chief got for such awesome scores?
Let’s face it, this cheating scandal, and others like it (which may never come to light), was not hard to predict (as I explain in this post). In fact, as a predictive modeler, I’d argue that this cheating problem is the easiest thing to predict about the VAM, considering how it’s being used as an opaque mathematical weapon.
Leila Schneps is a mystery writer!
I’m back! I missed you guys bad.
My experience with Seattle in the last 8 days has convinced me of something I rather suspected, namely I’m a huge New York snob and can’t exist happily anywhere else. I will spare you the details (they have to do with cars, subways, and being an asshole pedestrian) but suffice it to say, glad to be home.
Just a few caveats on complaining about my vacation:
- I enjoyed visiting the University of Washington and giving the math colloquium there as well as a “Math Day” talk where I showed kids the winning strategy for Nim (as well as other impartial two-player games) following my notes from last summer.
- I enjoyed reading Leon and Becky’s guest posts. Thanks guys!
- And then there was the time spent with my darling family. Of course, goes without saying, it’s always magical to get to the point where your kids have invented a whole new language of insults after you’ve outlawed certain words: “Shut your fidoodle, you syncopathic lardle!”
Of all the topics I want to write about today, I’ve decided to go with the most immediate and surprising one : Leila Schneps is now a mystery writer! How cool is that? She’s written a book with her daughter, Math on Trial: How Numbers Get Used and Abused in the Courtroom, currently in stock and available on Amazon. And she wrote an op-ed for the New York Times talking about it (hat tip Chris Wiggins).
I know Leila from having been her grad student assistant at the GWU Summer Program for Women in Math the first year it existed, in 1995. She taught undergrads about Galois cohomology and interpreted elements of 

I love the premise of the book she’s written. She finds a bunch of historical examples where mathematics is used in trials to the detriment of justice, and people get unfairly jailed (or, less often, let free). From the op-ed (emphasis mine):
Decades ago, the Harvard law professor Laurence H. Tribe wrote a stinging denunciation of the use of mathematics at trial, saying that the “overbearing impressiveness” of numbers tends to “dwarf” other evidence. But we neither can nor should throw math out of the courtroom. Advances in forensics, which rely on data analysis for everything from gunpowder to DNA, mean that quantitative methods will play an ever more important role in judicial deliberations.
The challenge is to make sure that the math behind the legal reasoning is fundamentally sound. Good math can help reveal the truth. But in inexperienced hands, math can become a weapon that impedes justice and destroys innocent lives.
Go Leila!
Hackprinceton
He-Yo
This Friday, I’ll be participating at HackPrinceton.
My team will be training an EEG to recognize yes and no thoughts for particular electromechanical devices and creating general human brain interface (HBI) architecture.
We’ll be working on allowing you to turn on your phone and navigate various menus with your mind!
There’s lots of cool swag and prizes – the best being jobs at Google and Microsoft. Everyone on the team has experience in the field,* but of course the more the merrier and you’re welcome no matter what you bring (or don’t bring!) to the table.
If you’re interested, email leon.kautsky@gmail.com ASAP!
*So far we’ve got a math Ph.D., a mech engineer, some CS/Operations Research guys and while my field is finance I picked up some neuro/machine learning along the way. If you have nothing to do for the next three days and want to learn something specifically for this competition, I recommend checking out my personal favorites: neurofocus.com, frontiernerds.com or neurogadget.com.
Guest Post SuperReview Part II of VI: The Occupy Handbook Part I: How We Got Here
Whatsup.
This is a review of Part I of The Occupy Handbook. Part I consists of twelve pieces ranging in quality from excellent to awful. But enough from me, in Janet Byrne’s own words:
Part 1, “How We Got Here,” takes a look at events that may be considered precursors of OWS: the stories of a brakeman in 1877 who went up against the railroads; of the four men from an all-black college in North Carolina who staged the first lunch counter sit-in of the 1960s; of the out-of-work doctor whose nationwide, bizarrely personal Townsend Club movement led to the passage of Social Security. We go back to the 1930s and the New Deal and, in Carmen M. Reinhart and Kenneth S. Rogoff‘s “nutshell” version of their book This Time Is Different: Eight Centuries of Financial Folly, even further.
Ms. Byrne did a bang-up job getting one Nobel Prize Winner in economics (Paul Krugman), two future Economics Nobel Prize winners (Robert Shiller, Daron Acemoglu) and two maybes (sorry Raghuram Rajan and Kenneth Rogoff) to contribute excellent essays to this section alone. Powerhouse financial journalists Gillian Tett, Michael Hilztik, John Cassidy, Bethany McLean and the prolific Michael Lewis all drop important and poignant pieces into this section. Arrogant yet angry anthropologist Arjun Appadurai writes one of the worst essays I’ve ever had the misfortune of reading and the ubiquitous Brandon Adams make his first of many mediocre appearances interviewing Robert Shiller. Clocking in at 135 pages, this is the shortest section of the book yet varies the most in quality. You can skip Professor Appadurai and Cassidy’s essays, but the rest are worth reading.
Advice from the 1 Percent: Lever Up, Drop Out by Michael Lewis
Framed as a strategy memo circulated among one-percenters, Lewis’ satirical piece written after the clearing of Zucotti Park begins with a bang.
The rabble has been driven from the public parks. Our adversaries, now defined by the freaks and criminals among them, have demonstrated only that they have no idea what they are doing. They have failed to identify a single achievable goal.
Indeed, the absurd fixation on holding Zuccotti Park and refusal to issue demands because doing so “would validate the system” crippled Occupy Wall Street (OWS). So far OWS has had a single, but massive success: it shifted the conversation back to the United States’ out of control wealth inequality managed to do so in time for the election, sealing the deal on Romney. In this manner, OWS functioned as a holding action by the 99% in the interests of the 99%.
We have identified two looming threats: the first is the shifting relationship between ambitious young people and money. There’s a reason the Lower 99 currently lack leadership: anyone with the ability to organize large numbers of unsuccessful people has been diverted into Wall Street jobs, mainly in the analyst programs at Morgan Stanley and Goldman Sachs. Those jobs no longer exist, at least not in the quantities sufficient to distract an entire generation from examining the meaning of their lives. Our Wall Street friends, wounded and weakened, can no longer pick up the tab for sucking the idealism out of America’s youth.We on the committee are resigned to all elite universities becoming breeding grounds for insurrection, with the possible exception of Princeton.
Michael Lewis speaks from experience; he is a Princeton alum and a 1 percenter himself. More than that however, he is also a Wall Street alum from Salomon Brothers during the 1980s snafu and wrote about it in the original guide to Wall Street, Liar’s Poker. Perhaps because of his atypicality (and dash of solipsism), he does not have a strong handle on human(s) nature(s). By the time of his next column in Bloomberg, protests had broken out at Princeton.
Ultimately ineffectual, but still better than…
Lewis was right in the end, but more than anyone sympathetic to the movement might like. OccupyPrinceton now consists of only two bloggers, one of which has graduated and deleted all his work from an already quiet site and another who is a senior this year. OccupyHarvard contains a single poorly written essay on the front page. Although OccupyNewHaven outlasted the original Occupation, Occupy Yale no longer exists. Occupy Dartmouth hasn’t been active for over a year, although it has a rather pathetic Twitter feed here. Occupy Cornell, Brown, Caltech, MIT and Columbia don’t exist, but some have active facebook pages. Occupy Michigan State, Rutgers and NYU appear to have had active branches as recently as eight months ago, but have gone silent since. Functionally, Occupy Berkeley and its equivalents at UCBerkeley predate the Occupy movement and continue but Occupy Stanford hasn’t been active for over a year. Anecdotally, I recall my friends expressing some skepticism that any cells of the Occupy movement still existed.
As for Lewis’ other points, I’m extremely skeptical about “examined lives” being undermined by Wall Street. As someone who started in math and slowly worked his way into finance, I can safely say that I’ve been excited by many of the computing, economic, and theoretical problems quants face in their day-to-day work and I’m typical. I, and everyone who has lived long-enough, knows a handful of geniuses who have thought long and hard about the kinds of lives they want to lead and realized that A. there is no point to life unless you make one and B. making money is as good a point as any. I know one individual, after working as a professional chemist prior to college,who decided to in his words, “fuck it and be an iBanker.” He’s an associate at DB. At elite schools, my friend’s decision is the rule rather than the exception, roughly half of Harvard will take jobs in finance and consulting (for finance) this year. Another friend, an exception, quit a promising career in operations research to travel the world as a pick-up artist. Could one really say that either the operations researcher or the chemist failed to examine their lives or that with further examinations they would have come up with something more “meaningful”?
One of the social hacks to give lie to Lewis-style idealism-emerging-from-an attempt-to-examine-ones-life is to ask freshpeople at Ivy League schools what they’d like to do when they graduate and observe their choices four years later. The optimal solution for a sociopath just admitted to a top school might be to claim they’d like to do something in the peace corp, science or volunteering for the social status. Then go on to work in academia, finance, law or tech or marriage and household formation with someone who works in the former. This path is functionally similar to what many “average” elite college students will do, sociopathic or not. Lewis appears to be sincere in his misunderstanding of human(s) nature(s). In another book he reveals that he was surprised at the reaction to Liar’s Poker – most students who had read the book “treated it as a how-to manual” and cynically asked him for tips on how to land analyst jobs in the bulge bracket. It’s true that there might be some things money can’t buy, but an immensely pleasurable, meaningful life do not seem to be one of them. Today for the vast majority of humans in the Western world, expectations of sufficient levels of cold hard cash are necessary conditions for happiness.
In short and contra Lewis, little has changed. As of this moment, Occupy has proven so harmless to existing institutions that during her opening address Princeton University’s president Shirley Tilghman called on the freshmen in the class of 2016 to “Occupy” Princeton. No freshpeople have taken up her injunction. (Most?) parts of Occupy’s failure to make a lasting impact on college campuses appear to be structural; Occupy might not have succeeded even with better strategy. As the Ivy League became more and more meritocratic and better at discovering talent, many of the brilliant minds that would have fallen into the 99% and become its most effective advocates have been extracted and reached their so-called career potential, typically defined by income or status level. More meritocratic systems undermine instability by making the most talented individuals part of the class-to-be-overthrown, rather than the over throwers of that system. In an even somewhat meritocratic system, minor injustices can be tolerated: Asians and poor rural whites are classes where there is obvious evidence of discrimination relative to “merit and the decision to apply” in elite gatekeeper college admissions (and thus, life outcomes generally) and neither group expresses revolutionary sentiment on a system-threatening scale, even as the latter group’s life expectancy has begun to decline from its already low levels. In the contemporary United States it appears that even as people’s expectations of material security evaporate, the mere possibility of wealth bolsters and helps to secure inequities in existing institutions.
Lewis continues:
Hence our committee’s conclusion: we must be able to quit American society altogether, and they must know it.The modern Greeks offer the example in the world today that is, the committee has determined, best in class. Ordinary Greeks seldom harass their rich, for the simple reason that they have no idea where to find them. To a member of the Greek Lower 99 a Greek Upper One is as good as invisible.
He pays no taxes, lives no place and bears no relationship to his fellow citizens. As the public expects nothing of him, he always meets, and sometimes even exceeds, their expectations. As a result, the chief concern of the ordinary Greek about the rich Greek is that he will cease to pay the occasional visit.
Michael Lewis is a wise man.
I can recall a conversation with one of my Professors; an expert on Democratic Kampuchea (American: Khmer Rouge), she explained that for a long time the identity of the oligarchy ruling the country was kept secret from its citizens. She identified this obvious subversion of republican principles (how can you have control over your future when you don’t even know who runs your region?) as a weakness of the regime. Au contraire, I suggested, once you realize your masters are not gods, but merely humans with human characteristics, that they: eat, sleep, think, dream, have sex, recreate, poop and die – all their mystique, their claims to superior knowledge divine or earthly are instantly undermined. De facto segregation has made upper classes in the nation more secure by allowing them to hide their day-to-day opulence from people who have lost their homes, job and medical care because of that opulence. Neuroscience will eventually reveal that being mysterious makes you appear more sexy, socially dominant, and powerful, thus making your claims to power and dominance more secure (Kautsky et. al. 2018).*
If the majority of Americans manage to recognize that our two tiered legal system has created a class whose actual claim to the US immense wealth stems from, for the most part, a toxic combination of Congressional pork, regulatory and enforcement agency capture and inheritance rather than merit, there will be hell to pay. Meanwhile, resentment continues to grow. Even on the extreme right one can now regularly read things like:
Now, I think I’d be downright happy to vote for the first politician to run on a policy of sending killer drones after every single banker who has received a post-2007 bonus from a bank that received bailout money. And I’m a freaking libertarian; imagine how those who support bombing Iraqi children because they hate us for our freedoms are going to react once they finally begin to grasp how badly they’ve been screwed over by the bankers. The irony is that a banker-assassination policy would be entirely constitutional according to the current administration; it is very easy to prove that the bankers are much more serious enemies of the state than al Qaeda. They’ve certainly done considerably more damage.
Wise financiers know when it’s time to cash in their chips and disappear. Rarely, they can even pull it off with class.
The rest of part I reviewed tomorrow. Hang in there people.
Addendum 1: If your comment amounts to something like “the Nobel Prize in Economics is actually called the The Sveriges Riksbank Prize in Economic Sciences in Memory of Alfred Nobel” and thus “not a real Nobel Prize” you are correct, yet I will still delete your comment and ban your IP.
*Addendum 2: More on this will come when we talk about the Saez-Delong discussion in part III.
Guest Post SuperReview Part I of VI: The Occupy Handbook
Whassup.
It has become a truism that as the amount of news and information generated per moment continues to grow, so too does the value of aggregation, curation and editing. A point less commonly made is that these aggregators are often limited by time in the sense, whatever the topic, the value of news for the median reader decays extremely rapidly. Some extremists even claim that it’s useless to read the newspaper, so rapidly do things change. The forty eight hours news cycle, in addition to destroying context, has made it impossible for both reporters and viewers to learn from history. See “Is News Memoryless?” (Kautsky et. al. 2014).
A more promising approach to news aggregation (for those who read the news with purpose) is to organize pieces by subject and publish those articles in a book. Paul Krugman did this for himself in The Great Unraveling, bundling selected columns from 1999 to 2003 into a single book, with chapters organized by subject and proceeding chronologically. While the rise and rise of Krumgan’s real-time blogging virtually guarantees he’ll never make such an effort again, a more recent try came from uber-journalist Michael Lewis in Panic!: The Story of Modern Financial Insanity. Financial journalists’ myopic perspective at any given point in time make financial column compilations of years past particularly fun(ny) to read.
Nothing is staler than yesterday’s Wall Street journal (financial news spoils quickly) and reading WSJ or Barron’s pieces from 10 to 20 years ago is just painful.
The title PANIC: The story of modern financial insanity led me to believe the book was about the current crises. The book does say, in very, very fine print “Edited by” Michael Lewis.
-Fritz Krieger, Amazon Reviewer and chief scientist at ISIS
Unfortunately, some philistines became angry in 2008 when they insta-purchased a book called Panic! by Michael Lewis and to their horror, discovered that it contained information about prior financial crises, the nerve of the author to bring us historical perspective, even worse…some of that perspective relating to nations other than the ole’ US of A.
As the more alert readers have noted, almost nothing in the book concerns the 2008 Credit Meltdown, but instead this is merely a collection of news clippings and old magazine articles about past financial crises. You might as well visit a chiropodist’s office and offer them a couple of bucks for their old magazines.
Granted, the articles are by some of today’s finest and most celebrated journalists (although some of the news clippings are unsigned), but do you really want to read more about the 1987 crash or the 1997 collapse of the Thai Baht?
Perhaps you do, but whoever threw this book together wasn’t very particular about the articles chosen. Page 193 reprints an article from “Barron’s” of March, 2000 in which Jack Willoughby presents a long list of Internet companies that he considered likely to run out of cash by 2001. “Some can raise more funds through stock and bond offerings,” he warns. “Others will be forced to go out of business. It’s Darwinian capitalism at work.” True, many of the companies he listed did go belly-up, but on his list of the doomed are
[..]Amazon.com– Someone named Keith Otis Edwards
Perhaps because I was abroad for both the initial disaster and the entire Occupation of Zucotti Park, both events have held my attention. So it is with a mixture of hope and apprehension that I picked up Princeton alum Janet Byrne’s The Occupy Handbook from the public library. The Occupy Handbook is a collection of essays written from 2010 to 2011 by an assortment of first and second-rate authors that attempt to: show what Wall Street does and what it did that led to the most recent crash, explain why our policy apparatus was paralyzed in response to the crash, describe how OWS arose and how it compared with concurrent international movements and prior social movements in the US, and perhaps most importantly, provide policy solutions for the 99% in finance and economics. Janet Byrne begins with a heartfelt introduction:
One fall morning I stood outside the Princeton Club, on West 43rd Street in Manhattan. Occupy Wall Street, which I had visited several times as a sympathetic outsider, has passed its one month anniversary, and I thought the movement might be usefully analyzed by economists and financial writers whose pieces I would commission and assemble into a book that was analytical and- this was what really interested me – prescriptive. I’d been invited to breakfast to talk about the idea with a Princeton Club member and had arrived early out of nervousness.
It seemed a strange place to be discussing the book. I tried the idea out on a young bellhop…
And so it continues. The book is divided into three parts. Part I, broadly speaking, tries to give some economic background on the crash and the ensuing political instability that the crash engendered, up to the first occupation of Zuccotti Park. Part II, broadly speaking, describes the events in Zuccotti Park and around the world as they were in those critical months of fall 2011. Part III, broadly speaking, prescribes solutions to current depression. I say broadly speaking because, as you will see, several essays appear to be in the wrong part and in the worst cases, in the wrong book.
Modeling in Plain English
I’ve been enjoying my new job at Johnson Research Labs, where I spend a majority of the time editing my book with my co-author Rachel Schutt. It’s called Doing Data Science (now available for pre-purchase at Amazon), and it’s based on these notes I took last semester at Rachel’s Columbia class.
Recently I’ve been working on Brian Dalessandro‘s chapter on logistic regression. Before getting into the brass tacks of that algorithm, which is especially useful when you are trying to predict a binary outcome (i.e. a 0 or 1 outcome like “will click on this ad”), Brian discusses some common constraints to models.
The one that’s particularly interesting to me is what he calls “interpretability”. His example of an interpretability constraint is really good: it turns out that credit card companies have to be able to explain to people why they’ve been rejected. Brain and I tracked down the rule to this FTC website, which explains the rights of consumers who own credit cards. Here’s an excerpt where I’ve emphasized the key sentences:
You Also Have The Right To…
- Have credit in your birth name (Mary Smith), your first and your spouse’s last name (Mary Jones), or your first name and a combined last name (Mary Smith Jones).
- Get credit without a cosigner, if you meet the creditor’s standards.
- Have a cosigner other than your spouse, if one is necessary.
- Keep your own accounts after you change your name, marital status, reach a certain age, or retire, unless the creditor has evidence that you’re not willing or able to pay.
- Know whether your application was accepted or rejected within 30 days of filing a complete application.
- Know why your application was rejected. The creditor must tell you the specific reason for the rejection or that you are entitled to learn the reason if you ask within 60 days. An acceptable reason might be: “your income was too low” or “you haven’t been employed long enough.” An unacceptable reason might be “you didn’t meet our minimum standards.” That information isn’t specific enough.
- Learn the specific reason you were offered less favorable terms than you applied for, but only if you reject these terms. For example, if the lender offers you a smaller loan or a higher interest rate, and you don’t accept the offer, you have the right to know why those terms were offered.
- Find out why your account was closed or why the terms of the account were made less favorable, unless the account was inactive or you failed to make payments as agreed.
The result of this rule is that credit card companies must use simple models, probably decision trees, to make their rejection decisions.
It’s a new way to think about modeling choice, to be sure. It doesn’t necessarily make for “better” decisions from the point of view of the credit card company: random forests, a generalization of decision trees, are known to be more accurate, but are arbitrarily more complicated to explain.
So it matters what you’re optimizing for, and in this case the regulators have decided we’re optimizing for interpretability rather than accuracy. I think this is appropriate, given that consumers are at the mercy of these decisions and relatively powerless to act against them (although the FTC site above gives plenty of advice to people who have been rejected, mostly about how to raise their credit scores).
Three points to make about this. First, I’m reading the Bankers New Clothes, written by Anat Admati and Martin Hellwig (h/t Josh Snodgrass), which is absolutely excellent – I’m planning to write up a review soon. One thing they explain very clearly is the cost of regulation (specifically, higher capital requirements) from the bank’s perspective versus from the taxpayer’s perspective, and how it genuinely seems “expensive” to a bank but is actually cost-saving to the general public. I think the same thing could be said above for the credit card interpretability rule.
Second, it makes me wonder what else one could regulate in terms of plain english modeling. For example, what would happen if we added that requirement to, say, the teacher value-added model? Would we get much-needed feedback to teachers like, “You don’t have enough student participation”? Oh wait, no. The model only looks at student test scores, so would only be able to give the following kind of feedback: “You didn’t raise scores enough. Teach to the test more.”
In other words, what I like about the “Modeling in Plain English” idea is that you have to be able to first express and second back up your reasons for making decisions. It may not lead to ideal accuracy on the part of the modeler but it will lead to much greater clarity on the part of the modeled. And we could do with a bit more clarity.
Finally, what about online loans? Do they have any such interpretability rule? I doubt it. In fact, if I’m not wrong, they can use any information they can scrounge up about someone to decide on who gets a loan, and they don’t have to reveal their decision-making process to anyone. That seems unreasonable to me.
Data audits and data strategies
There are lots of start-up companies out there that want to have a data team, because they heard somewhere that they should leverage big data, but they don’t know what it really means, what they can expect from such a team, or how to get started. They also don’t really know how to hire qualified people, or what qualifications to look for.
Finally, they often don’t know what kinds of questions are answerable through data, nor what data they should be collecting to answer those questions. So even if they did manage to hire a data scientist or a data team, those guys might be literally sitting on their hands for six months until they have enough data to start work.
It’s a common situation and could end up a big waste time and money. What these companies need is something I like to call a “data audit” followed by a “data strategy”.
Data Audit
First thing’s first. Do you actually need a data team? Is your company a data science company or is it a traditional-style company that happens to collect data? It would be a waste of resources to form a data team you don’t need. There’s no reason every single company needs to consider itself part of the big data revolution just to be cool.
Here’s how you tell. Let’s say that, as of now, you’re using incoming data to monitor and report on what’s happening with the business and to keep tabs on various indicators to make sure things aren’t going to hell. Absolutely every company should do this, but it honestly could be set up by a good data analyst working closely with the end-users, i.e. the business peeps.
What are the high-level goals of using data in the business? In particular, is there a way that, if you could really know how customers or clients were interacting with your product, that you would change the product to respond to the data? Because that feedback loop is the hallmark of a true data science engine (versus data analytics).
Here are some extreme examples to give you an idea of what I’m talking about. If you make shoes, then you need data to see how sales are and which shoes are getting sold faster so you can kick up production in certain areas. You need to see how sales are seasonal so you know to stop making quite so many shoes at a certain point in the deep of winter. But that’s about it, and you should be able to make do with data analysis.
If, on the other hand, you are building a recommendation engine, say for music, then you need to constantly refresh and improve your recommendation model. Your model is your product, and you need a data team.
Not all examples are this easy. Sometimes you can use new kinds of data models to improve your product even if it seems somewhat traditional, depending on how much data you are able to collect about how your clients use your product. It all depends on what kinds of questions you are asking and what data you have access to. Of course, you might want to go out and collect data that you hadn’t bothered to do before, which could bring you from the first category to the second.
Say you decide you really are a data science company, or want to be one. What’s next?
Pose a bunch of questions you think you’ll need to answer and a bunch of data you think should be useful to answer them.
The heart of a data audit is a (preliminary) plan for choosing, collecting, and storing data, as well as figuring out the initial shape of the data pipeline and infrastructure. Do you store data in the cloud? Is it unstructured or do you set up some overnight jobs to put stuff into some type of database? Do you aggregate data and throw some stuff away, or do you keep absolutely everything?
The most important issue above is whether you’re collecting enough data. Truth be told, you could probably throw it all into an unstructured pile on S3 for now and figure out pipelines later. It might not be the best way to do it but if you are short for time and attention, it’s possible, and storage is cheap. But make sure you’re collecting the right stuff!
You’d be surprised how many startups want to ask good questions about their customers to improve their product, and have gone to some trouble to figure out what those questions are, but don’t bother to collect the relevant information. They might do things like count the number of users, or collect a timestamp for whenever a user logs in, but they don’t actually keep track of the interaction. It’s essential that you collect pertinent information if you want to use this data to check things are working or to predict people’s desires or needs.
So if you think customers might be all ditching your site at critical moments, then definitely tag their departure as well as their arrival, and keep track of where they were and what they were doing when they bailed.
Note I’m not necessarily being creepy here. You definitely want to know how people interact with your product and your site, and it doesn’t need to be personal information you’re collecting about your users. It could be kept aggregate. You could find out that 45% of people leave your site when you ask them for their phone number, and then you might decide it’s not worth it to do that.
Speaking of creepy, another critical thing to consider during your data audit is privacy controls and encryption methods. Are you saving data legally? Are you protecting it legally? Are you informing your users appropriately about how and what data will be stored? Are you planning to remain consistent with your stated privacy policy? Do you respect people’s “Do Not Track” option?
At the end of a data audit, you might still have a vague idea of what exactly you can do with your data, but you should have a bunch of possible ideas, as well as guesses at what kind of attributes would contribute to the kind of behavior you’re considering tracking.
Then, after you start collecting high-quality data and figuring out the basic questions you care about, you will probably have to wait a few weeks or months to start training and implementing your models. This is a good time to make sure your data infrastructure is in place and doesn’t have major bugs.
Data Strategy
Ok, now you’ve collected lots of data and you also have a bunch of questions you think may be answerable. It’s time to prioritize your questions and form a plan. For each question on your list, you’ll need to think about the following issues:
- Is it a monitor or an algorithm?
- Is it short-term, one-time analysis or should you set it up as a dashboard?
- How much data will you need to train the model?
- What is your expectation of the signal in the data you’re collecting?
- How useful will the results of the model be considering the range of signal and the quality of the answer?
- Do you need to go find proxy data? Should you start now?
- Which algorithms should you consider?
- What’s your evaluation method?
- Is it scalable?
- Can you do a baby version first or does it only make sense to go deep?
- Can you do a simpler version of it that’s much cheaper to build?
- How long will it probably take to train?
- How fast can it update?
- Will it be a pain to integrate it to the realtime system?
- What are the costs if it doesn’t work?
- What are the costs of not trying it? What else could you be doing with that time?
- How is the feedback loop expected to work?
- What is the impact of this model on the users?
- What is the impact of this model on the world at large? This is especially important if you’re creepy. Don’t be creepy.
Also, you need a team to build your models. How do you hire? Who do you hire? Some of these answers depend on your above plan. If there’s a lot of realtime updating for your models you’ll need more data engineers and fewer pure modelers. If you need excellent-looking results from your work you’ll need more data viz nerds.
You should consider hiring a consultant just to interview for you. It’s really hard to interview for data scientists if nobody is an expert in data science, and you might end up with someone who knows how to sounds smart but can’t build anything. Or you could end up with someone who can build anything but has no idea what their choices really mean.
The ultimate goal at the end of a data audit and strategy is to end up with a reasonable expectation of what having a data science team will accomplish, how long it will take, how deep an investment it is, and how to do it.
Black Scholes and the normal distribution
There have been lots of comments and confusion, especially in this post, over what people in finance do or do not assume about how the markets work. I wanted to dispel some myths (at the risk of creating more).
First, there’s a big difference between quantitative trading and quantitative risk. And there may be a bunch of other categories that also exist, but I’ve only worked in those two arenas.
Markets are not efficient
In quantitative trading, nobody really thinks that “markets are efficient.” That’s kind of ridiculous, since then what would be the point of trying to make money through trading? We essentially make money because they aren’t. But of course that’s not to say they are entirely inefficient. Some approaches to removing inefficiency, and some markets, are easier than others. There can be entire markets that are so old and well-combed-over that the inefficiencies (that people have thought of) have been more or less removed and so, to make money, you have to be more thoughtful. A better way to say this is that the inefficiencies that are left are smaller than the transaction costs that would be required to remove them.
It’s not clear where “removing inefficiency” ends and where a different kind of trading begins, by the way. In some sense all algorithmic trades that work for any amount of time can be thought of as removing inefficiency, but then it becomes a useless concept.
Also, you can see from the above that traders have a vested interest to introduce new kinds of markets to the system, because new markets have new inefficiencies that can be picked off.
This kind of trading is very specific to a certain kind of time horizon as well. Traders and their algorithms typically want to make money in the average year. If there’s an inefficiency with a time horizon of 30 years it may still exist but few people are patient enough for it (I should add that we also probably don’t have good enough evidence that they’d work, considering how quickly the markets change). Indeed the average quant shop is going in the opposite direction, of high speed trading, for that very reason, to find the time horizon at which there are still obvious inefficiencies.
Black-Scholes
A long long time ago, before Black Monday in 1987, people didn’t know how to price options. Then Black-Scholes came out and traders started using the Black-Scholes (BS) formula and it worked pretty well, until Black Monday came along and people suddenly realized the assumptions in BS were ridiculous. Ever since then people have adjusted the BS formula. Everyone.
There are lots of ways to think about how to adjust the formula, but a very common one is through the volatility smile. This allows us to remove the BS assumption of constant volatility (of the underlying stock) and replace it with whatever inferred volatility is actually traded on in the market for that strike price and that maturity. As this commenter mentioned, the BS formula is still used here as a convenient reference to do this calculation. If you extend your consideration to any maturity and any strike price (for the same underlying stock or thingy) then you get a volatility surface by the same reasoning.
Two things to mention. First, you can think of the volatility smile/ surface as adjusting the assumption of constant volatility, but you can also ascribe to it an adjustment of the assumption of a normal distribution of the underlying stock. There’s really no way to extricate those two assumptions, but you can convince yourself of this by a thought experiment: if the volatility stays fixed but the presumed shape of the distribution of the stocks gets fatter-tailed, for example, then option prices (for options that are far from the current price) will change, which will in turn change the implied volatility according to the market (i.e. the smile will deepen). In other words, the smile adjusts for more than one assumption.
The other thing to mention: although we’ve done a relatively good job adjusting to market reality when pricing an option, when we apply our current risk measures like Value-at-Risk (VaR) to options, we still assume a normal distribution of risk factors (one of the risk factors, if we were pricing options, would be the implied volatility). So in other words, we might have a pretty good view of current prices, but it’s not at all clear we know how to make reasonable scenarios of future pricing shifts.
Ultimately, this assumption of normal distributions of risk factors in calculating VaR is actually pretty important in terms of our view of systemic risks. We do it out of computational convenience, by the way. That and because when we use fatter-tailed assumptions, people don’t like the answer.
Team Turnstile: how do NYC neighborhoods recover from extreme weather events?
I wanted to give you the low-down on a data hackathon I participated in this weekend, which was sponsored by the NYU Institute for Public Knowledge on the topic of climate change and social information. We were assigned teams and given a very broad mandate. We had only 24 hours to do the work, so it had to be simple.
Our team consisted of Venky Kannan, Tom Levine, Eric Schles, Aaron Schumacher, Laura Noren, Stephen Fybish, and me.
We decided to think about the effects of super storms on different neighborhoods. In particular, to measure the recovery time of the subway ridership in various neighborhoods using census information. Our project was inspired by this “nofarehikes” map of New York which tries to measure the impact of a fare hike on the different parts of New York. Here’s a copy of our final slides.
Also, it’s not directly related to climate change, but rather rests on the assumption that with climate change comes more frequent extreme weather events, which seems to be an existing myth (please tell me if the evidence is or isn’t there for that myth).
We used three data sets: subway ridership by turnstile, which only exists since May 2010, the census of 2010 (which is kind of out of date but things don’t change that quickly) and daily weather observations from NOAA.
Using the weather map and relying on some formal definitions while making up some others, we came up with a timeline of extreme weather events:
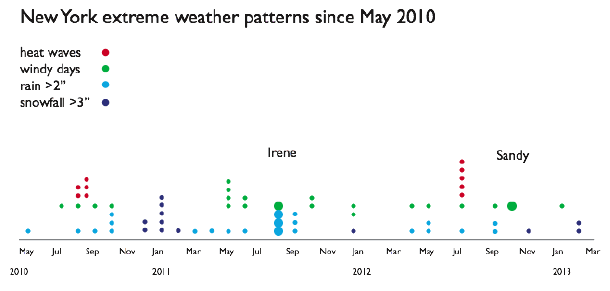
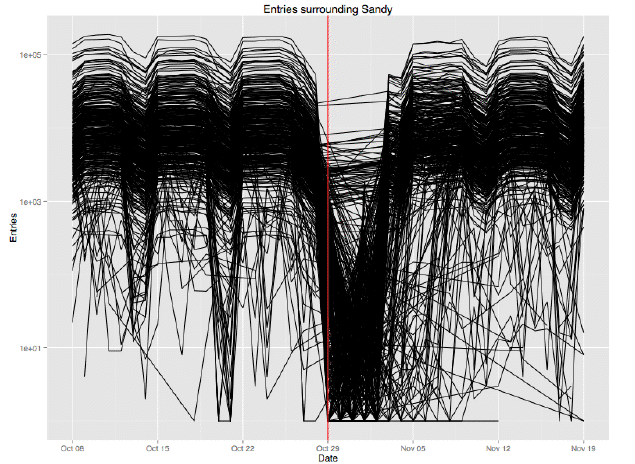
Then we looked at subway daily ridership to see the effect of the storms or the recovery from the storms:
 We broke it down to individual stations. Here’s a closeup around Sandy:
Then we used the census tracts to understand wealth in New York:
 And of course we had to know which subway stations were in which census tracts. This isn’t perfect because we didn’t have time to assign “empty” census tracts to some nearby subway station. There are on the order of 2,000 census tracts but only on the order of 800 subway stations. But again, 24 hours isn’t alot of time, even to build clustering algorithms.
Finally, we attempted to put the data together to measure which neighborhoods have longer-than-expected recovery times after extreme weather events. This is our picture:

Interestingly, it looks like the neighborhoods of Manhattan are most impacted by severe weather events, which is not in line with our prior [Update: I don’t think we actually computed the impact on a given resident, but rather just the overall change in rate of ridership versus normal. An impact analysis would take into account the relative wealth of the neighborhoods and would probably look very different].
There are tons of caveats, I’ll mention only a few here:
- We didn’t have time to measure the extent to which the recovery time took longer because the subway stopped versus other reasons people might not sure the subway. But our data is good enough to do this.
- Our data might have been overwhelmingly biased by Sandy. We’d really like to do this with much longer-term data, but the granular subway ridership data has not been available for long. But the good news is we can do this from now on.
- We didn’t have bus data at the same level, which is a huge part of whether someone can get to work, especially in the outer boroughs. This would have been great and would have given us a clearer picture.
- When someone can’t get to work, do they take a car service? How much does that cost? We’d love to have gotten our hands on the alternative ways people got to work and how that would impact them.
- In general we’d have like to measure the impact relative to their median salary.
- We would also have loved to have measured the extent to which each neighborhood consisted of salary versus hourly wage earners to further understand how a loss of transportation would translate into an impact on income.
Unintended Consequences of Journal Ranking
I just read this paper, written by Björn Brembs and Marcus Munafò and entitled “Deep Impact: Unintended consequences of journal rank”. It was recently posted on the Computer Science arXiv (h/t Jordan Ellenberg).
I’ll give you a rundown on what it says, but first I want to applaud the fact that it was written in the first place. We need more studies like this, which examine the feedback loop of modeling at a societal level. Indeed this should be an emerging scientific or statistical field of study in its own right, considering how many models are being set up and deployed on the general public.
Here’s the abstract:
Much has been said about the increasing bureaucracy in science, stifling innovation, hampering the creativity of researchers and incentivizing misconduct, even outright fraud. Many anecdotes have been recounted, observations described and conclusions drawn about the negative impact of impact assessment on scientists and science. However, few of these accounts have drawn their conclusions from data, and those that have typically relied on a few studies. In this review, we present the most recent and pertinent data on the consequences that our current scholarly communication system has had on various measures of scientific quality (such as utility/citations, methodological soundness, expert ratings and retractions). These data confirm previous suspicions: using journal rank as an assessment tool is bad scientific practice. Moreover, the data lead us to argue that any journal rank (not only the currently-favored Impact Factor) would have this negative impact. Therefore, we suggest that abandoning journals altogether, in favor of a library-based scholarly communication system, will ultimately be necessary. This new system will use modern information technology to vastly improve the filter, sort and discovery function of the current journal system.
The key points in the paper are as follows:
- There’s a growing importance of science and trust in science
- There’s also a growing rate (x20 from 2000 to 2010) of retractions, with scientific misconduct cases growing even faster to become the majority of retractions (to an overall rate of 0.02% of published papers)
- There’s a larger and growing “publication bias” problem – in other words, an increasing unreliability of published findings
- One problem: initial “strong effects” get published in high-ranking journal, but subsequent “weak results” (which are probably more reasonable) are published in low-ranking journals
- The formal “Impact Factor” (IF) metric for rank is highly correlated to “journal rank”, defined below.
- There’s a higher incidence of retraction in high-ranking (measured through “high IF”) journals.
- “A meta-analysis of genetic association studies provides evidence that the extent to which a study over-estimates the likely true effect size is positively correlated with the IF of the journal in which it is published”
- Can the higher retraction error in high-rank journal be explained by higher visibility of those journals? They think not. Journal rank is bad predictor for future citations for example. [mathbabe inserts her opinion: this part needs more argument.]
- “…only the most highly selective journals such as Nature and Science come out ahead over unselective preprint repositories such as ArXiv and RePEc”
- Are there other measures of excellence that would correlate with IF? Methodological soundness? Reproducibility? No: “In fact, the level of reproducibility was so low that no relationship between journal rank and reproducibility could be detected.
- More about Impact Factor: The IF is a metric for the number of citations to articles in a journal (the numerator), normalized by the number of articles in that journal (the denominator). Sounds good! But:
- For a given journal, IF is not calculated but is negotiated – the publisher can (and does) exclude certain articles (but not citations). Even retroactively!
- The IF is also not reproducible – errors are found and left unexplained.
- Finally, IF is likely skewed by the fat-tailedness of citations (certain articles get lots, most get few). Wouldn’t a more robust measure be given by the median?
Conclusion
- Journal rank is a weak to moderate predictor of scientific impact
- Journal rank is a moderate to strong predictor of both intentional and unintentional scientific unreliability
- Journal rank is expensive, delays science and frustrates researchers
- Journal rank as established by IF violates even the most basic scientific standards, but predicts subjective judgments of journal quality
Long-term Consequences
- “IF generates an illusion of exclusivity and prestige based on an assumption that it will predict subsequent impact, which is not supported by empirical data.”
- “Systemic pressures on the author, rather than increased scrutiny on the part of the reader, inflate the unreliability of much scientific research. Without reform of our publication system, the incentives associated with increased pressure to publish in high-ranking journals will continue to encourage scientiststo be less cautious in their conclusions (or worse), in an attempt to market their research to the top journals.”
- “It is conceivable that, for the last few decades, research institutions world-wide may have been hiring and promoting scientists who excel at marketing their work to top journals, but who are not necessarily equally good at conducting their research. Conversely, these institutions may have purged excellent scientists from their ranks, whose marketing skills did not meet institutional requirements. If this interpretation of the data is correct, we now have a generation of excellent marketers (possibly, but not necessarily also excellent scientists) as the leading figures of the scientific enterprise, constituting another potentially major contributing factor to the rise in retractions. This generation is now in charge of training the next generation of scientists, with all the foreseeable consequences for the reliability of scientific publications in the future.
The authors suggest that we need a new kind of publishing platform. I wonder what they’d think of the Episciences Project.
The overburdened prior
At my new job I’ve been spending my time editing my book with Rachel Schutt (who is joining me at JRL next week! Woohoo!). It’s called Doing Data Science and it’s based on these notes I took when she taught a class on data science at Columbia last semester. Right now I’m working on the alternating least squares chapter, where we learned from Matt Gattis how to build and optimize a recommendation system. A very cool algorithm.
However, to be honest I’ve started to feel very sorry for the one parameter we call 
Let me tell you, the world is asking too much from this little guy, and moreover most of the big-data world is too indifferent to its plight. Let me explain.

First, he’s supposed to reflect an actual prior belief – namely, his size is supposed to reflect a mathematical vision of how big we think the coefficients in our solution should be.
In an ideal world, we would think deeply about this question of size before looking at our training data, and think only about the scale of our data (i.e. the input), the scale of the preferences (i.e. the recommendation system output) and the quality and amount of training data we have, and using all of that, we’d figure out our prior belief on the size or at least the scale of our hoped-for solution.
I’m not statistician, but that’s how I imagine I’d spend my days if I were: thinking through this reasoning carefully, and even writing it down carefully, before I ever start my training. It’s a discipline like any other to carefully state your beliefs beforehand so you know you’re not just saying what the data wants to hear.
But then there’s the next thing we ask of our parameter 
Because our algorithm isn’t a closed form solution, but rather we are discovering coefficients of two separate matrices 


The fact that this algorithm will in fact stop is not obvious, and in fact it isn’t always true.
It is (mostly*) true, however, if our little
And people say that all the time. When you say, “hey what if that algorithm doesn’t converge?” They say, “oh if
But that’s kind of like worrying about your teenage daughter getting pregnant so you lock her up in her room all the time. You’ve solved the immediate problem by sacrificing an even bigger goal.
Because let’s face it, if the prior
By the way, there’s a discipline here too, and I’d suggest that if the algorithm doesn’t converge you might also want to consider reducing your number of latent variables rather than increasing your
Finally, we have one more job for our little
In other words, in reality most of the above nonsense about
This is one example among many where having the ability to push a button that makes something hard seem really easy might be doing more harm than good. In this case the button says “optimize with respect to
I’ve said it before and I’ll say it again: you do need to know about inverting a matrix, and other math too, if you want to be a good data scientist.
* There’s a change-of-basis ambiguity that’s tough to get rid of here, since you only choose the number of latent variables, not their order. This doesn’t change the overall penalty term, so you can minimize that with large enough
NYC data hackathons, past and future: Politics, Occupy, and Climate change (#OWS)
The past: Money in politics
First thing’s first, I went to the Bicoastal Datafest a few weekends ago and haven’t reported back. Mostly that’s because I got sick and didn’t go on the second day, but luckily other people did, like Kathy Kiely from the Sunlight Foundation, who wrote up this description of the event and the winning teams’ projects.
And hey, it turns out that my new company shares an office with Harmony Institute, whose data scientist Burton DeWilde was on the team that won “Best in Show” for their orchestral version of the federal government’s budget.
Another writeup of the event comes by way of Michael Lawson, who worked on the team that set up an accounting fraud detection system through Benford’s Law. I might be getting a guest blog post about this project through another one of its team members soon.
And we got some good progress on our DataKind/ Sunlight Foundation money-in-politics project as well, thanks to DataKind intern Pete Darche and math nerds Kevin Wilson and Johan de Jong.
The future one week from now: Occupy
Next up, on March 1st and 2nd at CUNY Graduate Center is this data hackathon called OccupyData (note this is a Friday and Saturday, which is unusual). You can register for the event here.
It’s a combination of an Occupy event and a datafest, so obviously I am going to try to go. The theme is general – data for the 99% – but there’s a discussion on this listserv as to the various topics people might want to focus on (Aaron Swartz and Occupy Sandy are coming up for example). I’m looking forward to reporting back (or reporting other people’s report-backs if my kids don’t let me go).
The future two weeks from now: Climate change
Finally, there’s this datathon, which doesn’t look open to registration, but which I’ll be participating in through my work. It’s stated goal is “to explore how social and meteorological data can be combined to enhance social science research on climate change and cities.” The datathon will run Saturday March 9th – Sunday March 10th, 2013, starting noon Saturday, with final presentations at noon Sunday. I’ll try to report back on that as well.
There should be a macho way to say “I don’t know”
I recently gave an interview with Russ Roberts at EconTalk, which was fun and which has generated a lot of interesting feedback for me. I had no idea so many people listened to that podcast. Turns out it’ll eventually add up to something like 50,000, with half of those people listening this week. Cool!
One thing Russ and I talked about is still on my mind. Namely, how many problems are the direct result of people pretending to understand something, or exaggerating the certainty of an uncertain quantity. People just don’t acknowledge errorbars when they should!
What up, people?
Part of the problem exists because when we model something, the model typically just comes out with a single answer, usually a number, and it seems so certain to us, so tangible, even when we know that slightly different starting conditions or inputs to our models would have resulted in a different number.
So for example, an SAT score. We know that, on a different day with a different amount of sleep or a different test, we might score significantly differently. And yet the score is the score, and it’s hugely important and we brand ourselves with it as if it’s some kind of final word.
But another part of this problem is that people are seldom incentivized to admit they don’t know something. Indeed the ones we hear from the most are professional opinion-holders, and they are going to lose their audience and their gigs if they go on air saying, “I’m not sure what’s going to happen with [the economy], we’ve honestly never been in this situation before and our data is just not sufficient to make a prediction that’s worth its weight.”
You can replace “the economy” by anything and the problem still holds.
Who’s going to say that?? Someone who doesn’t mind losing their job is who. Which is too bad, because honest people do say that quite a large portion of the time. So professional opinion-holders are kind of trained to be dishonest in this way.
And so are TED talks, but that’s a vent for another day.
I wish there were a macho way to admit you didn’t know something, so people could understand that admitting uncertainty isn’t equivalent to being wishy-washy.
I mean, sometimes I want to bust out and say, “I don’t know that, and neither do you, motherfucker!” but I’m not sure how well that would go over. Some people get touchy about profanity.
But it’s getting there, and it points to something ironic about this uncertainty-as-wishy-washiness: it is sometimes macho to point out that other people are blowing smoke. In other words, I can be a whistle blower on other people’s illusion of certainty even when I can’t make being uncertain sound cool.
I think that explains, to some extent, why so many people end up criticizing other people for false claims rather than making a stance on uncertainty themselves. The other reason of course is that it’s easier to blow holes in other people’s theories, once stated, than it is to come up with a foolproof theory of one’s own.
Any suggestions for macho approaches to errorbars?
The smell test for big data
The other day I was chatting with a data scientist (who didn’t know me), and I asked him what he does. He said that he used social media graphs to see how we might influence people to lose weight.
Whaaaa? That doesn’t pass the smell test.
If I can imagine it happening in real life, between people, then I can imagine it happening in a social medium. If it doesn’t happen in real life, it doesn’t magically appear on the internet.
So if I have a huge crush on LeBron James (true), and if he tweets that I should go out and watch “Life of Pi” because it’s a great movie (true), then I’d do it, because I’d imagine he is here with me in my living room suggesting that I see that movie, and I’d do anything that man says if he’s in my living room, especially if he’s jamming with me.

Not actually my living room.
But if LeBron James tells me to lose weight while we’re hanging, then I just feel bad and weird. Because nobody can influence someone else to lose weight in person*.
Bottomline: there’s a smell test, and it states that real influence happening inside a social graph isn’t magical just because it’s mathematically formulated. It is at best an echo of the actual influence exerted in real life. I have yet to see a counter-example to that. If you have one, please challenge me on this.
Any data scientist going around claiming they’re going to surpass this smell test should stop right now, because it adds to the hype and adds to the noise around big data without adding to the conversation.
* I’ll make an exception if they’re a doctor wielding a surgical knife about to remove my stomach or something, which doesn’t translate well into social media, and might not always work long-term. And to be fair, you (or LeBron) can influence me to not eat a given thing on a given day, or even to go on a diet, but by now we should know that doesn’t have long term effects. There’s a reason Weight Watchers either doesn’t publish their results or relies on survivorship bias for fake results.
Johnson Research Labs
I have exciting news this morning.
I’ll be starting a new job next Monday at Johnson Research Labs (JRL). It’s made up of a small group of data scientists, social scientists, and cloud computing people working on interesting problems that will hopefully have a positive impact on the world. JRL was founded recently by David Park and John Johnson and is backed by Johnson.
My first job once I’m there will be to finish my book Doing Data Science with my co-author, Rachel Schutt, who is also joining JRL from Google. The book is based on Rachel’s data science class from last semester at Columbia which I blogged about here.
Ian Langmore and Daniel Krasner, who are co-teaching another class at Columbia this semester in applied data science (along with Chang She), are also working at JRL.
Bad model + high stakes = gaming
Today let’s talk some oldish news about Michelle Rhee, the Chancellor of Washington public schools from 2007-2010, who recently appeared on the Daily Show.
Specifically I want to discuss a New York Times article from 2011 (hat tip Suresh Naidu) that is entitled “Eager for Spotlight, but Not if It Is on a Testing Scandal”.
When she was Chancellor, Rhee was a huge backer of the standardized testing approach to locating “bad teachers”. She did obnoxious stuff like carry around a broom to illustrate her “cleaning out the trash” approach. She fired a principal on camera.
She also enjoyed taking credit when scores went up, and the system rewarded those teachers with bonuses. So it was very high stakes: you get a cash incentive to improve your students’ scores and the threat of a broom if they go down.
And guess what, there was good evidence of cheating. If you want to read more details, read the article, then read this and this: short version is that a pseudo-investigation came up with nothing (surprise!) but then again scores went way down when they changed leadership and added security.
My point isn’t that we should put security in every school, though. My point is that when you implement a model which is both gameable and high stakes, you should expect it to be gamed. Don’t be surprised by that, and don’t give yourself credit that everyone is suddenly perfect by your measurement in the meantime.
Another way of saying it is that if you go around trusting the numbers, you have to be ready to trust the evidence of gaming too. You can’t have it both ways. We taxpayers should remember that next time we give the banks gameable stress tests or when we discover off-shore tax shelters by corporations.
Links to videotaped talks and pdf slides
Busy at work today but I wanted to share a few links coming out of talks I gave recently.
First the one I gave at Brown University at the Agnes Conference (October 2012). It’s called “How Math is Used outside Academia”.
Second the one I gave at Stony Brook’s colloquium (December 2012). It has the same title.
These two are videos of the same talk (although with very different audiences), so please don’t watch both of them, you will get bored! If you like friendly audiences, go with Agnes. If you like to watch me getting heckled, go with Stony Brook.
[p.s.: I pretty much never watch other people’s videos, so please don’t watch either one, actually.]
The third talk, which was the shortest, was at the Joint Math Meetings (January 2013) but I don’t think it was taped. It was called Weapons of Math Destruction and the slides are available here (I’ve turned them into a pdf).
The Sandy Hook Project
I wanted to share with you guys a project I’ve been involved with started by John Spens of Thoughtworks regarding data collection and open analysis around guns and gun-related violence. John lives in Connecticut and has friends who were directly affected by the massacre in Newtown. Here is John’s description of the project:
I initiated the Sandy Hook Project in response to this need for information. The purpose of this project is to produce rigorous and transparent analyses of data pertaining to gun-related violence. My goal is to move beyond the rhetoric and emotion and produce (hopefully) objective insight into the relationship between guns and violence in the US. I realize that objectivity will be challenging, which is why I want to share the methods and the data openly so others can validate or refute my findings as well as contribute their own.
…
I’ve put the project on GitHub. (https://github.com/john-m-spens/SandyHookProject). While it’s not designed as a data repository, I think the ubiquitous nature of GitHub and the control enforced through the code repository model will support effective collaboration.
John has written a handful of posts about statistics and guns, including A Brief Analysis of Firearm-related Homicide Rates and Investigating Statistics Regarding Right to Carry Laws.
In addition to looking into the statistics that exist, John wants to address the conversation itself. As he said in his most recent post:
What limited data and analysis that exists is often misrepresented and abused, and is given much less attention than anecdotal evidence. It is relatively simple to produce a handful of cases that support either side in this debate. What we really need is to understand the true impact of guns on our society. Push back by the NRA that any such research would be “political opinion masquerading as medical science.” is unacceptable. We can only make intelligent decisions when we have the fullest picture possible.
John is looking for nerd collaborators who can help him with data collection and open analysis. He’s also hoping to have a weekend datafest to work on this project in March, so stay tuned if you want to be part of that!


