Archive
Guest Post SuperReview Part I of VI: The Occupy Handbook
Whassup.
It has become a truism that as the amount of news and information generated per moment continues to grow, so too does the value of aggregation, curation and editing. A point less commonly made is that these aggregators are often limited by time in the sense, whatever the topic, the value of news for the median reader decays extremely rapidly. Some extremists even claim that it’s useless to read the newspaper, so rapidly do things change. The forty eight hours news cycle, in addition to destroying context, has made it impossible for both reporters and viewers to learn from history. See “Is News Memoryless?” (Kautsky et. al. 2014).
A more promising approach to news aggregation (for those who read the news with purpose) is to organize pieces by subject and publish those articles in a book. Paul Krugman did this for himself in The Great Unraveling, bundling selected columns from 1999 to 2003 into a single book, with chapters organized by subject and proceeding chronologically. While the rise and rise of Krumgan’s real-time blogging virtually guarantees he’ll never make such an effort again, a more recent try came from uber-journalist Michael Lewis in Panic!: The Story of Modern Financial Insanity. Financial journalists’ myopic perspective at any given point in time make financial column compilations of years past particularly fun(ny) to read.
Nothing is staler than yesterday’s Wall Street journal (financial news spoils quickly) and reading WSJ or Barron’s pieces from 10 to 20 years ago is just painful.
The title PANIC: The story of modern financial insanity led me to believe the book was about the current crises. The book does say, in very, very fine print “Edited by” Michael Lewis.
-Fritz Krieger, Amazon Reviewer and chief scientist at ISIS
Unfortunately, some philistines became angry in 2008 when they insta-purchased a book called Panic! by Michael Lewis and to their horror, discovered that it contained information about prior financial crises, the nerve of the author to bring us historical perspective, even worse…some of that perspective relating to nations other than the ole’ US of A.
As the more alert readers have noted, almost nothing in the book concerns the 2008 Credit Meltdown, but instead this is merely a collection of news clippings and old magazine articles about past financial crises. You might as well visit a chiropodist’s office and offer them a couple of bucks for their old magazines.
Granted, the articles are by some of today’s finest and most celebrated journalists (although some of the news clippings are unsigned), but do you really want to read more about the 1987 crash or the 1997 collapse of the Thai Baht?
Perhaps you do, but whoever threw this book together wasn’t very particular about the articles chosen. Page 193 reprints an article from “Barron’s” of March, 2000 in which Jack Willoughby presents a long list of Internet companies that he considered likely to run out of cash by 2001. “Some can raise more funds through stock and bond offerings,” he warns. “Others will be forced to go out of business. It’s Darwinian capitalism at work.” True, many of the companies he listed did go belly-up, but on his list of the doomed are
[..]Amazon.com– Someone named Keith Otis Edwards
Perhaps because I was abroad for both the initial disaster and the entire Occupation of Zucotti Park, both events have held my attention. So it is with a mixture of hope and apprehension that I picked up Princeton alum Janet Byrne’s The Occupy Handbook from the public library. The Occupy Handbook is a collection of essays written from 2010 to 2011 by an assortment of first and second-rate authors that attempt to: show what Wall Street does and what it did that led to the most recent crash, explain why our policy apparatus was paralyzed in response to the crash, describe how OWS arose and how it compared with concurrent international movements and prior social movements in the US, and perhaps most importantly, provide policy solutions for the 99% in finance and economics. Janet Byrne begins with a heartfelt introduction:
One fall morning I stood outside the Princeton Club, on West 43rd Street in Manhattan. Occupy Wall Street, which I had visited several times as a sympathetic outsider, has passed its one month anniversary, and I thought the movement might be usefully analyzed by economists and financial writers whose pieces I would commission and assemble into a book that was analytical and- this was what really interested me – prescriptive. I’d been invited to breakfast to talk about the idea with a Princeton Club member and had arrived early out of nervousness.
It seemed a strange place to be discussing the book. I tried the idea out on a young bellhop…
And so it continues. The book is divided into three parts. Part I, broadly speaking, tries to give some economic background on the crash and the ensuing political instability that the crash engendered, up to the first occupation of Zuccotti Park. Part II, broadly speaking, describes the events in Zuccotti Park and around the world as they were in those critical months of fall 2011. Part III, broadly speaking, prescribes solutions to current depression. I say broadly speaking because, as you will see, several essays appear to be in the wrong part and in the worst cases, in the wrong book.
Data science code of conduct, Evgeny Morozov
I’m going on an 8-day long trip to Seattle with my family this morning and I’m taking the time off from mathbabe. But don’t fret! I have a crack team of smartypants skeptics who are writing for me while I’m gone. I’m very much looking forward to seeing what Leon and Becky come up with.
In the meantime, I’ll leave you with two things I’m reading today.
First, a proposed Data Science Code of Professional Conduct. I don’t know anything about the guys at Rose Business Technologies who wrote it except that they’re from Boulder Colorado and have had lots of fancy consulting gigs. But I am really enjoying their proposed Data Science Code. An excerpt from the code after they define their terms:
(c) A data scientist shall rate the quality of evidence and disclose such rating to client to enable client to make informed decisions. The data scientist understands that evidence may be weak or strong or uncertain and shall take reasonable measures to protect the client from relying and making decisions based on weak or uncertain evidence.
(d) If a data scientist reasonably believes a client is misusing data science to communicate a false reality or promote an illusion of understanding, the data scientist shall take reasonable remedial measures, including disclosure to the client, and including, if necessary, disclosure to the proper authorities. The data scientist shall take reasonable measures to persuade the client to use data science appropriately.
(e) If a data scientist knows that a client intends to engage, is engaging or has engaged in criminal or fraudulent conduct related to the data science provided, the data scientist shall take reasonable remedial measures, including, if necessary, disclosure to the proper authorities.
(f) A data scientist shall not knowingly:
- fail to use scientific methods in performing data science;
- fail to rank the quality of evidence in a reasonable and understandable manner for the client;
- claim weak or uncertain evidence is strong evidence;
- misuse weak or uncertain evidence to communicate a false reality or promote an illusion of understanding;
- fail to rank the quality of data in a reasonable and understandable manner for the client;
- claim bad or uncertain data quality is good data quality;
- misuse bad or uncertain data quality to communicate a false reality or promote an illusion of understanding;
- fail to disclose any and all data science results or engage in cherry-picking;
Read the whole Code of Conduct here (and leave comments! They are calling for comments).
Second, my favorite new Silicon Valley curmudgeon is named Evgeny Morozov, and he recently wrote an opinion column in the New York Times. It’s wonderfully cynical and makes me feel like I’m all sunshine and rainbows in comparison – a rare feeling for me! Here’s an excerpt (h/t Chris Wiggins):
Facebook’s Mark Zuckerberg concurs: “There are a lot of really big issues for the world that need to be solved and, as a company, what we are trying to do is to build an infrastructure on top of which to solve some of these problems.” As he noted in Facebook’s original letter to potential investors, “We don’t wake up in the morning with the primary goal of making money.”
Such digital humanitarianism aims to generate good will on the outside and boost morale on the inside. After all, saving the world might be a price worth paying for destroying everyone’s privacy, while a larger-than-life mission might convince young and idealistic employees that they are not wasting their lives tricking gullible consumers to click on ads for pointless products. Silicon Valley and Wall Street are competing for the same talent pool, and by claiming to solve the world’s problems, technology companies can offer what Wall Street cannot: a sense of social mission.
Read the whole thing here.
Modeling in Plain English
I’ve been enjoying my new job at Johnson Research Labs, where I spend a majority of the time editing my book with my co-author Rachel Schutt. It’s called Doing Data Science (now available for pre-purchase at Amazon), and it’s based on these notes I took last semester at Rachel’s Columbia class.
Recently I’ve been working on Brian Dalessandro‘s chapter on logistic regression. Before getting into the brass tacks of that algorithm, which is especially useful when you are trying to predict a binary outcome (i.e. a 0 or 1 outcome like “will click on this ad”), Brian discusses some common constraints to models.
The one that’s particularly interesting to me is what he calls “interpretability”. His example of an interpretability constraint is really good: it turns out that credit card companies have to be able to explain to people why they’ve been rejected. Brain and I tracked down the rule to this FTC website, which explains the rights of consumers who own credit cards. Here’s an excerpt where I’ve emphasized the key sentences:
You Also Have The Right To…
- Have credit in your birth name (Mary Smith), your first and your spouse’s last name (Mary Jones), or your first name and a combined last name (Mary Smith Jones).
- Get credit without a cosigner, if you meet the creditor’s standards.
- Have a cosigner other than your spouse, if one is necessary.
- Keep your own accounts after you change your name, marital status, reach a certain age, or retire, unless the creditor has evidence that you’re not willing or able to pay.
- Know whether your application was accepted or rejected within 30 days of filing a complete application.
- Know why your application was rejected. The creditor must tell you the specific reason for the rejection or that you are entitled to learn the reason if you ask within 60 days. An acceptable reason might be: “your income was too low” or “you haven’t been employed long enough.” An unacceptable reason might be “you didn’t meet our minimum standards.” That information isn’t specific enough.
- Learn the specific reason you were offered less favorable terms than you applied for, but only if you reject these terms. For example, if the lender offers you a smaller loan or a higher interest rate, and you don’t accept the offer, you have the right to know why those terms were offered.
- Find out why your account was closed or why the terms of the account were made less favorable, unless the account was inactive or you failed to make payments as agreed.
The result of this rule is that credit card companies must use simple models, probably decision trees, to make their rejection decisions.
It’s a new way to think about modeling choice, to be sure. It doesn’t necessarily make for “better” decisions from the point of view of the credit card company: random forests, a generalization of decision trees, are known to be more accurate, but are arbitrarily more complicated to explain.
So it matters what you’re optimizing for, and in this case the regulators have decided we’re optimizing for interpretability rather than accuracy. I think this is appropriate, given that consumers are at the mercy of these decisions and relatively powerless to act against them (although the FTC site above gives plenty of advice to people who have been rejected, mostly about how to raise their credit scores).
Three points to make about this. First, I’m reading the Bankers New Clothes, written by Anat Admati and Martin Hellwig (h/t Josh Snodgrass), which is absolutely excellent – I’m planning to write up a review soon. One thing they explain very clearly is the cost of regulation (specifically, higher capital requirements) from the bank’s perspective versus from the taxpayer’s perspective, and how it genuinely seems “expensive” to a bank but is actually cost-saving to the general public. I think the same thing could be said above for the credit card interpretability rule.
Second, it makes me wonder what else one could regulate in terms of plain english modeling. For example, what would happen if we added that requirement to, say, the teacher value-added model? Would we get much-needed feedback to teachers like, “You don’t have enough student participation”? Oh wait, no. The model only looks at student test scores, so would only be able to give the following kind of feedback: “You didn’t raise scores enough. Teach to the test more.”
In other words, what I like about the “Modeling in Plain English” idea is that you have to be able to first express and second back up your reasons for making decisions. It may not lead to ideal accuracy on the part of the modeler but it will lead to much greater clarity on the part of the modeled. And we could do with a bit more clarity.
Finally, what about online loans? Do they have any such interpretability rule? I doubt it. In fact, if I’m not wrong, they can use any information they can scrounge up about someone to decide on who gets a loan, and they don’t have to reveal their decision-making process to anyone. That seems unreasonable to me.
Data audits and data strategies
There are lots of start-up companies out there that want to have a data team, because they heard somewhere that they should leverage big data, but they don’t know what it really means, what they can expect from such a team, or how to get started. They also don’t really know how to hire qualified people, or what qualifications to look for.
Finally, they often don’t know what kinds of questions are answerable through data, nor what data they should be collecting to answer those questions. So even if they did manage to hire a data scientist or a data team, those guys might be literally sitting on their hands for six months until they have enough data to start work.
It’s a common situation and could end up a big waste time and money. What these companies need is something I like to call a “data audit” followed by a “data strategy”.
Data Audit
First thing’s first. Do you actually need a data team? Is your company a data science company or is it a traditional-style company that happens to collect data? It would be a waste of resources to form a data team you don’t need. There’s no reason every single company needs to consider itself part of the big data revolution just to be cool.
Here’s how you tell. Let’s say that, as of now, you’re using incoming data to monitor and report on what’s happening with the business and to keep tabs on various indicators to make sure things aren’t going to hell. Absolutely every company should do this, but it honestly could be set up by a good data analyst working closely with the end-users, i.e. the business peeps.
What are the high-level goals of using data in the business? In particular, is there a way that, if you could really know how customers or clients were interacting with your product, that you would change the product to respond to the data? Because that feedback loop is the hallmark of a true data science engine (versus data analytics).
Here are some extreme examples to give you an idea of what I’m talking about. If you make shoes, then you need data to see how sales are and which shoes are getting sold faster so you can kick up production in certain areas. You need to see how sales are seasonal so you know to stop making quite so many shoes at a certain point in the deep of winter. But that’s about it, and you should be able to make do with data analysis.
If, on the other hand, you are building a recommendation engine, say for music, then you need to constantly refresh and improve your recommendation model. Your model is your product, and you need a data team.
Not all examples are this easy. Sometimes you can use new kinds of data models to improve your product even if it seems somewhat traditional, depending on how much data you are able to collect about how your clients use your product. It all depends on what kinds of questions you are asking and what data you have access to. Of course, you might want to go out and collect data that you hadn’t bothered to do before, which could bring you from the first category to the second.
Say you decide you really are a data science company, or want to be one. What’s next?
Pose a bunch of questions you think you’ll need to answer and a bunch of data you think should be useful to answer them.
The heart of a data audit is a (preliminary) plan for choosing, collecting, and storing data, as well as figuring out the initial shape of the data pipeline and infrastructure. Do you store data in the cloud? Is it unstructured or do you set up some overnight jobs to put stuff into some type of database? Do you aggregate data and throw some stuff away, or do you keep absolutely everything?
The most important issue above is whether you’re collecting enough data. Truth be told, you could probably throw it all into an unstructured pile on S3 for now and figure out pipelines later. It might not be the best way to do it but if you are short for time and attention, it’s possible, and storage is cheap. But make sure you’re collecting the right stuff!
You’d be surprised how many startups want to ask good questions about their customers to improve their product, and have gone to some trouble to figure out what those questions are, but don’t bother to collect the relevant information. They might do things like count the number of users, or collect a timestamp for whenever a user logs in, but they don’t actually keep track of the interaction. It’s essential that you collect pertinent information if you want to use this data to check things are working or to predict people’s desires or needs.
So if you think customers might be all ditching your site at critical moments, then definitely tag their departure as well as their arrival, and keep track of where they were and what they were doing when they bailed.
Note I’m not necessarily being creepy here. You definitely want to know how people interact with your product and your site, and it doesn’t need to be personal information you’re collecting about your users. It could be kept aggregate. You could find out that 45% of people leave your site when you ask them for their phone number, and then you might decide it’s not worth it to do that.
Speaking of creepy, another critical thing to consider during your data audit is privacy controls and encryption methods. Are you saving data legally? Are you protecting it legally? Are you informing your users appropriately about how and what data will be stored? Are you planning to remain consistent with your stated privacy policy? Do you respect people’s “Do Not Track” option?
At the end of a data audit, you might still have a vague idea of what exactly you can do with your data, but you should have a bunch of possible ideas, as well as guesses at what kind of attributes would contribute to the kind of behavior you’re considering tracking.
Then, after you start collecting high-quality data and figuring out the basic questions you care about, you will probably have to wait a few weeks or months to start training and implementing your models. This is a good time to make sure your data infrastructure is in place and doesn’t have major bugs.
Data Strategy
Ok, now you’ve collected lots of data and you also have a bunch of questions you think may be answerable. It’s time to prioritize your questions and form a plan. For each question on your list, you’ll need to think about the following issues:
- Is it a monitor or an algorithm?
- Is it short-term, one-time analysis or should you set it up as a dashboard?
- How much data will you need to train the model?
- What is your expectation of the signal in the data you’re collecting?
- How useful will the results of the model be considering the range of signal and the quality of the answer?
- Do you need to go find proxy data? Should you start now?
- Which algorithms should you consider?
- What’s your evaluation method?
- Is it scalable?
- Can you do a baby version first or does it only make sense to go deep?
- Can you do a simpler version of it that’s much cheaper to build?
- How long will it probably take to train?
- How fast can it update?
- Will it be a pain to integrate it to the realtime system?
- What are the costs if it doesn’t work?
- What are the costs of not trying it? What else could you be doing with that time?
- How is the feedback loop expected to work?
- What is the impact of this model on the users?
- What is the impact of this model on the world at large? This is especially important if you’re creepy. Don’t be creepy.
Also, you need a team to build your models. How do you hire? Who do you hire? Some of these answers depend on your above plan. If there’s a lot of realtime updating for your models you’ll need more data engineers and fewer pure modelers. If you need excellent-looking results from your work you’ll need more data viz nerds.
You should consider hiring a consultant just to interview for you. It’s really hard to interview for data scientists if nobody is an expert in data science, and you might end up with someone who knows how to sounds smart but can’t build anything. Or you could end up with someone who can build anything but has no idea what their choices really mean.
The ultimate goal at the end of a data audit and strategy is to end up with a reasonable expectation of what having a data science team will accomplish, how long it will take, how deep an investment it is, and how to do it.
Team Turnstile: how do NYC neighborhoods recover from extreme weather events?
I wanted to give you the low-down on a data hackathon I participated in this weekend, which was sponsored by the NYU Institute for Public Knowledge on the topic of climate change and social information. We were assigned teams and given a very broad mandate. We had only 24 hours to do the work, so it had to be simple.
Our team consisted of Venky Kannan, Tom Levine, Eric Schles, Aaron Schumacher, Laura Noren, Stephen Fybish, and me.
We decided to think about the effects of super storms on different neighborhoods. In particular, to measure the recovery time of the subway ridership in various neighborhoods using census information. Our project was inspired by this “nofarehikes” map of New York which tries to measure the impact of a fare hike on the different parts of New York. Here’s a copy of our final slides.
Also, it’s not directly related to climate change, but rather rests on the assumption that with climate change comes more frequent extreme weather events, which seems to be an existing myth (please tell me if the evidence is or isn’t there for that myth).
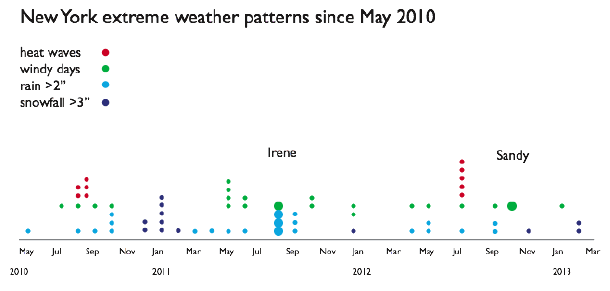
We used three data sets: subway ridership by turnstile, which only exists since May 2010, the census of 2010 (which is kind of out of date but things don’t change that quickly) and daily weather observations from NOAA.
Using the weather map and relying on some formal definitions while making up some others, we came up with a timeline of extreme weather events:
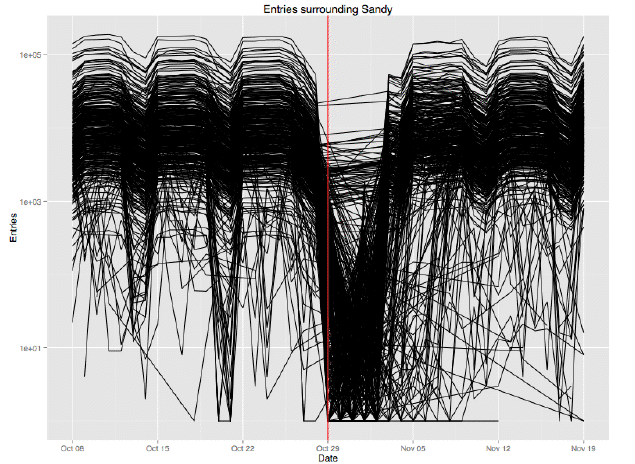
Then we looked at subway daily ridership to see the effect of the storms or the recovery from the storms:
 We broke it down to individual stations. Here’s a closeup around Sandy:
Then we used the census tracts to understand wealth in New York:
 And of course we had to know which subway stations were in which census tracts. This isn’t perfect because we didn’t have time to assign “empty” census tracts to some nearby subway station. There are on the order of 2,000 census tracts but only on the order of 800 subway stations. But again, 24 hours isn’t alot of time, even to build clustering algorithms.
Finally, we attempted to put the data together to measure which neighborhoods have longer-than-expected recovery times after extreme weather events. This is our picture:

Interestingly, it looks like the neighborhoods of Manhattan are most impacted by severe weather events, which is not in line with our prior [Update: I don’t think we actually computed the impact on a given resident, but rather just the overall change in rate of ridership versus normal. An impact analysis would take into account the relative wealth of the neighborhoods and would probably look very different].
There are tons of caveats, I’ll mention only a few here:
- We didn’t have time to measure the extent to which the recovery time took longer because the subway stopped versus other reasons people might not sure the subway. But our data is good enough to do this.
- Our data might have been overwhelmingly biased by Sandy. We’d really like to do this with much longer-term data, but the granular subway ridership data has not been available for long. But the good news is we can do this from now on.
- We didn’t have bus data at the same level, which is a huge part of whether someone can get to work, especially in the outer boroughs. This would have been great and would have given us a clearer picture.
- When someone can’t get to work, do they take a car service? How much does that cost? We’d love to have gotten our hands on the alternative ways people got to work and how that would impact them.
- In general we’d have like to measure the impact relative to their median salary.
- We would also have loved to have measured the extent to which each neighborhood consisted of salary versus hourly wage earners to further understand how a loss of transportation would translate into an impact on income.
Unintended Consequences of Journal Ranking
I just read this paper, written by Björn Brembs and Marcus Munafò and entitled “Deep Impact: Unintended consequences of journal rank”. It was recently posted on the Computer Science arXiv (h/t Jordan Ellenberg).
I’ll give you a rundown on what it says, but first I want to applaud the fact that it was written in the first place. We need more studies like this, which examine the feedback loop of modeling at a societal level. Indeed this should be an emerging scientific or statistical field of study in its own right, considering how many models are being set up and deployed on the general public.
Here’s the abstract:
Much has been said about the increasing bureaucracy in science, stifling innovation, hampering the creativity of researchers and incentivizing misconduct, even outright fraud. Many anecdotes have been recounted, observations described and conclusions drawn about the negative impact of impact assessment on scientists and science. However, few of these accounts have drawn their conclusions from data, and those that have typically relied on a few studies. In this review, we present the most recent and pertinent data on the consequences that our current scholarly communication system has had on various measures of scientific quality (such as utility/citations, methodological soundness, expert ratings and retractions). These data confirm previous suspicions: using journal rank as an assessment tool is bad scientific practice. Moreover, the data lead us to argue that any journal rank (not only the currently-favored Impact Factor) would have this negative impact. Therefore, we suggest that abandoning journals altogether, in favor of a library-based scholarly communication system, will ultimately be necessary. This new system will use modern information technology to vastly improve the filter, sort and discovery function of the current journal system.
The key points in the paper are as follows:
- There’s a growing importance of science and trust in science
- There’s also a growing rate (x20 from 2000 to 2010) of retractions, with scientific misconduct cases growing even faster to become the majority of retractions (to an overall rate of 0.02% of published papers)
- There’s a larger and growing “publication bias” problem – in other words, an increasing unreliability of published findings
- One problem: initial “strong effects” get published in high-ranking journal, but subsequent “weak results” (which are probably more reasonable) are published in low-ranking journals
- The formal “Impact Factor” (IF) metric for rank is highly correlated to “journal rank”, defined below.
- There’s a higher incidence of retraction in high-ranking (measured through “high IF”) journals.
- “A meta-analysis of genetic association studies provides evidence that the extent to which a study over-estimates the likely true effect size is positively correlated with the IF of the journal in which it is published”
- Can the higher retraction error in high-rank journal be explained by higher visibility of those journals? They think not. Journal rank is bad predictor for future citations for example. [mathbabe inserts her opinion: this part needs more argument.]
- “…only the most highly selective journals such as Nature and Science come out ahead over unselective preprint repositories such as ArXiv and RePEc”
- Are there other measures of excellence that would correlate with IF? Methodological soundness? Reproducibility? No: “In fact, the level of reproducibility was so low that no relationship between journal rank and reproducibility could be detected.
- More about Impact Factor: The IF is a metric for the number of citations to articles in a journal (the numerator), normalized by the number of articles in that journal (the denominator). Sounds good! But:
- For a given journal, IF is not calculated but is negotiated – the publisher can (and does) exclude certain articles (but not citations). Even retroactively!
- The IF is also not reproducible – errors are found and left unexplained.
- Finally, IF is likely skewed by the fat-tailedness of citations (certain articles get lots, most get few). Wouldn’t a more robust measure be given by the median?
Conclusion
- Journal rank is a weak to moderate predictor of scientific impact
- Journal rank is a moderate to strong predictor of both intentional and unintentional scientific unreliability
- Journal rank is expensive, delays science and frustrates researchers
- Journal rank as established by IF violates even the most basic scientific standards, but predicts subjective judgments of journal quality
Long-term Consequences
- “IF generates an illusion of exclusivity and prestige based on an assumption that it will predict subsequent impact, which is not supported by empirical data.”
- “Systemic pressures on the author, rather than increased scrutiny on the part of the reader, inflate the unreliability of much scientific research. Without reform of our publication system, the incentives associated with increased pressure to publish in high-ranking journals will continue to encourage scientiststo be less cautious in their conclusions (or worse), in an attempt to market their research to the top journals.”
- “It is conceivable that, for the last few decades, research institutions world-wide may have been hiring and promoting scientists who excel at marketing their work to top journals, but who are not necessarily equally good at conducting their research. Conversely, these institutions may have purged excellent scientists from their ranks, whose marketing skills did not meet institutional requirements. If this interpretation of the data is correct, we now have a generation of excellent marketers (possibly, but not necessarily also excellent scientists) as the leading figures of the scientific enterprise, constituting another potentially major contributing factor to the rise in retractions. This generation is now in charge of training the next generation of scientists, with all the foreseeable consequences for the reliability of scientific publications in the future.
The authors suggest that we need a new kind of publishing platform. I wonder what they’d think of the Episciences Project.
Poseurs should not own the backlash against data science poseurs
I’ve noticed a recent trend in coverage of data science. Namely, there’s backlash against the hype and the over-promising, intentional or not, of data science and data scientists. People are beginning to develop smell tests for big data and raise incredulous eyebrows at certain claims.
This is a good thing. We data scientists should welcome the backlash, first because it’s inevitable, and second because it allows us to have a much-needed conversation about how to behave and what is reasonable to claim or even hope for with respect to big data. There is a poseur problem in big data, after all.
But, fellow data nerds, let’s take this as a cue to start an internal discussion about data science skepticism. Let’s make sure that it’s coming from our community, or at least the surrounding technical community, rather than from yet another set of poseurs who don’t actually know what data is and would only serve to lampoon and discredit our emerging field rather than improve it. We should be the ones leading the charge and admitting when we’re full of shit. We need to own the backlash.
Let me give you an example. A serious data scientist friend of mine recently got asked to be interviewed as part of a conversation on data science skepticism. After thinking hard about what her contribution could be, she wrote back to accept the offer, but was then told she was “off the hook” because they’d found someone else who was “perfect for the assignment.” It turned out to be a journalist who had previously interviewed her. That was his credential for this conversation.
But how can you actually have informed skepticism if you are not yourself an expert?
Another example. David Brooks recently wrote a column wherein he declared himself a data science skeptic and then followed that up by referring to no fewer than eight random statistical studies that made no coherent sense and had no overall point. My conclusion: this is the wrong man to lead the charge against poseurs in data science.
If we are going to rebel against big data soundbites, let’s not do it in soundbites. Instead, let’s talk to people on the inside, who see specific problems in the field and are willing to talk openly about them.
I liked the recent Strata talk by Kate Crawford entitled “Untangling Algorithmic Illusions from Reality in Big Data” (h/t Alan Fekete) which discusses bias in data using very concrete examples, and asks us to examine the objectivity of our “facts”.
For example, she talked about a smart phone app that finds potholes in Boston and report them to the City, and how on the one hand it was cool but on the other it would mean that, if naively applied, richer neighborhoods like Lincoln would get better services than Roxbury. She explained an important point: data analysis is not objective, which most people know. But often the data itself is not either – it was collected in a certain way with particular selection biases.
We need more conversations like this or else we will be leaving a hole which will be filled with loud, uninformed skeptics who would be right to raise the alarm.
One last thing. I’m aware that tons of people, especially serious academic statisticians and computer scientists, criticize data scientists for a totally different reason, namely that we are overly self-promoting (although academics have their own status plays).
But I don’t apologize for that. The truth is, a data scientist is a hybrid between a business person and a researcher. And this is a good thing, not a bad thing: it means the world gets direct access to the modeler, and can challenge any hyperbolic claims by asking for details, rather than having to go through a marketing person who acts (usually quite poorly) as a nerd interpreter. I for one would rather represent my work directly to the world (and be called a self-promoter) then to be kept in the back room.
The overburdened prior
At my new job I’ve been spending my time editing my book with Rachel Schutt (who is joining me at JRL next week! Woohoo!). It’s called Doing Data Science and it’s based on these notes I took when she taught a class on data science at Columbia last semester. Right now I’m working on the alternating least squares chapter, where we learned from Matt Gattis how to build and optimize a recommendation system. A very cool algorithm.
However, to be honest I’ve started to feel very sorry for the one parameter we call 
Let me tell you, the world is asking too much from this little guy, and moreover most of the big-data world is too indifferent to its plight. Let me explain.

First, he’s supposed to reflect an actual prior belief – namely, his size is supposed to reflect a mathematical vision of how big we think the coefficients in our solution should be.
In an ideal world, we would think deeply about this question of size before looking at our training data, and think only about the scale of our data (i.e. the input), the scale of the preferences (i.e. the recommendation system output) and the quality and amount of training data we have, and using all of that, we’d figure out our prior belief on the size or at least the scale of our hoped-for solution.
I’m not statistician, but that’s how I imagine I’d spend my days if I were: thinking through this reasoning carefully, and even writing it down carefully, before I ever start my training. It’s a discipline like any other to carefully state your beliefs beforehand so you know you’re not just saying what the data wants to hear.
But then there’s the next thing we ask of our parameter 
Because our algorithm isn’t a closed form solution, but rather we are discovering coefficients of two separate matrices 


The fact that this algorithm will in fact stop is not obvious, and in fact it isn’t always true.
It is (mostly*) true, however, if our little
And people say that all the time. When you say, “hey what if that algorithm doesn’t converge?” They say, “oh if
But that’s kind of like worrying about your teenage daughter getting pregnant so you lock her up in her room all the time. You’ve solved the immediate problem by sacrificing an even bigger goal.
Because let’s face it, if the prior
By the way, there’s a discipline here too, and I’d suggest that if the algorithm doesn’t converge you might also want to consider reducing your number of latent variables rather than increasing your
Finally, we have one more job for our little
In other words, in reality most of the above nonsense about
This is one example among many where having the ability to push a button that makes something hard seem really easy might be doing more harm than good. In this case the button says “optimize with respect to
I’ve said it before and I’ll say it again: you do need to know about inverting a matrix, and other math too, if you want to be a good data scientist.
* There’s a change-of-basis ambiguity that’s tough to get rid of here, since you only choose the number of latent variables, not their order. This doesn’t change the overall penalty term, so you can minimize that with large enough
The smell test for big data
The other day I was chatting with a data scientist (who didn’t know me), and I asked him what he does. He said that he used social media graphs to see how we might influence people to lose weight.
Whaaaa? That doesn’t pass the smell test.
If I can imagine it happening in real life, between people, then I can imagine it happening in a social medium. If it doesn’t happen in real life, it doesn’t magically appear on the internet.
So if I have a huge crush on LeBron James (true), and if he tweets that I should go out and watch “Life of Pi” because it’s a great movie (true), then I’d do it, because I’d imagine he is here with me in my living room suggesting that I see that movie, and I’d do anything that man says if he’s in my living room, especially if he’s jamming with me.
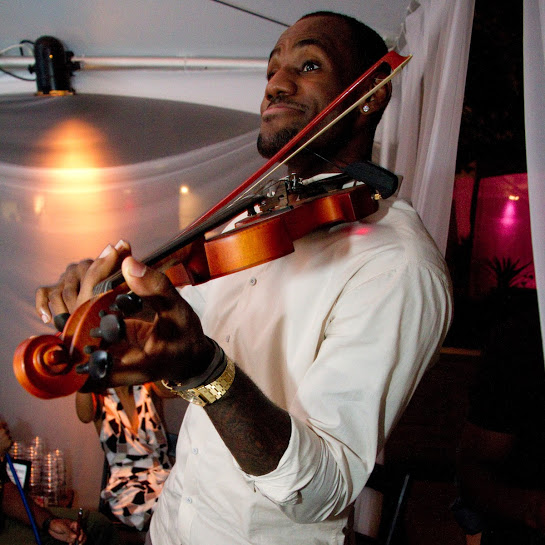
Not actually my living room.
But if LeBron James tells me to lose weight while we’re hanging, then I just feel bad and weird. Because nobody can influence someone else to lose weight in person*.
Bottomline: there’s a smell test, and it states that real influence happening inside a social graph isn’t magical just because it’s mathematically formulated. It is at best an echo of the actual influence exerted in real life. I have yet to see a counter-example to that. If you have one, please challenge me on this.
Any data scientist going around claiming they’re going to surpass this smell test should stop right now, because it adds to the hype and adds to the noise around big data without adding to the conversation.
* I’ll make an exception if they’re a doctor wielding a surgical knife about to remove my stomach or something, which doesn’t translate well into social media, and might not always work long-term. And to be fair, you (or LeBron) can influence me to not eat a given thing on a given day, or even to go on a diet, but by now we should know that doesn’t have long term effects. There’s a reason Weight Watchers either doesn’t publish their results or relies on survivorship bias for fake results.
Johnson Research Labs
I have exciting news this morning.
I’ll be starting a new job next Monday at Johnson Research Labs (JRL). It’s made up of a small group of data scientists, social scientists, and cloud computing people working on interesting problems that will hopefully have a positive impact on the world. JRL was founded recently by David Park and John Johnson and is backed by Johnson.
My first job once I’m there will be to finish my book Doing Data Science with my co-author, Rachel Schutt, who is also joining JRL from Google. The book is based on Rachel’s data science class from last semester at Columbia which I blogged about here.
Ian Langmore and Daniel Krasner, who are co-teaching another class at Columbia this semester in applied data science (along with Chang She), are also working at JRL.
Bad model + high stakes = gaming
Today let’s talk some oldish news about Michelle Rhee, the Chancellor of Washington public schools from 2007-2010, who recently appeared on the Daily Show.
Specifically I want to discuss a New York Times article from 2011 (hat tip Suresh Naidu) that is entitled “Eager for Spotlight, but Not if It Is on a Testing Scandal”.
When she was Chancellor, Rhee was a huge backer of the standardized testing approach to locating “bad teachers”. She did obnoxious stuff like carry around a broom to illustrate her “cleaning out the trash” approach. She fired a principal on camera.
She also enjoyed taking credit when scores went up, and the system rewarded those teachers with bonuses. So it was very high stakes: you get a cash incentive to improve your students’ scores and the threat of a broom if they go down.
And guess what, there was good evidence of cheating. If you want to read more details, read the article, then read this and this: short version is that a pseudo-investigation came up with nothing (surprise!) but then again scores went way down when they changed leadership and added security.
My point isn’t that we should put security in every school, though. My point is that when you implement a model which is both gameable and high stakes, you should expect it to be gamed. Don’t be surprised by that, and don’t give yourself credit that everyone is suddenly perfect by your measurement in the meantime.
Another way of saying it is that if you go around trusting the numbers, you have to be ready to trust the evidence of gaming too. You can’t have it both ways. We taxpayers should remember that next time we give the banks gameable stress tests or when we discover off-shore tax shelters by corporations.
Links to videotaped talks and pdf slides
Busy at work today but I wanted to share a few links coming out of talks I gave recently.
First the one I gave at Brown University at the Agnes Conference (October 2012). It’s called “How Math is Used outside Academia”.
Second the one I gave at Stony Brook’s colloquium (December 2012). It has the same title.
These two are videos of the same talk (although with very different audiences), so please don’t watch both of them, you will get bored! If you like friendly audiences, go with Agnes. If you like to watch me getting heckled, go with Stony Brook.
[p.s.: I pretty much never watch other people’s videos, so please don’t watch either one, actually.]
The third talk, which was the shortest, was at the Joint Math Meetings (January 2013) but I don’t think it was taped. It was called Weapons of Math Destruction and the slides are available here (I’ve turned them into a pdf).
The Sandy Hook Project
I wanted to share with you guys a project I’ve been involved with started by John Spens of Thoughtworks regarding data collection and open analysis around guns and gun-related violence. John lives in Connecticut and has friends who were directly affected by the massacre in Newtown. Here is John’s description of the project:
I initiated the Sandy Hook Project in response to this need for information. The purpose of this project is to produce rigorous and transparent analyses of data pertaining to gun-related violence. My goal is to move beyond the rhetoric and emotion and produce (hopefully) objective insight into the relationship between guns and violence in the US. I realize that objectivity will be challenging, which is why I want to share the methods and the data openly so others can validate or refute my findings as well as contribute their own.
…
I’ve put the project on GitHub. (https://github.com/john-m-spens/SandyHookProject). While it’s not designed as a data repository, I think the ubiquitous nature of GitHub and the control enforced through the code repository model will support effective collaboration.
John has written a handful of posts about statistics and guns, including A Brief Analysis of Firearm-related Homicide Rates and Investigating Statistics Regarding Right to Carry Laws.
In addition to looking into the statistics that exist, John wants to address the conversation itself. As he said in his most recent post:
What limited data and analysis that exists is often misrepresented and abused, and is given much less attention than anecdotal evidence. It is relatively simple to produce a handful of cases that support either side in this debate. What we really need is to understand the true impact of guns on our society. Push back by the NRA that any such research would be “political opinion masquerading as medical science.” is unacceptable. We can only make intelligent decisions when we have the fullest picture possible.
John is looking for nerd collaborators who can help him with data collection and open analysis. He’s also hoping to have a weekend datafest to work on this project in March, so stay tuned if you want to be part of that!
Money in politics
I’m excited about the upcoming weekend, because I’ll be at the Bicoastal Datafest: analyzing money in politics. The event is full at Columbia (but not yet at Stanford) but I believe you can still participate remotely, and of course you can keep an eye on things in any case.
One way to do that: I am setting up a wiki with my friend and colleague Lee Drutman from the Sunlight Foundation. Actually my husband set it up for us (thanks! and happy birthday!).
Let’s visualize the influence of money, people!
Bill Gates is naive, data is not objective
In his recent essay in the Wall Street Journal, Bill Gates proposed to “fix the world’s biggest problems” through “good measurement and a commitment to follow the data.” Sounds great!
Unfortunately it’s not so simple.
Gates describes a positive feedback loop when good data is collected and acted on. It’s hard to argue against this: given perfect data-collection procedures with relevant data, specific models do tend to improve, according to their chosen metrics of success. In fact this is almost tautological.
As I’ll explain, however, rather than focusing on how individual models improve with more data, we need to worry more about which models and which data have been chosen in the first place, why that process is successful when it is, and – most importantly – who gets to decide what data is collected and what models are trained.
Take Gates’s example of Ethiopia’s commitment to health care for its people. Let’s face it, it’s not new information that we should ensure “each home has access to a bed net to protect the family from malaria, a pit toilet, first-aid training and other basic health and safety practices.” What’s new is the political decision to do something about it. In other words, where Gates credits the measurement and data-collection for this, I’d suggest we give credit to the political system that allowed both the data collection and the actual resources to make it happen.
Gates also brings up the campaign to eradicate polio and how measurement has helped so much there as well. Here he sidesteps an enormous amount of politics and debate about how that campaign has been fought and, more importantly, how many scarce resources have been put towards it. But he has framed this fight himself, and has collected the data and defined the success metric, so that’s what he’s focused on.
Then he talks about teacher scoring and how great it would be to do that well. Teachers might not agree, and I’d argue they are correct to be wary about scoring systems, especially if they’ve experienced the random number generator called the Value Added Model. Many of the teacher strikes and failed negotiations are being caused by this system where, again, the people who own the model have the power.
Then he talks about college rankings and suggests we replace the flawed US News & World Reports system with his own idea, namely “measures of which colleges were best preparing their graduates for the job market”. Note I’m not arguing for keeping that US News & World Reports model, which is embarrassingly flawed and is consistently gamed. But the question is, who gets to choose the replacement?
This is where we get the closest to seeing him admit what’s really going on: that the person who defines the model defines success, and by obscuring this power behind a data collection process and incrementally improved model results, it seems somehow sanitized and objective when it’s not.
Let’s see some more example of data collection and model design not being objective:
- We see that cars are safer for men than women because the crash-test dummies are men.
- We see that cars are safer for thin people because the crash-test dummies are thin.
- We see drugs are safer and more effective for white people because blacks are underrepresented in clinical trials (which is a whole other story about power and data collection in itself).
- We see that Polaroid film used to only pick up white skin because it was optimized for white people.
- We see that poor people are uninformed by definition of how we take opinion polls (read the fine print).
Bill Gates seems genuinely interested in tackling some big problems in the world, and I wish more people thought long and hard about how they could contribute like that. But the process he describes so lovingly is in fact highly fraught and dangerous.
Don’t be fooled by the mathematical imprimatur: behind every model and every data set is a political process that chose that data and built that model and defined success for that model.
Sentiment should not be the new horizon in journalism
This is a guest post by Anchard Scott, and is cross-posted at aluation.
Nate Silver’s high-profile success in predicting the 2012 election has triggered a wave of articles on the victory of data analysts over pundits. Cathy has already taken on the troubling aspects of Silver’s celebrity, so I’d like to focus instead on the larger movement toward big data as a replacement for traditional punditry. It’s an intriguing idea, especially given the sad state of political punditry. But rather than making things better, it’s entirely possible that the methods these articles propose could make things even worse.
There’s no question that we need better media, especially when it comes to politics. If we take the media’s role to be making sure that voters are informed, then they’re clearly doing a poor job of it. And one of the biggest problems is that political coverage has largely abandoned any pretense of getting to the truth in favor of “he said/she said” and endless discussion of the horse race, with the pundits being the worst offenders. Instead of “Will this be good for citizens?” we get “Will this be good for the Democrats/Republicans in the next poll?”
This is where the big data proposals enter the picture, and where I think they go wrong. Rather than addressing the accuracy or usefulness of the information being provided to us as voters, or working to shift the dialogue away from projections of how a given policy will play in Iowa, the proposals for big data revolve around replacing pundits’ subjective claims about shifting perceptions with more objective analysis of shifting perceptions.
For example, this piece from the Awl convincingly describes the potential for the rapid analysis of thousands or even millions of articles as a basis for more effective media criticism, and as a replacement for punditry by “anecdata.” A more recent post from the Nieman Journalism Lab at least acknowledges some methodological weaknesses even as it makes a very strong case for large-scale sentiment analysis as a way of “getting beyond pundits claiming to speak for others.” By aggregating and analyzing the flow of opinion across social media, the piece argues, journalism can deliver a more finely tuned representation of public opinion.
It’s true that perceptions in a democracy matter a lot. But it’s also true that getting a more accurate read on perceptions is not going to move us toward more informative coverage, let alone toward better politics. Worse still, these proposals ignore the fact that public perception is heavily affected by media coverage, which implies that pulling public perception more explicitly into the coverage itself will just introduce reflexivity rather than clarification.
In other words, we could end up with a conversation about the conversation about the conversation about politics. Is that really what we need?
As I see it, there are two precedents here, neither of which is encouraging. Financial markets have been treated as a source of perfect information for a very long time. The most famous justification for this was Hayek’s claim that the price system inherent in markets acts as “a system of telecommunications” that condenses the most relevant information from millions of agents into a single indicator. Even if we accept this as being true when Hayek wrote his essay in 1945 (which we shouldn’t), it’s certainly not true now. That’s in part because financial markets have attracted more and more speculators who base their decisions on their expectations of what others will do rather than introducing new information. So rather than informational efficiency, we get informational cascades, herding and periodic crashes.
The other example is consumer markets, which have the most experience with sentiment analysis for obvious reasons. In fact, this analysis is only the latest service offered by an enormous industry of advertising, PR and the like that exists solely to engineer and harness these waves of sentiment and perception. Their success proves that perception doesn’t exist in some objective void, but is closely shaped by the process of thinking about and consuming the very products it’s attached to. Or to be wonky about it, preferences can be more endogenous than exogenous in a consumer society.
Which is ultimately my point. If we want to treat the information provided by the media – the primary source of information for our democracy – as a more and more finely tuned consumer good whose value is determined by how popular it is, then this sort of analysis is emphatically the way to go. But we should not be surprised by the consequences if we do.
The senseless war between business and IT/data
Last night I attended a NYC Data Business Meetup at Bloomberg, organized by Matt Turck of Bloomberg Ventures.
There were four startups talking about their analytics-for-big-data products. Most of the audience was on the entrepreneurial side of big data, and not themselves data scientists. Of the people on stage, there were four entrepreneur/marketing people and one data scientist.
I noticed, during the Q&A part at the end, that there was a weird vibe in relation to IT/data teams versus business teams. Not everyone present was involved, to be clear, but rather a consistent thread of the conversation.
There was a conflict, we were told, between business and data, and the goal of these analytics platforms seemed to be, to a large extent, a way of bypassing the need for letting data people own the data. The idea was to expedite the “handoff” between the data/IT people and the business people, so that the business people could do rapid, iterative data investigations (without interference, presumably, from pesky data people).
The discussion even went so far as to describe the IT/data team as “territorial” with the data, and there was a short discussion as to how to create processes so that control of the data is clearly spelled out and is in the hands of the business, rather than the data people.
All this left we wondering if I am crazy to believe that, as a data scientist, I am also a business person.
Are we in a war that I didn’t know about? Is it a war between the business side and the data side of the business? And are these analytics platforms the space on which the war is waged? Are they either going to make data people obsolete, by making it unnecessary to hire data scientists, or are they going to make business analytics people obsolete, by allowing data scientists to quickly iterate models?
Are there really such lines drawn, and are they necessary?
Personally, I didn’t leave research in academia so that I could be an mere implementer of a “business person”‘s idea. I left so that I could be part of the decision-making process in an agile business, so that I can be part of the process that figures out what questions to ask, and moreover how to answer them, using my quantitative background.
I don’t think this war is a good idea – instead, we should strive toward creating a scenario in which data scientists and domain experts work together towards forming the question and investigating a solution.
To silo a data person is to undervalue them – indeed my best guess as to why some business people see data people as belligerent is that they’ve been undervaluing their data people, and that tends to make people belligerent.
And to give a business analyst a button on a screen which says “clustering algorithm” is to give them tools they can perhaps use but very probably can’t interpret. It’s in nobody’s interest to do this, and it’s certainly not in the interest of the ambient business.
From now on, if someone asks me if they should accept an offer as a data scientist, I’ll suggest they find out if the place is engaged in an “IT/data versus business” war, and if they are, to run away quickly. It’s a mindset that spells trouble.
Google search is already open source
I’ve been talking a lot recently, with various people and on this blog, about data and model privacy. It seems like individuals, who should have the right to protect their data, don’t seem to, but huge private companies, with enormous powers over the public, do.
Another example: models working on behalf of the public, like Fed stress tests and other regulatory models, seem essentially publicly known, which is useful indeed to the financial insiders, the very people who are experts on gaming systems.
Google search has a deeply felt power over the public, and arguably needs to be understood for the consistent threat it poses to people’s online environment. It’s a scary thought experiment to imagine what could be done with it, and after all why should we blindly trust a corporation to have our best intentions in mind? Maybe it’s time to call for the Google search model to be open source.
But what would that look like? At first blush we might imagine forcing them to actually opening up their source code. But at this point that code must be absolutely enormous, unreadable, and written specifically for their uniquely massive machine set-up. In other words, totally overwhelming and useless (as my friend Suresh might say, the singularity has already happened and this is what it looks like (update: Suresh credits Cosma)).
Considering how many people would actually be able to make sense of the underlying code base, then you quickly realize that opening it up would be meaningless for the task of protecting the public. Instead, we’d want to make the code accessible in some way.
But I claim that’s exactly what Google does, by allowing everyone to search using the model from anywhere. In other words, it’s on us, the public, to run experiments to undertand what the underlying model actually does. We have the tools, let’s get going.
If we think there’s inherent racism in google searches, then we should run experiments like Nathan Newman recently did, examining the different ads that pop up when someone writes an email about buying a car, for example, with different names and in different zip codes. We should organize to change our zip codes, our personas (which would mean deliberately creating personas and gmail logins, etc.), and our search terms, and see how the Google search results change as our inputs change.
After all, I don’t know what’s in the code base but I’m pretty sure there’s no sub-routine that’s called “add_racism_to_search”; instead, it’s a complicated Rube-Goldberg machine that should be judged by its outputs, in a statistical way, rather than expected to prescriptively describe how it treats things on a case-by-case basis.
Another thing: I don’t think there are bad intentions on the part of the modelers, but that doesn’t mean there aren’t bad consequences – the model is too complicated for anyone to anticipate exactly how it acts unless they perform experiments to test them. In the meantime, until people undertand that, we need to distinguish between the intentions and the results. So, for example, in the update to Nathan Newman’s experiments with Google mail, Google responded with this:
This post relies on flawed methodology to draw a wildly inaccurate conclusion. If Mr. Newman had contacted us before publishing it, we would have told him the facts: we do not select ads based on sensitive information, including ethnic inferences from names.
And then Newman added this:
Now, I’m happy to hear Google doesn’t “select ads” on this basis, but Google’s words seem chosen to allow a lot of wiggle room (as such Google statements usually seem to). Do they mean that Google algorithms do not use the ethnicity of names in ad selection or are they making the broader claim that they bar advertisers from serving up different ads to people with different names?
My point is that it doesn’t matter what Google says it does or doesn’t do, if statistically speaking the ads change depending on ethnicity. It’s a moot argument what they claim to do if what actually happens, the actual output of their Rube-Goldberg machine, is racist.
And I’m not saying Google’s models are definitively racist, by the way, since Newman’s efforts were small, the efforts of one man, and there were not thousands and thousands of tests but only a few. But his approach to understanding the model was certainly correct, and it’s a cause that technologists and activists should take up and expand on.
Mathematically speaking, it’s already as open-source as we need it to be to understand it, although in a dual way than people are used to thinking about. Actually, it defines the gold standard of open-source: instead of getting a bunch of gobbly-gook that we can’t process and that depends on enormously large data that changes over time, we get real-time access to the newest version that even a child can use.
I only wish that other public-facing models had such access. Let’s create a large-scale project like SETI to understand the Google search model.
Quantifying the pull of poverty traps
In yesterday’s New York Times Science section, there was an article called “Life in the Red” (hat tip Becky Jaffe) about people’s behavior when they are in debt, summed up by this:
The usual explanations for reckless borrowing focus on people’s character, or social norms that promote free spending and instant gratification. But recent research has shown that scarcity by itself is enough to cause this kind of financial self-sabotage.
“When we put people in situations of scarcity in experiments, they get into poverty traps,” said Eldar Shafir, a professor of psychology and public affairs at Princeton. “They borrow at high interest rates that hurt them, in ways they knew to avoid when there was less scarcity.”
The psychological burden of debt not only saps intellectual resources, it also reinforces the reckless behavior, and quickly, Dr. Shafir and other experts said. Millions of Americans have been keeping the lights on through hard times with borrowed money, running a kind of shell game to keep bill collectors away.
So what we’ve got here is a feedback loop of poverty, which certainly jives with my observations of friends and acquaintances I’ve seen who are in debt.
I’m guessing the experiments described in the article are not as bad as real life, however.
I say that because I’ve been talking on this blog as well as in my recent math talks about a separate feedback loop involving models, namely the feedback loop whereby people who are judged poor by the model are offered increasingly bad terms on their loans. I call it the death spiral of modeling.
If you think about how these two effects work together – the array of offers gets worse as your vulnerability to bad deals increases – then you start to understand what half of our country is actually living through on a day-to-day basis.
As an aside, I have an enormous amount of empathy for people experiencing this poverty trap. I don’t think it’s a moral issue to be in debt: nobody wants to be poor, and nobody plans it that way.
This opinion article (hat tip Laura Strausfeld), also in yesterday’s New York Times, makes the important point that listening to a bunch of rich, judgmental people like David Bach, Dave Ramsey, and Suze Orman telling us it’s our fault we haven’t finished saving for retirement isn’t actually useful, and suggest we individually choose a money issue to take charge and sort out.
So my empathetic nerd take on poverty traps is this: how can we quantitatively measure this phenomenon, or more precisely these phenomena, since we’ve identified at least two feedback loops?
One reason it’s hard is that it’d be hard to perform natural tests where some people are submitted to the toxic environment but other people aren’t – it’s the “people who aren’t” category that’s the hard part, of course.
For the vulnerability to bad terms, the article describes the level of harassment that people receive from bill collectors as a factor in how they react, which doesn’t surprise anyone who’s ever dealt with a bill collector. Are there certain people who don’t get harassed for whatever reason, and do they fall prey to bad deals at a different rate? Are there local laws in some places prohibiting certain harassment? Can we go to another country where the bill collectors are reined in and see how people in debt behave there?
Also, in terms of availability of loans, it might be relatively easy to start out with people who live in states with payday loans versus people who don’t, and see how much faster the poverty spiral overtakes people with worse options. Of course, as crappy loans get more and more available online, this proximity study will become moot.
It’s also going to be tricky to tease out the two effects from each other. One is a question of supply and the other is a question of demand, and as we know those two are related.
I’m not answering these questions today, it’s a long-term project that I need your help on, so please comment below with ideas. Maybe if we have a few good ideas and if we find some data we can plan a data hackathon.
Should the U.S. News & World Reports college ranking model be open source?
I had a great time giving my “Weapons of Math Destruction” talk in San Diego, and the audience was fantastic and thoughtful.
One question that someone asked was whether the US News & World Reports college ranking model should be forced to be open sourced – wouldn’t that just cause colleges to game the model?
First of all, colleges are already widely gaming the model and have been for some time. And that gaming is a distraction and has been heading colleges in directions away from good instruction, which is a shame.
And if you suggest that they change the model all the time to prevent this, then you’ve got an internal model of this model that needs adjustment. They might be tinkering at the edges but overall it’s quite clear what’s going into the model: namely, graduation rates, SAT scores, number of Ph.D’s on staff, and so on. The exact percentages change over time but not by much.
The impact that this model has had on education and how universities apportion resources has been profound. Academic papers have been written on the law school version of this story.
Moreover, the tactics that US News & World Reports uses to enforce their dominance of the market are bullying, as you can learn from the President of Reed College, which refuses to be involved.
Back to the question. Just as I realize that opening up all data is not reasonable or desirable, because first of all there are serious privacy issues but second of all certain groups have natural advantages to openly shared resources, it is also true that opening up all models is similarly problematic.
However, certain data should surely be open: for example, the laws of our country, that we are all responsible to know, should be freely available to us (something that Aaron Swartz understood and worked towards). How can we be held responsible for laws we can’t read?
Similarly, public-facing models, such as credit scoring models and teacher value-added models, should absolutely be open and accessible to the public. If I’m being judged and measured and held accountable by some model in my daily life as a citizen, that has real impact on how my future will unfold, then I should know how that process works.
And if you complain about the potential gaming of those public-facing models, I’d answer: if they are gameable then they shouldn’t be used, considering the impact they have on so many people’s lives. Because a gameable model is a weak model, with proxies that fail.
Another way to say this is we should want someone to “game” the credit score model if it means they pay their bills on time every month (I wrote about this here).
Back to the US News & World Report model. Is it public facing? I’m no lawyer but I think a case can be made that it is, and that the public’s trust in this model makes it a very important model indeed. Evidence can be gathered by measuring the extent to which colleges game the model, which they only do because the public cares so much about the rankings.
Even so, what difference would that make, to open it up?
In an ideal world, where the public is somewhat savvy about what models can and cannot do, opening up the US News & World Reports college ranking model would result in people losing faith in it. They’d realize that it’s no more valuable than an opinion from a highly vocal uncle of theirs who is obsessed with certain metrics and blind to individual eccentricities and curriculums that may be a perfect match for a non-conformist student. It’s only one opinion among many, and not to be religiously believed.
But this isn’t an ideal world, and we have a lot of work to do to get people to understand models as opinions in this sense, and to get people to stop trusting them just because they’re mathematically presented.


