Archive
Thanks for a great case study, Facebook!
I’m super excited about the recent “mood study” that was done on Facebook. It constitutes a great case study on data experimentation that I’ll use for my Lede Program class when it starts mid-July. It was first brought to my attention by one of my Lede Program students, Timothy Sandoval.
My friend Ernest Davis at NYU has a page of handy links to big data articles, and at the bottom (for now) there are a bunch of links about this experiment. For example, this one by Zeynep Tufekci does a great job outlining the issues, and this one by John Grohol burrows into the research methods. Oh, and here’s the original research article that’s upset everyone.
It’s got everything a case study should have: ethical dilemmas, questionable methodology, sociological implications, and questionable claims, not to mention a whole bunch of media attention and dissection.
By the way, if I sound gleeful, it’s partly because I know this kind of experiment happens on a daily basis at a place like Facebook or Google. What’s special about this experiment isn’t that it happened, but that we get to see the data. And the response to the critiques might be, sadly, that we never get another chance like this, so we have to grab the opportunity while we can.
The dark matter of big data
A tiny article in The Cap Times was recently published (hat tip Jordan Ellenberg) which describes the existence of a big data model which claims to help filter and rank school teachers based on their ability to raise student test scores. I guess it’s a kind of pre-VAM filtering system, and if it was hard to imagine a more vile model than the VAM, here you go. The article mentioned that the Madison School Board was deliberating on whether to spend $273K on this model.
One of the teachers in the district wrote her concerns about this model in her blog and then there was a debate at the school board meeting, and a journalist covered the meeting, so we know about it. But it was a close call, and this one could have easily slipped under the radar, or at least my radar.
Even so, now I know about it, and once I looked at the website of the company promoting this model, I found links to an article where they name a customer, for example in the Charlotte-Mecklenburg School District of North Carolina. They claim they only filter applications using their tool, they don’t make hiring decisions. Cold comfort for people who got removed by some random black box algorithm.
I wonder how many of the teachers applying to that district knew their application was being filtered through such a model? I’m going to guess none. For that matter, there are all sorts of application screening algorithms being regularly used of which applicants are generally unaware.
It’s just one example of the dark matter of big data. And by that I mean the enormous and growing clusters of big data models that are only inadvertently detectable by random small-town or small-city budget meeting journalism, or word-of-mouth reports coming out of conferences or late-night drinking parties with VC’s.
The vast majority of big data dark matter is still there in the shadows. You can only guess at its existence and its usage. Since the models themselves are proprietary, and are generally deployed secretly, there’s no reason for the public to be informed.
Let me give you another example, this time speculative, but not at all unlikely.
Namely, big data health models arising from the quantified self movement data. This recent Wall Street Journal article entitled Can Data From Your Fitbit Transform Medicine? articulated the issue nicely:
A recent review of 43 health- and fitness-tracking apps by the advocacy group Privacy Rights Clearinghouse found that roughly one-third of apps tested sent data to a third party not disclosed by the developer. One-third of the apps had no privacy policy. “For us, this is a big trust issue,” said Kaiser’s Dr. Young.
Consumer wearables fall into a regulatory gray area. Health-privacy laws that prevent the commercial use of patient data without consent don’t apply to the makers of consumer devices. “There are no specific rules about how those vendors can use and share data,” said Deven McGraw, a partner in the health-care practice at Manatt, Phelps, and Phillips LLP.
The key is that phrase “regulatory gray area”; it should make you think “big data dark matter lives here”.
When you have unprotected data that can be used as a proxy of HIPAA-protected medical data, there’s no reason it won’t be. So anyone who wants stands to benefit from knowing health-related information about you – think future employers who might help pay for future insurance claims – will be interested in using big data dark matter models gleaned from this kind of unregulated data.
To be sure, most people nowadays who wear fitbits are athletic, trying to improve their 5K run times. But the article explained that the medical profession is on the verge of suggesting a much larger population of patients use such devices. So it could get ugly real fast.
Secret big data models aren’t new, of course. I remember a friend of mine working for a credit card company a few decades ago. Her job was to model which customers to offer subprime credit cards to, and she was specifically told to target those customers who would end up paying the most in fees. But it’s become much much easier to do this kind of thing with the proliferation of so much personal data, including social media data.
I’m interested in the dark matter, partly as research for my book, and I’d appreciate help from my readers in trying to spot it when it pops up. For example, I remember begin told that a certain kind of online credit score is used to keep people on hold for customer service longer, but now I can’t find a reference to it anywhere. We should really compile a list at the boundaries of this dark matter. Please help! And if you don’t feel comfortable commenting, my email address is on the About page.
The business of big data audits: monetizing fairness
I gave a talk to the invitation-only NYC CTO Club a couple of weeks ago about my fears about big data modeling, namely:
- that big data modeling is discriminatory,
- that big data modeling increases inequality, and
- that big data modeling threatens democracy.
I had three things on my “to do” list for the audience of senior technologists, namely:
- test internal, proprietary models for discrimination,
- help regulators like the CFPB develop reasonable audits, and
- get behind certain models being transparent and publicly accessible, including credit scoring, teacher evaluations, and political messaging models.
Given the provocative nature of my talk, I was pleasantly surprised by the positive reception I was given. Those guys were great – interactive, talkative, and very thoughtful. I think it helped that I wasn’t trying to sell them something.
Even so, I shouldn’t have been surprised when one of them followed up with me to talk about a possible business model for “fairness audits.” The idea is that, what with the recent bad press about discrimination in big data modeling (some of the audience had actually worked with the Podesta team), there will likely be a business advantage to being able to claim that your models are fair. So someone should develop those tests that companies can take. Quick, someone, monetize fairness!
One reason I think this might actually work – and more importantly, be useful – is that I focused on “effects-based” discrimination, which is to say testing a model by treating it like a black box and seeing how it works on different inputs and gives different outputs. In other words, I want to give a resume-sorting algorithm different resumes with similar qualifications but different races. An algorithmically induced randomized experiment, if you will.
From the business perspective, a test that allows a model to remain a black box feels safe, because it does not require true transparency, and allows the “secret sauce” to remain secret.
One thing, though. I don’t think it makes too much sense to have a proprietary model for fairness auditing. In fact the way I was imagining this was to develop an open-source audit model that the CFPB could use. What I don’t want, and which would be worse than nothing, would be if some private company developed a proprietary “fairness audit” model that we cannot trust and would claim to solve the very real problems listed above.
Update: something like this is already happening for privacy compliance in the big data world (hat tip David Austin).
Inside the Podesta Report: Civil Rights Principles of Big Data
I finished reading Podesta’s Big Data Report to Obama yesterday, and I have to say I was pretty impressed. I credit some special people that got involved with the research of the report like Danah Boyd, Kate Crawford, and Frank Pasquale for supplying thoughtful examples and research that the authors were unable to ignore. I also want to thank whoever got the authors together with the civil rights groups that created the Civil Rights Principles for the Era of Big Data:
- Stop High-Tech Profiling. New surveillance tools and data gathering techniques that can assemble detailed information about any person or group create a heightened risk of profiling and discrimination. Clear limitations and robust audit mechanisms are necessary to make sure that if these tools are used it is in a responsible and equitable way.
- Ensure Fairness in Automated Decisions. Computerized decisionmaking in areas such as employment, health, education, and lending must be judged by its impact on real people, must operate fairly for all communities, and in particular must protect the interests of those that are disadvantaged or that have historically been the subject of discrimination. Systems that are blind to the preexisting disparities faced by such communities can easily reach decisions that reinforce existing inequities. Independent review and other remedies may be necessary to assure that a system works fairly.
- Preserve Constitutional Principles. Search warrants and other independent oversight of law enforcement are particularly important for communities of color and for religious and ethnic minorities, who often face disproportionate scrutiny. Government databases must not be allowed to undermine core legal protections, including those of privacy and freedom of association.
- Enhance Individual Control of Personal Information. Personal information that is known to a corporation — such as the moment-to-moment record of a person’s movements or communications — can easily be used by companies and the government against vulnerable populations, including women, the formerly incarcerated, immigrants, religious minorities, the LGBT community, and young people. Individuals should have meaningful, flexible control over how a corporation gathers data from them, and how it uses and shares that data. Non-public information should not be disclosed to the government without judicial process.
- Protect People from Inaccurate Data. Government and corporate databases must allow everyone — including the urban and rural poor, people with disabilities, seniors, and people who lack access to the Internet — to appropriately ensure the accuracy of personal information that is used to make important decisions about them. This requires disclosure of the underlying data, and the right to correct it when inaccurate.
This was signed off on by multiple civil rights groups listed here, and it’s a great start.
One thing I was not impressed by: the only time the report mentioned finance was to say that, in finance, they are using big data to combat fraud. In other words, finance was kind of seen as an industry standing apart from big data, and using big data frugally. This is not my interpretation.
In fact, I see finance as having given birth to big data. Many of the mistakes we are making as modelers in the big data era, which require the Civil Rights Principles as above, were made first in finance. Those modeling errors – and when not errors, politically intentional odious models – were created first in finance, and were a huge reason we first had the mortgage-backed-securities rated with AAA ratings and then the ensuing financial crisis.
In fact finance should have been in the report standing as a worst case scenario.
One last thing. The recommendations coming out of the Podesta report are lukewarm and are even contradicted by the contents of the report, as I complained about here. That’s interesting, and it shows that politics played a large part of what the authors could include as acceptable recommendations to the Obama administration.
No, Sandy Pentland, let’s not optimize the status quo
It was bound to happen. Someone was inevitably going to have to write this book, entitled Social Physics, and now someone has just up and done it. Namely, Alex “Sandy” Pentland, data scientist evangelist, director of MIT’s Human Dynamics Laboratory, and co-founder of the MIT Media Lab.
A review by Nicholas Carr
This article entitled The Limits of Social Engineering, published in MIT’s Technology Review and written by Nicholas Carr (hat tip Billy Kaos) is more or less a review of the book. From the article:
Pentland argues that our greatly expanded ability to gather behavioral data will allow scientists to develop “a causal theory of social structure” and ultimately establish “a mathematical explanation for why society reacts as it does” in all manner of circumstances. As the book’s title makes clear, Pentland thinks that the social world, no less than the material world, operates according to rules. There are “statistical regularities within human movement and communication,” he writes, and once we fully understand those regularities, we’ll discover “the basic mechanisms of social interactions.”
By collecting all the data – credit card, sensor, cell phones that can pick up your moods, etc. – Pentland seems to think we can put the science into social sciences. He thinks we can predict a person like we now predict planetary motion.
OK, let’s just take a pause here to say: eeeew. How invasive does that sound? And how insulting is its premise? But wait, it gets way worse.
The next think Pentland wants to do is use micro-nudges to affect people’s actions. Like paying them to act a certain way, and exerting social and peer pressure. It’s like Nudge in overdrive.
Vomit. But also not the worst part.
Here’s the worst part about Pentland’s book, from the article:
Ultimately, Pentland argues, looking at people’s interactions through a mathematical lens will free us of time-worn notions about class and class struggle. Political and economic classes, he contends, are “oversimplified stereotypes of a fluid and overlapping matrix of peer groups.” Peer groups, unlike classes, are defined by “shared norms” rather than just “standard features such as income” or “their relationship to the means of production.” Armed with exhaustive information about individuals’ habits and associations, civic planners will be able to trace the full flow of influences that shape personal behavior. Abandoning general categories like “rich” and “poor” or “haves” and “have-nots,” we’ll be able to understand people as individuals—even if those individuals are no more than the sums of all the peer pressures and other social influences that affect them.
Kill. Me. Now.
The good news is that the author of the article, Nicholas Carr, doesn’t buy it, and makes all sorts of reasonable complaints about this theory, like privacy concerns, and structural sources of society’s ills. In fact Carr absolutely nails it (emphasis mine):
Pentland may be right that our behavior is determined largely by social norms and the influences of our peers, but what he fails to see is that those norms and influences are themselves shaped by history, politics, and economics, not to mention power and prejudice. People don’t have complete freedom in choosing their peer groups. Their choices are constrained by where they live, where they come from, how much money they have, and what they look like. A statistical model of society that ignores issues of class, that takes patterns of influence as givens rather than as historical contingencies, will tend to perpetuate existing social structures and dynamics. It will encourage us to optimize the status quo rather than challenge it.
How to see how dumb this is in two examples
This brings to mind examples of models that do or do not combat sexism.
First, the orchestra audition example: in order to avoid nepotism, they started making auditioners sit behind a sheet. The result has been way more women in orchestras.
This is a model, even if it’s not a big data model. It is the “orchestra audition” model, and the most important thing about this example is that they defined success very carefully and made it all about one thing: sound. They decided to define the requirements for the job to be “makes good sounding music” and they decided that other information, like how they look, would be by definition not used. It is explicitly non-discriminatory.
By contrast, let’s think about how most big data models work. They take historical information about successes and failures and automate them – rather than challenging their past definition of success, and making it deliberately fair, they are if anything codifying their discriminatory practices in code.
My standard made-up example of this is close to the kind of thing actually happening and being evangelized in big data. Namely, a resume sorting model that helps out HR. But, using historical training data, this model notices that women don’t fare so well historically at a the made-up company as computer programmers – they often leave after only 6 months and they never get promoted. A model will interpret that to mean they are bad employees and never look into structural causes. And moreover, as a result of this historical data, it will discard women’s resumes. Yay, big data!
Thanks, Pentland
I’m kind of glad Pentland has written such an awful book, because it gives me an enemy to rail against in this big data hype world. I don’t think most people are as far on the “big data will solve all our problems” spectrum as he is, but he and his book present a convenient target. And it honestly cannot surprise anyone that he is a successful white dude as well when he talks about how big data is going to optimize the status quo if we’d just all wear sensors to work and to bed.
Great news: InBloom is shutting down
I’m trying my hardest to resist talking about Piketty’s Capital because I haven’t read it yet, even though I’ve read a million reviews and discussions about it, and I saw him a couple of weeks ago on a panel with my buddy Suresh Naidu. Suresh, who was great on the panel, wrote up his notes here.
So I’ll hold back from talking directly about Piketty, but let me talk about one of Suresh’s big points that was inspired in part by Piketty. Namely, the fact that it’s a great time to be rich. It’s even greater now to be rich than it was in the past, even when there were similar rates of inequality. Why? Because so many things have become commodified. Here’s how Suresh puts it:
We live in a world where much more of everyday life occurs on markets, large swaths of extended family and government services have disintegrated, and we are procuring much more of everything on markets. And this is particularly bad in the US. From health care to schooling to philanthropy to politicians, we have put up everything for sale. Inequality in this world is potentially much more menacing than inequality in a less commodified world, simply because money buys so much more. This nasty complementarity of market society and income inequality maybe means that the social power of rich people is higher today than in the 1920s, and one response to increasing inequality of market income is to take more things off the market and allocate them by other means.
I think about this sometimes in the field of education in particular, and to that point I’ve got a tiny bit of good news today.
Namely, InBloom is shutting down (hat tip Linda Brown). You might not remember what InBloom is, but I blogged about this company a while back in my post Big Data and Surveillance, as well as the ongoing fight against InBloom in New York state by parents here.
The basic idea is that InBloom, which was started in cooperation with the Bill and Melinda Gates Foundation and Rupert Murdoch’s Amplify, would collect huge piles of data on students and their learning and allow third party companies to mine that data to improve learning. From this New York Times article:
InBloom aimed to streamline personalized learning — analyzing information about individual students to customize lessons to them — in public schools. It planned to collect and integrate student attendance, assessment, disciplinary and other records from disparate school-district databases, put the information in cloud storage and release it to authorized web services and apps that could help teachers track each student’s progress.
It’s not unlike the idea that Uber has, of connecting drivers with people needing rides, or that AirBNB has, of connecting people needing a room with people with rooms: they are platforms, not cab companies or hoteliers, and they can use that matchmaking status as a way to duck regulations.
The problem here is that the relevant child data protection regulation, called FERPA, is actually pretty strong, and InBloom and companies like it were largely bypassing that law, as was discovered by a Fordham Law study led by Joel Reidenberg. In particular, the study found that InBloom and other companies were offering what seemed like “free” educational services, but of course the deal really was in exchange for the children’s data, and the school officials who were agreeing to the deals had no clue as to what they were signing. The parents were bypassed completely. Much of the time the contracts were in direct violation of FERPA, but often the school officials didn’t even have copies of the contracts and hadn’t heard of FERPA.
Because of that report and other bad publicity, we saw growing resistance in New York State by parents, school board members and privacy lawyers. And thanks to that resistance, New York State Legislature recently passed a budget that prohibited state education officials from releasing student data to amalgamators like inBloom. InBloom has subsequently decided to close down.
I’m not saying that the urge to privatize education – and profit off of it – isn’t going to continue after a short pause. For that matter look at the college system. Even so, let’s take a moment to appreciate the death of one of the more egregious ideas out there.
An Interview And A Notebook
Interview on Junk Charts
Yesterday I was featured on Kaiser Fung’s Junk Charts blog in an interview where he kindly refers to me as a “Numbersense Pro”. Previous to this week, my strongest connection with Kaiser Fung was through Andrew Gelman’s meta-review of my review and Kaiser’s review of Nate Silver’s book The Signal And The Noise.
iPython Notebook in Data Journalism
Speaking of Nate Silver, Brian Keegan, a quantitative social scientist from Northeastern University, recently built a very cool iPython notebook (hat tip Ben Zaitlen), replete with a blog post in markdown on the need for openness in journalism (also available here), which revisited a fivethirtyeight article originally written by Walt Hickey on the subject of women in film. Keegan’s notebook is truly a model of open data journalism, and the underlying analysis is also interesting, so I hope you have time to read it.
Let’s not replace the SAT with a big data approach
The big news about the SAT is that the College Boards, which makes the SAT, has admitted there is a problem, which is widespread test-prep and gaming. As I talked about in this post, the SAT mainly serves to sort people by income.
It shouldn’t be a surprise to anyone when a weak proxy gets gamed. Yesterday I discussed this very thing in the context of Google’s PageRank algorithm, and today it’s student learning aptitude. The question is, what do we do next?
Rick Bookstaber wrote an interesting post yesterday (hat tip Marcos Carreira) with an idea to address the SAT problem with the same approach that I’m guessing Google is addressing the PageRank problem, namely by abandoning the poor proxy and getting a deeper, more involved one. Here’s Bookstaber’s suggestion:
You would think that in the emerging world of big data, where Amazon has gone from recommending books to predicting what your next purchase will be, we should be able to find ways to predict how well a student will do in college, and more than that, predict the colleges where he will thrive and reach his potential. Colleges have a rich database at their disposal: high school transcripts, socio-economic data such as household income and family educational background, recommendations and the extra-curricular activities of every applicant, and data on performance ex post for those who have attended. For many universities, this is a database that encompasses hundreds of thousands of students.
There are differences from one high school to the next, and the sample a college has from any one high school might be sparse, but high schools and school districts can augment the data with further detail, so that the database can extend beyond those who have applied. And the data available to the colleges can be expanded by orders of magnitude if students agree to share their admission data and their college performance on an anonymized basis. There already are common applications forms used by many schools, so as far as admission data goes, this requires little more than adding an agreement in the college applications to share data; the sort of agreement we already make with Facebook or Google.
The end result, achievable in a few years, is a vast database of high school performance, drilling down to the specific high school, coupled with the colleges where each student applied, was accepted and attended, along with subsequent college performance. Of course, the nature of big data is that it is data, so students are still converted into numerical representations. But these will cover many dimensions, and those dimensions will better reflect what the students actually do. Each college can approach and analyze the data differently to focus on what they care about. It is the end of the SAT version of standardization. Colleges can still follow up with interviews, campus tours, and reviews of musical performances, articles, videos of sports, and the like. But they will have a much better filter in place as they do so.
Two things about this. First, I believe this is largely already happening. I’m not an expert on the usage of student data at colleges and universities, but the peek I’ve had into this industry tells me that the analytics are highly advanced (please add related comments and links if you have them!). And they have more to do with admissions and college aid – and possibly future alumni giving – than any definition of academic success. So I think Bookstaber is being a bit naive and idealistic if he thinks colleges will use this information for good. They already have it and they’re not.
Secondly, I want to think a little bit harder about when the “big, deeper data” approach makes sense. I think it does for teachers to some extent, as I talked about yesterday, because after all it’s part of a job to get evaluated. For that matter I expect this kind of thing to be part of most jobs soon (but it will be interesting to see when and where it stops – I’m pretty sure Bloomberg will never evaluate himself quantitatively).
I don’t think it makes sense to evaluate children in the same way, though. After all, we’re basically talking about pre-consensual surveillance, not to mention the collection and mining of information far beyond the control of the individual child. And we’re proposing to mine demographic and behavioral data to predict future success. This is potentially much more invasive than just one crappy SAT test. Childhood is a time which we should try to do our best to protect, not quantify.
Also, the suggestion that this is less threatening because “the data is anonymized” is misleading. Stripping out names in historical data doesn’t change or obscure the difference between coming from a rich high school or a poor one. In the end you will be judged by how “others like you” performed, and in this regime the system gets off the hook but individuals are held accountable. If you think about it, it’s exactly the opposite of the American dream.
I don’t want to be naive. I know colleges will do what they can to learn about their students and to choose students to make themselves look good, at least as long as the US News & World Reports exists. I’d like to make it a bit harder for them to do so.
The endgame for PageRank
First there was Google Search, and then pretty quickly SEOs came into existence.
SEOs are marketing people hired by businesses to bump up the organic rankings for that business in Google Search results. That means they pay people to make their website more attractive and central to Google Search so they don’t have to pay for ads but will get visitors anyway. And since lots of customers come from search results, this is a big deal for those businesses.
Since Google Search was based on a pretty well-known, pretty open algorithm called PageRank which relies on ranking the interestingness of pages by their links, SEOs’ main jobs were to add links and otherwise fiddle with links to and from the websites of their clients. This worked pretty well at the beginning and the businesses got higher rank and they didn’t have to pay for it, except they did have to pay for the SEOs.
But after a while Google caught on to the gaming and adjusted its search algorithm, and SEOs responded by working harder at gaming the system (see more history here). It got more expensive but still kind of worked, and nowadays SEOs are a big business. And the algorithm war is at full throttle, with some claiming that Google Search results are nowadays all a bunch of crappy, low-quality ads.
This is to be expected, of course, when you use a proxy like “link” to indicate something much deeper and more complex like “quality of website”. Since it’s so high stakes, the gaming acts to decouple the proxy entirely from its original meaning. You end up with something that is in fact the complete opposite of what you’d intended. It’s hard to address except by giving up the proxy altogether and going for something much closer to what you care about.
Recently my friend Jordan Ellenberg sent me an article entitled The Future of PageRank: 13 Experts on the Dwindling Value of the Link. It’s an insider article, interviewing 13 SEO experts on how they expect Google to respond to the ongoing gaming of the Google Search algorithm.
The experts don’t all agree on the speed at which this will happen, but there seems to be some kind of consensus that Google will stop relying on links as such and will go to user behavior, online and offline, to rank websites.
If correct, this means that we can expect Google to pump all of our email, browsing, and even GPS data to understand our behaviors in a minute fashion in order to get at a deeper understanding of how we perceive “quality” and how to monetize that. Because, let’s face it, it’s all about money. Google wants good organic searches so that people won’t abandon its search engine altogether so it can sell ads.
So we’re talking GPS on your android, or sensor data, and everything else it can get its hands on through linking up various data sources (which as I read somewhere is why Google+ still exists at all, but I can’t seem to find that article on Google).
It’s kind of creepy all told, and yet I do see something good coming out of it. Namely, it’s what I’ve been saying we should be doing to evaluate teachers, instead of using crappy and gameable standardized tests. We should go deeper and try to define what we actually think makes a good teacher, which will require sensors in the classroom to see if kids are paying attention and are participating and such.
Maybe Google and other creepy tech companies can show us the way on this one, although I don’t expect them to explain their techniques in detail, since they want to stay a step ahead of SEO’s.
Julia Angwin’s Dragnet Nation
I recently devoured Julia Angwin‘s new book Dragnet Nation: A Quest for Privacy, Security, and Freedom in a World of Relentless Surveillance. I actually met Julia a few months ago and talked to her briefly about her upcoming book when I visited the ProPublica office downtown, so it was an extra treat to finally get my hands on the book.
First off, let me just say this is an important book, and a provides a crucial and well-described view into the private data behind the models that I get so worried about. After reading this book you have a good idea of the data landscape as well as many of the things that can currently go wrong for you personally with the associated loss of privacy. So for that reason alone I think this book should be widely read. It’s informational.
Julia takes us along her journey of trying to stay off the grid, and for me the most fascinating parts are her “data audit” (Chapter 6), where she tries to figure out what data about her is out there and who has it, and the attempts she makes to clean the web of her data and generally speaking “opt out”, which starts in Chapter 7 but extends beyond that when she makes the decision to get off of gmail and LinkedIn. Spoiler alert: her attempts do not succeed.
From the get go Julia is not a perfectionist, which is a relief. She’s a working mother with a web presence, and she doesn’t want to live in paranoid fear of being tracked. Rather, she wants to make the trackers work harder. She doesn’t want to hand herself over to them on a silver platter. That is already very very hard.
In fact, she goes pretty far, and pays for quite a few different esoteric privacy services; along the way she explores questions like how you decide to trust the weird people who offer those services. At some point she finds herself with two phones – including a “burner”, which made me think she was a character in House of Cards – and one of them was wrapped up in tin foil to avoid the GPS tracking. That was a bit far for me.
Early on in the book she compares the tracking of a U.S. citizen with what happened under Nazi Germany, and she makes the point that the Stasi would have been amazed by all this technology.
Very true, but here’s the thing. The culture of fear was very different then, and although there’s all this data out there, important distinctions need to be made: both what the data is used for and the extent to which people feel threatened by that usage are very different now.
Julia brought these up as well, and quoted sci-fi writer David Brin: The key question is, who has access? and what do they do with it?
Probably the most interesting moment in the book was when she described the so-called “Wiretapper’s Ball”, a private conference of private companies selling surveillance hardware and software to governments to track their citizens. Like maybe the Ukrainian government used such stuff when they texted warning messages to to protesters.
She quoted the Wiretapper’s Ball organizer Jerry Lucas as saying “We don’t really get into asking, ‘Is in the public’s interest?'”.
That’s the closest the book got to what I consider the critical question: to what extent is the public’s interest being pursued, if at all, by all of these data trackers and data miners?
And if the answer is “to no extent, by anyone,” what does that mean in the longer term? Julia doesn’t go much into this from an aggregate viewpoint, since her perspective is both individual and current.
At the end of the book, she makes a few interesting remarks. First, it’s just too much work to stay off the grid, and moreover it’s become entirely commoditized. In other words, you have to either be incredibly sophisticated or incredibly rich to get this done, at least right now. My guess is that, in the future, it will be more about the latter category: privacy will be enjoyed only by those people who can afford it.
Julia also mentions near the end that, even though she didn’t want to get super paranoid, she found herself increasingly inside a world based on fear and well on her way to becoming a “data survivalist,” which didn’t sound pleasant. It is not a lot of fun to be the only person caring about the tracking in a world of blithe acceptance.
Julia had some ways of measuring a tracking system, which she refers to as a “dragnet”, which seems to me a good place to start:
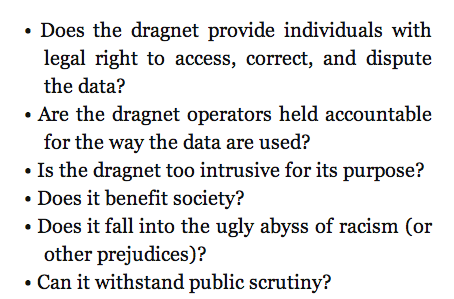 It’s a good start.
Speaking tonight at NYC Open Data
Tonight I’ll be giving a talk at the NYC Open Data Meetup, organized by Vivian Zhang. I’ll be discussing my essay from last year entitled On Being a Data Skeptic, as well as my Doing Data Science book. I believe there are still spots left if you’d like to attend. The details are as follows:
When: Thursday, March 6, 2014, 7:00 PM to 9:00 PM
Where: Enigma HQ, 520 Broadway, 11th Floor, New York, NY (map)
Schedule:
- 6:15pm: Doors Open for pizza and casual networking
- 7:00pm: Workshop begins
- 8:30pm: Audience Q&A
How much is your data worth?
I heard an NPR report yesterday with Emily Steel, reporter from the Financial Times, about what kind of attributes make you worth more to advertisers. She has developed an ingenious online calculator here, which you should go play with.
As you can see it cares about things like whether you’re about to have a kid or are a new parent, as well as if you’ve got some disease where the industry for that disease is well-developed in terms of predatory marketing.
For example, you can bump up your worth to $0.27 from the standard $0.0007 if you’re obese, and another $0.10 if you admit to being the type to buy weight-loss products. And of course data warehouses can only get that much money for your data if they know about your weight, which they may or may not since if you don’t buy weight-loss products.
The calculator doesn’t know everything, and you can experiment with how much it does know, but some of the default assumptions are that it knows my age, gender, education level, and ethnicity. Plenty of assumed information to, say, build an unregulated version of a credit score to bypass the Equal Credit Opportunities Act.
Here’s a price list with more information from the biggest data warehouser of all, Acxiom.
What privacy advocates get wrong
There’s a wicked irony when it comes to many privacy advocates.
They are often narrowly focused on the their own individual privacy issues, but when it comes down to it they are typically super educated well-off nerds with few revolutionary thoughts. In other words, the very people obsessing over their privacy are people who are not particularly vulnerable to the predatory attacks of either the NSA or the private companies that make use of private data.
Let me put it this way. If I’m a data scientist working at a predatory credit card firm, seeking to build a segmentation model to target the most likely highly profitable customers – those that ring up balances and pay off minimums every month, sometimes paying late to accrue extra fees – then if I am profiling a user and notice an ad blocker or some other signal of privacy concerns, chances are that becomes a wealth indicator and I leave them alone. The mere presence of privacy concerns signals that this person isn’t worth pursuing with my manipulative scheme.
If you don’t believe me, take a look at a recent Slate article written by Cyrus Nemati and entitled Take My Data Please: How I learned to stop worrying and love a less private internet.
In it he describes how he used to be privacy obsessed, for no better reason than that he like to stick up a middle finger to those who would collect his data. I think that article should have been called something like, Well-educated white guy was a privacy freak until he realized he didn’t have to be because he’s a well-educated white guy.
He concludes that he really likes how well customized things are to his particular personality, and that shucks, we should all just appreciate the web and stop fretting.
But here’s the thing, the problem isn’t that companies are using his information to screw Cyrus Nemati. The problem is that the most vulnerable people – the very people that should be concerned with privacy but aren’t – are the ones getting tracked, mined, and screwed.
In other words, it’s silly for certain people to be scrupulously careful about their private data if they are the types of people who get great credit card offers and have a stable well-paid job and are generally healthy. I include myself in this group. I do not prevent myself from being tracked, because I’m not at serious risk.
And I’m not saying nothing can go wrong for those people, including me. Things can, especially if they suddenly lose their jobs or they have kids with health problems or something else happens which puts them into a special category. But generally speaking those people with enough time on their hands and education to worry about these things are not the most vulnerable people.
I hereby challenge Cyrus Nemati to seriously consider who should be concerned about their data being collected, and how we as a society are going to address their concerns. Recent legislation in California is a good start for kids, and I’m glad to see the New York Times editors asking for more.
What is regulation for?
A couple of days ago I was listening to a recorded webinar on K-12 student data privacy. I found out about it through an education blog I sometimes read called deutsch29, where the blog writer was complaining about “data chearleaders” on a panel and how important issues are sure to be ignored if everyone on a panel is on the same, pro-data and pro-privatization side.
Well as it turns out deutsch29 was almost correct. Most of the panelists were super bland and pro-data collection by private companies. But the first panelist named Joel Reidenberg, from Fordham Law School, reported on the state of data sharing in this country, the state of the law, and the gulf between the two.
I will come back to his report in another post, because it’s super fascinating, and in fact I’d love to interview that guy for my book.
One thing I wanted to mention was the high-level discussion that took place in the webinar on what regulation is for. Specifically, the following important question was asked:
Does every parent have to become a data expert in order to protect their children’s data?
The answer was different depending on who answered it, of course, but one answer that resonated with me was that that’s what regulation is for, it exists so that parents can rely on regulation to protect their children’s privacy, just as we expect HIPAA to protect the integrity of our medical data.
I started to like this definition – or attribute, if you will – of regulation, and I wondered how it relates to other kinds of regulation, like in finance, as well as how it would work if you’re arguing with people who hate all regulation.
First of all, I think that the financial industry has figured out how to make things so goddamn complicated that nobody can figure out how to regulate anything well. Moreover, they’ve somehow, at least so far, also been able to insist things need to be this complicated. So even if regulation were meant to allow people to interact with the financial system and at the same time “not be experts,” it’s clearly not wholly working. But what I like about it anyway is the emphasis on this issue of complexity and expertise. It took me a long time to figure out how big a problem that is in finance, but with this definition it goes right to the heart of the issue.
Second, as for the people who argue for de-regulation, I think it helps there too. Most of the time they act like everyone is a omniscient free agent who spends all their time becoming expert on everything. And if that were true, then it’s possible that regulation wouldn’t be needed (although transparency is key too). The point is that we live in a world where most people have no clue about the issues of data privacy, never mind when it’s being shielded by ridiculous and possibly illegal contracts behind their kids’ public school system.
Finally, in terms of the potential for protecting kids’ data: here the private companies like InBloom and others are way ahead of regulators, but it’s not because of complexity on the issues so much as the fact that regulators haven’t caught up with technology. At least that’s my optimistic feeling about it. I really think this stuff is solvable in the short term, and considering it involves kids, I think it will have bipartisan support. Plus the education benefits of collecting all this data have not been proven at all, nor do they really require such shitty privacy standards even if they do work.
I’m writing a book called Weapons of Math Destruction
I’m incredibly excited to announce that I am writing a book called Weapons of Math Destruction for Random House books, with my editor Amanda Cook. There will also be a subtitle which we haven’t decided on yet.
Here’s how this whole thing went down. First I met my amazing book agent Jay Mandel from William Morris though my buddy Jordan Ellenberg. As many of you know, Jordan is also writing a book but it’s much farther along in the process and has already passed the editing phase. Jordan’s book is called How Not To Be Wrong and it’s already available for pre-order on Amazon.
Anyhoo, Jay spent a few months with me telling me how to write a book proposal, and it was a pretty substantial undertaking actually and required more than just an outline. It was like a short treatment of all the chapters but then two chapters pretty filled in, including the first, and as you know the first is kind of like an advertisement for the whole rest of the book.
Then, once that proposal was ready, Jay started what he hoped would be a bidding war for the proposal among publishers. He had a whole list of people he talked to from all over the place in the publishing world.
What actually happened though was Amanda Cook from Crown Publishing, which is part of Random House, was the first person who was interested enough to talk to me about it, and then we hit it off really well, and she made a pre-emptive offer for the book so the full on bidding war didn’t end up needing to happen. And then just last week she announced the deal in what’s called the Publisher’s Marketplace, which is for people inside publishing to keep abreast of the deals and news. The actual link is here, but it’s behind a pay wall, so Amanda got me a screen shot:

If that font is too small, it says something like this:
Harvard math Ph.D., former Wall Street quant, and advisor to the Occupy movement Cathy O’Neil’s WEAPONS OF MATH DESTRUCTION, arguing that mathematical modeling has become a pervasive and destructive force in society—in finance, education, medicine, politics, and the workplace—and showing how current models exacerbate inequality and endanger democracy and how we might rein them in, to Amanda Cook at Crown in a pre-empt by Jay Mandel at William Morris Endeavor (NA).
So as you can tell I’m incredibly excited about the book, and I have tons of ideas about it, but of course I’d love my readers to weigh in on crucial examples of models and industries that you think might get overlooked.
Please, post a comment or send me an email (located on my About page) with your favorite example of a family of models (Value Added Model for teachers is already in!) or a specific model (Value-at-Risk model in finance in already!) that is illustrative of feedback loops, or perverted incentives, or creepy modeling, or some such concept that you imagine I’ll be writing about (or should be!). Thanks so much for your input!
One last thing. I’m aiming to finish the writing part by next Spring, and then the book is actually released about 9 months later. It takes a while. I’m super glad I have had the experience of writing a technical book with O’Reilly as well as the homemade brew Occupy Finance with my Occupy group so I know at least some of the ropes, but even so this is a bit more involved.
Parents fighting back against sharing children’s data with InBloom
There is a movement afoot in New York (and other places) to allow private companies to house and mine tons of information about children and how they learn. It’s being touted as a great way to tailor online learning tools to kids, but it also raises all sorts of potential creepy modeling problems, and one very bad sign is how secretive everything is in terms of privacy issues. Specifically, it’s all being done through school systems and without consulting parents.
In New York it’s being done through InBloom, which I already mentioned here when I talked about big data and surveillance. In that post I related an EducationNewYork report which quoted an official from InBloom as saying that the company “cannot guarantee the security of the information stored … or that the information will not be intercepted when it is being transmitted.”
The issue is super important and timely, and parents have been left out of the loop, with no opt-out option, and are actively fighting back, for example with this petition from MoveOn (h/t George Peacock). And although the InBloomers claim that no data about their kids will ever be sold, that doesn’t mean it won’t be used by third parties for various mining purposes and possibly marketing – say for test prep tools. In fact that’s a major feature of InBloom’s computer and data infrastructure, the ability for third parties to plug into the data. Not cool that this is being done on the downlow.
Who’s behind this? InBloom is funded by the Bill & Melinda Gates foundation and the operating system for inBloom is being developed by the Amplify division (formerly Wireless Generation) of Rupert Murdoch’s News Corp. More about the Murdoch connection here.
Wait, who’s paying for this? Besides the Gates and Murdoch, New York has spent $50 million in federal grants to set up the partnership with InBloom. And it’s not only New York that is pushing back, according to this Salon article:
InBloom essentially offers off-site digital storage for student data—names, addresses, phone numbers, attendance, test scores, health records—formatted in a way that enables third-party education applications to use it. When inBloom was launched in February, the company announced partnerships with school districts in nine states, and parents were outraged. Fears of a “national database” of student information spread. Critics said that school districts, through inBloom, were giving their children’s confidential data away to companies who sought to profit by proposing a solution to a problem that does not exist. Since then, all but three of those nine states have backed out.
Finally, according to this nydailynews article, Bill de Blasio is coming out on the side of protecting children’s privacy as well. That’s a good sign, let’s hope he sticks with it.
I’m not against using technology to learn, and in fact I think it’s inevitable and possibly very useful. But first we need to have a really good, public discussion about how this data is being shared, controlled, and protected, and that simply hasn’t happened. I’m glad to see parents are aware of this as a problem.
Computer, do I really want to get married?
There’s a new breed of models out there nowadays that reads your face for subtle expressions of emotions, possibly stuff that normal humans cannot pick up on. You can read more about it here, but suffice it to say it’s a perfect target for computers – something that is free information, that can be trained over many many examples, and then deployed everywhere and anywhere, even without our knowledge since surveillance cameras are so ubiquitous.
Plus, there are new studies that show that, whether you’re aware of it or not, a certain “gut feeling”, which researchers can get at by asking a few questions, will expose whether your marriage is likely to work out.
Let’s put these two together. I don’t think it’s too much of a stretch to imagine that surveillance cameras strategically placed at an altar can now make predictions on the length and strength of a marriage.
Oh goodie!
I guess it brings up the following question: is there some information we are better off not knowing? I don’t think knowing my marriage is likely to be in trouble would help me keep the faith. And every marriage needs a good dose of faith.
I heard a radio show about Huntington’s disease. There’s no cure for it, but there is a simple genetic test to see if you’ve got it, and it usually starts in adulthood so there’s plenty of time for adults to see their parents degenerate and start to worry about themselves.
But here’s the thing, only 5% of people who have a 50% chance of having Huntington’s actually take that test. For them the value of not knowing that information is larger than knowing. Of course knowing you don’t have it is better still, but until that happens the ambiguity is preferable.
Maybe what’s critical is that there’s no cure. I mean, if there was therapy that would help Huntington’s disease sufferers delay it or ameliorate it, I think we’d see far more people taking that genetic marker test.
And similarly, if there were ways to save a marriage that is at risk, we might want to know on the altar what the prognosis is. Right?
I still don’t know. Somehow, when things get that personal and intimate, I’d rather be left alone, even if an algorithm could help me “optimize my love life”. But maybe that’s just me being old-fashioned, and maybe in 100 years people will treat their computers like love oracles.
PDF Liberation Hackathon: January 17-19
This is a guest post by Marc Joffe, the principal consultant at Public Sector Credit Solutions, an organization that provides data and analysis related to sovereign and municipal securities. Previously, Joffe was a Senior Director at Moody’s Analytics.
As Cathy has argued, open source models can bring much needed transparency to scientific research, finance, education and other fields plagued by biased, self-serving analytics. Models often need large volumes of data, and if the model is to be run on an ongoing basis, regular data updates are required.
Unfortunately, many data sets are not ready to be loaded into your analytical tool of choice; they arrive in an unstructured form and must be organized into a consistent set of rows and columns. This cleaning process can be quite costly. Since open source modeling efforts are usually low dollar operations, the costs of data cleaning may prove to be prohibitive. Hence no open model – distortion and bias continue their reign.
Much data comes to us in the form of PDFs. Say, for example, you want to model student loan securitizations. You will be confronted with a large number of PDF servicing reports that look like this. A corporation or well funded research institution can purchase an expensive, enterprise-level ETL (Extract-Transform-Load) tool to migrate data from the PDFs into a database. But this is not much help to insurgent modelers who want to produce open source work.
Data journalists face a similar challenge. They often need to extract bulk data from PDFs to support their reporting. Examples include IRS Form 990s filed by non-profits and budgets issued by governments at all levels.
The data journalism community has responded to this challenge by developing software to harvest usable information from PDFs. Examples include Tabula, a tool written by Knight-Mozilla OpenNews Fellow Manuel Aristarán, extracts data from PDF tables in a form that can be readily imported to a spreadsheet – if the PDF was “printed” from a computer application. Introduced earlier this year, Tabula continues to evolve thanks to the volunteer efforts of Manuel, with help from OpenNews Fellow Mike Tigas and New York Times interactive developer Jeremy Merrill. Meanwhile, DocHive, a tool whose continuing development is being funded by a Knight Foundation grant, addresses PDFs that were created by scanning paper documents. DocHive is a project of Raleigh Public Record and is led by Charles and Edward Duncan.
These open source tools join a number of commercial offerings such as Able2Extract and ABBYY Fine Reader that extract data from PDFs. A more comprehensive list of open source and commercial resources is available here.
Unfortunately, the free and low cost tools available to modelers, data journalists and transparency advocates have limitations that hinder their ability to handle large scale tasks. If, like me, you want to submit hundreds of PDFs to a software tool, press “Go” and see large volumes of cleanly formatted data, you are out of luck.
It is for this reason that I am working with The Sunlight Foundation and other sponsors to stage the PDF Liberation Hackathon from January 17-19, 2014. We’ll have hack sites at Sunlight’s Washington DC office and at RallyPad in San Francisco. Developers can also join remotely because we will publish a number of clearly specified PDF extraction challenges before the hackathon.
Participants can work on one of the pre-specified challenges or choose their own PDF extraction projects. Ideally, hackathon teams will use (and hopefully improve upon) open source tools to meet the hacking challenges, but they will also be allowed to embed commercial tools into their projects as long as their licensing cost is less than $1000 and an unlimited trial is available.
Prizes of up to $500 will be awarded to winning entries. To receive a prize, a team must publish their source code on a GitHub public repository. To join the hackathon in DC or remotely, please sign up at Eventbrite; to hack with us in SF, please sign up via this Meetup. Please also complete our Google Form survey. Also, if anyone reading this is associated with an organization in New York or Chicago that would like to organize an additional hack space, please contact me.
The PDF Liberation Hackathon is going to be a great opportunity to advance the state of the art when it comes to harvesting data from public documents. I hope you can join us.
Algorithmic Accountability Reporting: On the Investigation of Black Boxes
Tonight I’m going to be on a panel over at Columbia’s Journalism School called Algorithmic Accountability Reporting: On the Investigation of Black Boxes. It’s being organized by Nick Diakopoulos, Tow Fellow and previous guest blogger on mathbabe. You can sign up to come here and it will also be livestreamed.
The other panelists are Scott Klein from ProPublica and Clifford Stein from Columbia. I’m super excited to meet them.
Unlike some panel discussions I’ve been on, where the panelists talk about some topic they choose for a few minutes each and then there are questions, this panel will be centered around a draft of a paper coming from the Tow Center at Columbia. First Nick will present the paper and then the panelists will respond to it. Then there will be Q&A.
I wish I could share it with you but it doesn’t seem publicly available yet. Suffice it to say it has many elements in common with Nick’s guest post on raging against the algorithms, and its overall goal is to understand how investigative journalism should handle a world filled with black box algorithms.
Super interesting stuff, and I’m looking forward to tonight, even if it means I’ll miss the New Day New York rally in Foley Square tonight.
“People analytics” embeds old cultural problems in new mathematical models
Today I’d like to discuss recent article from the Atlantic entitled “They’re watching you at work” (hat tip Deb Gieringer).
In the article they describe what they call “people analytics,” which refers to the new suite of managerial tools meant to help find and evaluate employees of firms. The first generation of this stuff happened in the 1950’s, and relied on stuff like personality tests. It didn’t seem to work very well and people stopped using it.
But maybe this new generation of big data models can be super useful? Maybe they will give us an awesome way of throwing away people who won’t work out more efficiently and keeping those who will?
Here’s an example from the article. Royal Dutch Shell sources ideas for “business disruption” and wants to know which ideas to look into. There’s an app for that, apparently, written by a Silicon Valley start-up called Knack.
Specifically, Knack had a bunch of the ideamakers play a video game, and they presumably also were given training data on which ideas historically worked out. Knack developed a model and was able to give Royal Dutch Shell a template for which ideas to pursue in the future based on the personality of the ideamakers.
From the perspective of Royal Dutch Shell, this represents huge timesaving. But from my perspective it means that whatever process the dudes at Royal Dutch Shell developed for vetting their ideas has now been effectively set in stone, at least for as long as the algorithm is being used.
I’m not saying they won’t save time, they very well might. I’m saying that, whatever their process used to be, it’s now embedded in an algorithm. So if they gave preference to a certain kind of arrogance, maybe because the people in charge of vetting identified with that, then the algorithm has encoded it.
One consequence is that they might very well pass on really excellent ideas that happened to have come from a modest person – no discussion necessary on what kind of people are being invisible ignored in such a set-up. Another consequence is that they will believe their process is now objective because it’s living inside a mathematical model.
The article compares this to the “blind auditions” for orchestras example, where people are kept behind a curtain so that the listeners don’t give extra consideration to their friends. Famously, the consequence of blind auditions has been way more women in orchestras. But that’s an extremely misleading comparison to the above algorithmic hiring software, and here’s why.
In the blind auditions case, the people measuring the musician’s ability have committed themselves to exactly one clean definition of readiness for being a member of the orchestra, namely the sound of the person playing the instrument. And they accept or deny someone, sight unseen, based solely on that evaluation metric.
Whereas with the idea-vetting process above, the training data consisted of “previous winners” which presumable had to go through a series of meetings and convince everyone in the meeting that their idea had merit, and that they could manage the team to try it out, and all sorts of other things. Their success relied, in other words, on a community’s support of their idea and their ability to command that support.
In other words, imagine that, instead of listening to someone playing trombone behind a curtain, their evaluation metric was to compare a given musician to other musicians that had already played in a similar orchestra and, just to make it super success-based, had made first seat.
That you’d have a very different selection criterion, and a very different algorithm. It would be based on all sorts of personality issues, and community bias and buy-in issues. In particular you’d still have way more men.
The fundamental difference here is one of transparency. In the blind auditions case, everyone agrees beforehand to judge on a single transparent and appealing dimension. In the black box algorithms case, you’re not sure what you’re judging things on, but you can see when a candidate comes along that is somehow “like previous winners.”
One of the most frustrating things about this industry of hiring algorithms is how unlikely it is to actively fail. It will save time for its users, since after all computers can efficiently throw away “people who aren’t like people who have succeeded in your culture or process” once they’ve been told what that means.
The most obvious consequence of using this model, for the companies that use it, is that they’ll get more and more people just like the people they already have. And that’s surprisingly unnoticeable for people in such companies.
My conclusion is that these algorithms don’t make things objective, they makes things opaque. And they embeds our old cultural problems in new mathematical models, giving us a false badge of objectivity.


