Archive
For the nerds: what’s wrong with this picture?
h/t Dave:

(Update! Rachel Schutt blogged about this same sign on October 2nd! Great nerd minds think alike :))
Also from the subway:

As my 10-year-old son says, the green guys actually look more endangered since
- their heads are disconnected from their bodies, and
- they are balancing precariously on single rounded stub legs.
Strata: one down, one to go
Yesterday I gave a talk called “Finance vs. Machine Learning” at Strata. It was meant to be a smack-down, but for whatever reason I couldn’t engage people to personify the two disciplines and have a wrestling match on stage. For the record, I offered to be on either side. Either they were afraid to hurt a girl or they were afraid to lose to a girl, you decide.
Unfortunately I didn’t actually get to the main motivation for the genesis of this talk, namely the realization I had a while ago that when machine learners talk about “ridge regression” or “Tikhonov regularization” or even “L2 regularization” it comes down to the same thing that quants call a very simple bayesian prior that your coefficients shouldn’t be too large. I talked about this here.
What I did have time for: I talked about “causal modeling” in the finance-y sense (discussion of finance vs. statistician definition of causal here), exponential downweighting with a well-chosen decay, storytelling as part of feature selection, and always choosing to visualize everything, and always visualizing the evolution of a statistic rather than a snapshot statistic.
They videotaped me but I don’t see it on the strata website yet. I’ll update if that happens.
This morning, at 9:35, I’ll be in a keynote discussion with Julie Steele for 10 minutes entitled “You Can’t Learn That in School”, which will be live streamed. It’s about whether data science can and should be taught in academia.
For those of you wondering why I haven’t blogged the Columbia Data Science class like I usually do Thursday, these talks are why. I’ll get to it soon, I promise! Last night’s talks by Mark Hansen, data vizzer extraordinaire and Ian Wong, Inference Scientist from Square, were really awesome.
How to measure a tree
Yesterday I went to a DataKind datadive as part of the Strata big data conference. As you might remember, I was a data ambassador a few weeks ago when we looked at pruning data, and they decided to take another look at this with better and cleaner data yesterday.
One of the people I met there was Mark Headd, the data czar/king/sultan of Philadelphia (actually, he called himself something like the “data guy” but I couldn’t resist embellishing his title on the spot). He blogs at civic.io, which is a pretty sweet url.
Mark showed me a nice app called Philly Tree Map, which is an open-source app gives information like the location, species, size, and environmental impact of each tree in Philly; it also allows users to update information or add new trees, which is fun and makes it more interactive.

They’re also using it in San Diego, and I don’t see why they can’t use it in New York as well, since I believe Parks has the tree census data.
I always love it when people get really into something (as described in my coffee douche post here), so I wanted to share with you guys the absolute tree-douchiest video ever filmed, namely the hilarious cult classic “How to Measure a Tree“, available on the FAQ page of the Philly tree map:
We’re not just predicting the future, we’re causing the future
My friend Rachel Schutt, a statistician at Google who is teaching the Columbia Data Science course this semester that I’ve been blogging every Thursday morning, recently wrote a blog post about 10 important issues in data science, and one of them is the title of my post today.
This idea that our predictive models cause the future is part of the modeling feedback loop I blogged about here; it’s the idea that, once we’ve chosen a model, especially as it models human behavior (which includes the financial markets), then people immediately start gaming the model in one way or another, both weakening the effect that the model is predicting as well as distorting the system itself. This is important and often overlooked when people build models.
How do we get people to think about these things more carefully? I think it would help to have a checklist of properties of a model using best practices.
I got this idea recently as I’ve been writing a talk about how math is used outside academia (which you guys have helped me on). In it, I’m giving a bunch of examples of models with a few basic properties of well-designed models.
It was interesting just composing that checklist, and I’ll likely blog about this in the next few days, but needless to say one thing on the checklist was “evaluation method”.
Obvious point: if you have a model which has no well-defined evaluation model then you’re fucked. In fact, I’d argue, you don’t really even have a model until you’ve chosen and defended your evaluation method (I’m talking to you, value-added teacher modelers).
But what I now realize is that part of the evaluation method of the model should consist of an analysis of how the model can or will be gamed and how that gaming can or will distort the ambient system. It’s a meta-evaluation of the model, if you will.
Example: as soon as regulators agree to measure a firm’s risk with 95% VaR on a 0.97 decay factor, there’s all sorts of ways for companies to hide risk. That’s why the parameters (95, 0.97) cannot be fixed if we want a reasonable assessment of risk.
This is obvious to most people upon reflection, but it’s not systemically studied, because it’s not required as part of an evaluation method for VaR. Indeed a reasonable evaluation method for VaR is to ask whether the 95% loss is indeed breached only 5% of the time, but that clearly doesn’t tell the whole story.
One easy way to get around this is to require a whole range of parameters for % VaR as well as a whole range of decay factors. It’s not that much more work and it is much harder to game. In other words, it’s a robustness measurement for the model.
Are healthcare costs really skyrocketing?
Yesterday we had a one-year anniversary meeting of the Alternative Banking group of Occupy Wall Street. Along with it we had excellent discussions of social security, Medicare, and ISDA, including details descriptions of how ISDA changes the rules to suit themselves and the CDS market, acting as a kind of independent system of law, which in particular means it’s not accountable to other rules of law.
Going back to our discussion on Medicare, I have a few comments and a questions for my dear readers:
I’ve been told by someone who should know that the projected “skyrocketing medical costs” which we hear so much about from politicians are based on a “cost per day in the hospital” number, i.e. as that index goes up, we assume medical costs will go up in tandem.
There’s a very good reason to consider this a biased proxy for medical costs, however. Namely, lots of things that used to be in-patient procedures (think gallbladder operations, which used to require a huge operation and many days of ICU care) are now out-patient procedures, so they don’t require a full day in the hospital.
This is increasingly true for various procedures – what used to take many days in the hospital recovering now takes fewer (or they kick you out sooner anyway). The result is that, on average, you only get to stay a whole day in the hospital if something’s majorly wrong with you, so yes the costs there are much higher. Thus the biased proxy.
A better index of cost would be: the cost of the average person’s medical expenses per year.
First question: Is this indeed how people calculate projected medical costs? It’s surprisingly hard to find a reference. That’s a bad sign. I’d really love a reference.
Next, I have a separate pet theory on why we are so willing to believe whatever we’re told about medical costs.
I’ve been planning for months to write a venty post about medical bills and HMO insurance paper mix-ups (update: wait, I did in fact write this post already). Specifically, it’s my opinion that the system is intentionally complicated so that people will end up paying stuff they shouldn’t just because they can’t figure out who to appeal to.
Note that even the idea of appealing to authority for a medical bill presumes that you’ve had a good education and experience dealing with formality. As a former customer service representative at a financial risk software company, I’m definitely qualified, but I can’t believe that the average person in this country isn’t overwhelmed by the prospect. It’s outrageous.
Part of this fear and anxiety stems from the fact that the numbers on the insurance claims are so inflated – $1200 to be seen for a dislocated finger being put into a splint, things like that. Why does that happen? I’m not sure, but I believe those are fake numbers that nobody actually pays, or at least nobody with insurance.
Second question: Why are the numbers on insurance claims so inflated? Who pays those actual numbers?
On to my theory: by extension of the above byzantine system of insurance claims and inflated prices for everything, we’re essentially primed for the line coming from politicians, who themselves (of course) lean on experts who “have studied this,” that health care costs are skyrocketing and that we can’t possibly allow “entitlements” to continue to grow the way they have been. A couple of comments:
- As was pointed out here (hat tip Deb), the fact that the numbers are already inflated so much, especially in comparison to other countries, should mean that they will tend to go down in the future, not up, as people travel away from our country to pay less. This is of course already happening.
- Even so, psychologically, we are ready for those numbers to say anything at all. $120,000 for a splint? Ok, sounds good, I hope I’m covered.
- Next, it’s certainly true that with technological advances come expensive techniques, especially for end-of-life and neonatal procedures. But on the other hand technology is also making normal, mid-life procedures (gallbladders removal) much cheaper.
- I would love to see a few histograms on this data, based on age of patient or prevalence of problem.
- I’d guess such histograms would show us the following: the overall costs structure is becoming much more fat-tailed, as the uncommon but expensive procedures are being used, but the mean costs could easily be going down, or could be projected to go down once more doctors and hospitals have invested in these technologies. Of course I have no idea if this is true.
Third question: Anyone know where such data can be found so I can draw me some histograms?
Final notes:
- The baby boomers are a large group, and they’re retiring and getting sick. But they’re not 10 times bigger than other generations, and the “exponential growth” we’ve been hearing about doesn’t get explained by this alone.
- Assume for a moment that medical costs are rising but not skyrocketing, which is my guess. Why would people (read: politicians) be so eager to exaggerate this?
Amazon’s binder reviews
If you go to amazon.com and search for “binder” or “3-ring binder” (h/t Dan), the very first hit will take you to the sale page for Avery’s Economy Binder with 1-Inch Round Ring, Black, 1 Binder (3301). The reviews are hilarious and subversive, including this one entitled “A Legitimate Binder”:
I am so excited to order this binder! My husband said that I’ve been doing such a great job of cutting out of work early to serve him meat and potatoes all these years, and he’s finally letting me upgrade from a 2-ring without pockets to a binder with 3 rings and two pockets! The pockets excite me the most. I plan to use the left pocket to hold my resume which will highlight my strongest skills which include but are not limited to laughing while eating yogurt. The right pocket will be great for keeping my stash of aspirin, in case of emergencies when I need to hold it between my knees.
Here’s another, entitled “Doesn’t work as advertised“:
Could’t bind a single damn woman with it! Most women just seem vaguely annoyed when I put it on them and it falls right off. Am I missing something? How’d Mitt do it?
Or this one, called “Such a bargain!“:
I am definitely buying this binder full of women, because even though it works the same as other male binders, you only have to pay $.77 on the dollar for it!
But my favorite one is this (called “Great with Bic lady pens”), partly because it points me to another subversive Amazon-rated product:
I’ve been having a hard time finding a job recently, and realized it was because I wasn’t in a binder. I thought the Avery Economy Binder would be perfect. It needs some tweaks, though. It kicks me out at 5pm so I can cook dinner for a family I don’t have. I also don’t seem to be making as much as the binderless men. And sometimes the rings will snag the lady parts, so maybe mine is defective.
By the way, the BIC pens for Her are a great complement to this binder. I wondered why the normal pens just didn’t feel right. It turns out, I was using man pens. The pink and purple also affirms me as a woman. You can find them here.
I know it says “for her” on the package but I, like many, assumed it was just a marketing ploy seeking to profit off of archaic gender constructs and the “war of the sexes”. Little did I realize that these pens really are for girls, and ONLY girls. Non-girls risk SERIOUS side effects should they use this product. I lent one to my 13-year-old brother, not thinking anything of it, and woke up the next morning to the sound of whinnying coming from the room across the hall. I got out of bed and went to his room to find that my worst fears had been realized:
MY LITTLE BROTHER IS NOW A UNICORN and it’s all my fault. Sure, you’d think that having a unicorn for a little brother would be great but my parents are FURIOUS – I’ve been grounded for a MONTH!!! They made an appointment for him with our family practitioner, but I’m not sure it’ll do any good, and they told me that if it couldn’t be fixed I’d have to get a job to help pay for his feed and lodging D:I repeat, boys, DO NOT USE THIS PEN. Unless you want to be a unicorn, and even then be careful because there’s no telling that you’ll suffer the same side effects.SERIOUSLY BIC IT’S REALLY REALLY IRRESPONSIBLE FOR YOU TO PUT OUT THIS PRODUCT WITHOUT A CLEAR WARNING OF THE RISK IT POSES TO NON-GIRLS. Just saying it’s “For Her” is not enough!!!!
(I’m giving it two stars because even though they got me grounded, the pens still write really nice and bring out my eyes)
Birdwatching
Today I’m posting my friend Becky’s poem about wasting time on a hobby you love. I spent the day at a yarn festival admiring hand-spun, dyed, and knit sweaters that cost about 5 times as much money and infinitely more time than the machine-made ones you can buy in any clothing store. I believe there’s no economic theory that could possibly explain why thousands of other people were just as excited as I was to be there.
——
What pastime could be less economically productive?
Owl swivels her tufted attention,
fixing her severity
on a silent stirring
in the fraying field
a mute meditation
just beyond
my upturned incomprehension.
What activity could be of less social value?
Hawk tears into hare
with his Swiss Army face,
unblinkingly slices
the limp sinew of snow,
a leap of fur
a moment before.
What hobby could be of less measurable benefit?
Egret unfolds her fistful of light,
lifts her improbable wings,
no metaphor for an angel
but the real deal –
You can see for yourself
how Spirit fancies feathers.
What avocation could be a more fervent waste of time?
Only Prayer –
Hummingbird’s eggs are a pair of pearl earrings
nestled in a pocket of lichen and silk –
and Love,
Loon’s lone lament.
What’s a fair price?
My readers may be interested to know that I am currently composing an acceptance letter to be on the board of Goldman Sachs.
Not that they’ve offered it, but Felix Salmon was kind enough to suggest me for the job yesterday and I feel like I should get a head start. Please give me suggestions for key phrases: how I’d do things differently or not, why I would be a breath of fresh air, how it’s been long enough having the hens guard the fox house, etc., that kind of thing.
But for now, I’d like to bring up the quasi-modeling, quasi-ethical topic (my favorite!) of setting a price. My friend Eugene sent me this nice piece he read yesterday on recommendation engines describing the algorithms used by Netflix and Amazon among others, which is strangely similar to my post yesterday coming out of Matt Gattis’s experience working at hunch. It was written by Computer Science professors Joseph A. Konstan and John Riedl from the University of Minnesota, and it does a nice job of describing the field, although there isn’t as much explicit math and formulae.
One thing they brought up in their article is the idea of a business charging certain people more money for items they expect them to buy based on their purchase history. So, if Fresh Direct did this to me, I’d have to pay more every week for Amish Country Farms 1% milk, since we go through about 8 cartons a week around here. They could basically charge me anything they want for that stuff, my 4-year-old is made of 95% milk and 5% nutella.

Except, no, they couldn’t do that. I’d just shop somewhere else for it, somewhere nobody knew my history. It would be a pain to go back to the grocery store but I’d do it anyway, because I’d feel cheated by that system. I’d feel unfairly singled out. For me it would be an ethical decision, and I’d vocally and publicly try to shame the company that did that to me.
It reminds me of arguments I used to have at D.E. Shaw with some of my friends and co-workers who were self-described libertarians. I don’t even remember how they’d start, but they’d end with my libertarian friend positing that rich people should be charged more for the same item. I have some sympathy with some libertarian viewpoints but this isn’t one of them.
First of all, I’d argue, people don’t walk around with a sign on their face saying how much money they have in the bank (of course this is become less and less true as information is collected online). Second of all, even if Warren Buffett himself walked into a hamburger joint, there’s no way they’re going to charge him $1000 for a burger. Not because he can’t afford it, and not even because he could go somewhere else for a cheaper burger (although he could), but because it’s not considered fair.
In some sense rich people do pay more for things, of course. They spend more money on clothes and food than poor people. But on the other hand, they’re also getting different clothes and different food. And even if they spend more money on the exact same item, a pound of butter, say, they’re paying rent for the nicer environment where they shop in their pricey neighborhood.
Now that I write this, I realize I don’t completely believe it. There are exceptions when it is considered totally fair to charge rich people more. My example is that I visited Accra, Ghana, and the taxi drivers consistently quoted me prices that were 2 or 3 times the price of the native Ghanaians, and neither of us thought it was unfair for them to do so. When my friend Jake was with me he’d argue them down to a number which was probably more like 1.5 times the usual price, out of principle, but when I was alone I didn’t do this, possibly because I was only there for 2 weeks. In this case, being a white person in Accra, I basically did have a sign on my face saying I had more money and could afford to spend more.
One last thought on price gouging: it happens all the time, I’m not saying it doesn’t, I am just trying to say it’s an ethical issue. If we are feeling price gouged, we are upset about it. If we see someone else get price gouged, we typically want to expose it as unfair, even if it’s happening to someone who can afford it.
Columbia Data Science course, week 7: Hunch.com, recommendation engines, SVD, alternating least squares, convexity, filter bubbles
Last night in Rachel Schutt’s Columbia Data Science course we had Matt Gattis come and talk to us about recommendation engines. Matt graduated from MIT in CS, worked at SiteAdvisor, and co-founded hunch as its CTO, which recently got acquired by eBay. Here’s what Matt had to say about his company:
Hunch
Hunch is a website that gives you recommendations of any kind. When we started out it worked like this: we’d ask you a bunch of questions (people seem to love answering questions), and then you could ask the engine questions like, what cell phone should I buy? or, where should I go on a trip? and it would give you advice. We use machine learning to learn and to give you better and better advice.
Later we expanded into more of an API where we crawled the web for data rather than asking people direct questions. We can also be used by third party to personalize content for a given site, a nice business proposition which led eBay to acquire us. My role there was doing the R&D for the underlying recommendation engine.
Matt has been building code since he was a kid, so he considers software engineering to be his strong suit. Hunch is a cross-domain experience so he doesn’t consider himself a domain expert in any focused way, except for recommendation systems themselves.
The best quote Matt gave us yesterday was this: “Forming a data team is kind of like planning a heist.” He meant that you need people with all sorts of skills, and that one person probably can’t do everything by herself. Think Ocean’s Eleven but sexier.
A real-world recommendation engine
You have users, and you have items to recommend. Each user and each item has a node to represent it. Generally users like certain items. We represent this as a bipartite graph. The edges are “preferences”. They could have weights: they could be positive, negative, or on a continuous scale (or discontinuous but many-valued like a star system). The implications of this choice can be heavy but we won’t get too into them today.

So you have all this training data in the form of preferences. Now you wanna predict other preferences. You can also have metadata on users (i.e. know they are male or female, etc.) or on items (a product for women).
For example, imagine users came to your website. You may know each user’s gender, age, whether they’re liberal or conservative, and their preferences for up to 3 items.
We represent a given user as a vector of features, sometimes including only their meta data, sometimes including only their preferences (which would lead to a sparse vector since you don’t know all their opinions) and sometimes including both, depending on what you’re doing with the vector.
Nearest Neighbor Algorithm?
Let’s review nearest neighbor algorithm (discussed here): if we want to predict whether a user A likes something, we just look at the user B closest to user A who has an opinion and we assume A’s opinion is the same as B’s.
To implement this you need a definition of a metric so you can measure distance. One example: Jaccard distance, i.e. the number of things preferences they have in common divided by the total number of things. Other examples: cosine similarity or euclidean distance. Note: you might get a different answer depending on which metric you choose.
What are some problems using nearest neighbors?
- There are too many dimensions, so the closest neighbors are too far away from each other. There are tons of features, moreover, that are highly correlated with each other. For example, you might imagine that as you get older you become more conservative. But then counting both age and politics would mean you’re double counting a single feature in some sense. This would lead to bad performance, because you’re using redundant information. So we need to build in an understanding of the correlation and project onto smaller dimensional space.
- Some features are more informative than others. Weighting features may therefore be helpful: maybe your age has nothing to do with your preference for item 1. Again you’d probably use something like covariances to choose your weights.
- If your vector (or matrix, if you put together the vectors) is too sparse, or you have lots of missing data, then most things are unknown and the Jaccard distance means nothing because there’s no overlap.
- There’s measurement (reporting) error: people may lie.
- There’s a calculation cost – computational complexity.
- Euclidean distance also has a scaling problem: age differences outweigh other differences if they’re reported as 0 (for don’t like) or 1 (for like). Essentially this means that raw euclidean distance doesn’t explicitly optimize.
- Also, old and young people might think one thing but middle-aged people something else. We seem to be assuming a linear relationship but it may not exist
- User preferences may also change over time, which falls outside the model. For example, at Ebay, they might be buying a printer, which makes them only want ink for a short time.
- Overfitting is also a problem. The one guy is closest, but it could be noise. How do you adjust for that? One idea is to use k-nearest neighbor, with say k=5.
- It’s also expensive to update the model as you add more data.
Matt says the biggest issues are overfitting and the “too many dimensions” problem. He’ll explain how he deals with them.
Going beyond nearest neighbor: machine learning/classification
In its most basic form, we’ve can model separately for each item using a linear regression. Denote by 


Remember, this model only works for one item. We need to build as many models as we have items. We know how to solve the above per item by linear algebra. Indeed one of the drawbacks is that we’re not using other items’ information at all to create the model for a given item.
This solves the “weighting of the features” problem we discussed above, but overfitting is still a problem, and it comes in the form of having huge coefficients when we don’t have enough data (i.e. not enough opinions on given items). We have a bayesian prior that these weights shouldn’t be too far out of whack, and we can implement this by adding a penalty term for really large coefficients.
This ends up being equivalent to adding a prior matrix to the covariance matrix. how do you choose lambda? Experimentally: use some data as your training set, evaluate how well you did using particular values of lambda, and adjust.
Important technical note: You can’t use this penalty term for large coefficients and assume the “weighting of the features” problem is still solved, because in fact you’re implicitly penalizing some coefficients more than others. The easiest way to get around this is to normalize your variables before entering them into the model, similar to how we did it in this earlier class.
The dimensionality problem
We still need to deal with this very large problem. We typically use both Principal Component Analysis (PCA) and Singular Value Decomposition (SVD).
To understand how this works, let’s talk about how we reduce dimensions and create “latent features” internally every day. For example, we invent concepts like “coolness” – but I can’t directly measure how cool someone is, like I could weigh them or something. Different people exhibit pattern of behavior which we internally label to our one dimension of “coolness”.
We let the machines do the work of figuring out what the important “latent features” are. We expect them to explain the variance in the answers to the various questions. The goal is to build a model which has a representation in a lower dimensional subspace which gathers “taste information” to generate recommendations.
SVD
Given a matrix 

Here 


The rows of 

Important properties:
- The columns of
- So we can order the columns by singular values.
- We can take lower rank approximation of X by throwing away part of
In this way we might have
- There is an important interpretation to the values in the matrices
For example, we can see, by using SVD, that “the most important latent feature” is often something like seeing if you’re a man or a woman.
[Question: did you use domain expertise to choose questions at Hunch? Answer: we tried to make them as fun as possible. Then, of course, we saw things needing to be asked which would be extremely informative, so we added those. In fact we found that we could ask merely 20 questions and then predict the rest of them with 80% accuracy. They were questions that you might imagine and some that surprised us, like competitive people v. uncompetitive people, introverted v. extroverted, thinking v. perceiving, etc., not unlike MBTI.]
More details on our encoding:
- Most of the time the questions are binary (yes/no).
- We create a separate variable for every variable.
- Comparison questions may be better at granular understanding, and get to revealed preferences, but we don’t use them.
Note if we have a rank 


Note that the problem of sparsity or missing data is not fixed by the above SVD approach, nor is the computational complexity problem; SVD is expensive.
PCA
Now we’re still looking for 
Let me explain. We denote by 


Then the dot product 


So, we want to find the best choices of
Now we have a parameter, namely the number 
How do we choose 
But how do we actually find

Alternating Least Squares
This optimization doesn’t have a nice closed formula like ordinary least squares with one set of coefficients. Instead, we use an iterative algorithm like with gradient descent. As long as your problem is convex you’ll converge ok (i.e. you won’t find yourself at a local but not global maximum), and we will force our problem to be convex using regularization.
Algorithm:
- Pick a random
- Optimize
- Optimize
- Keep doing the above two steps until you’re not changing very much at all.
Example: Fix

The way we do this optimization is user by user. So for user

where
But wait a minute, this is the same as linear least squares, and has a closed form solution! In other words, set:

where 


When you fix U and optimize V, it’s analogous; you only ever have to consider the users that rated that movie, which may be pretty large, but you’re only ever inverting a 
Another cool thing: since each user is only dependent on their item’s preferences, we can parallelize this update of
There are lots of different versions of this. Sometimes you need to extend it to make it work in your particular case.
Note: as stated this is not actually convex, but similar to the regularization we did for least squares, we can add a penalty for large entries in 

You can add new users, new data, keep optimizing U and V. You can choose which users you think need more updating. Or if they have enough ratings, you can decide not to update the rest of them.
As with any machine learning model, you should perform cross-validation for this model – leave out a bit and see how you did. This is a way of testing overfitting problems.
Thought experiment – filter bubbles
What are the implications of using error minimization to predict preferences? How does presentation of recommendations affect the feedback collected?
For example, can we end up in local maxima with rich-get-richer effects? In other words, does showing certain items at the beginning “give them an unfair advantage” over other things? And so do certain things just get popular or not based on luck?
How do we correct for this?
Growing old: better than the alternatives
I enjoyed this article in the Wall Street Journal recently entitled “The ‘New’ Old Age is No Way to Live”. In it the author rejects the idea of following his Baby Boomer brethren in continuing to exercise daily, being hugely productive, and just generally being in denial of their age. From the article:
We are advised that an extended life span has given us an unprecedented opportunity. And if we surrender to old age, we are fools or, worse, cowards. Around me I see many of my contemporaries remaining in their prime-of-life vocations, often working harder than ever before, even if they have already achieved a great deal. Some are writing the novels stewing in their heads but never attempted, or enrolling in classes in conversational French, or taking up jogging, or even signing up for cosmetic surgery and youth-enhancing hormone treatments.
The rest of the article is devoted to describing his trip to the Greek island of Hydra to research how to grow old. There are lots of philosophical references as well as counter-intuitive defenses of being set in your ways and how striving is empty-headed. Whatever, it’s his column. Personally, I like changing my mind about things and striving.
The point I want to make is this: there are far too few people coming out and saying that getting old can be a good thing. It can be a fun thing. Our culture is so afraid of getting old, it’s almost as bad as being fat on the list of no-nos.
I don’t get it. Why? Why can’t we be proud of growing old? It allows us, at the very least, to hold forth more, which is my favorite thing to do.
Since I turned 40 I’ve stopped dying my hair, which is going white, and I’ve taken to calling the people around me “honey”, “sugar”, or “baby”. I feel like I can get away with that now, which is fun. Honestly I’m looking forward to the stuff I can say and do when I’m 70, because I’m planning to be one of those outrageous old women full of spice and opinions. I’m going to make big turkey dinners with all the fixings even when it’s just October and invite my neighbors and friends to come over if my kids are too busy with their lives and family. But if they decide to visit, and if they have kids themselves, I’m going to spoil my grandkids rotten, because I’m totally allowed to do that when I’m the grandma.
Instead of lying about my age down, I’ve taken to lying about my age up. I feel like I am getting away with something if I can pass for 50. After all, why would I still want to be 30? I was close to miserable back then, and I’ve learned a ton in the past 10 years.
Update: my friend Cosma just sent me this poem by Jenny Joseph. For the record I’m wearing purple today:
Warning
When I am an old woman I shall wear purple
With a red hat which doesn’t go, and doesn’t suit me.
And I shall spend my pension on brandy and summer gloves
And satin sandals, and say we’ve no money for butter.
I shall sit down on the pavement when I’m tired
And gobble up samples in shops and press alarm bells
And run my stick along the public railings
And make up for the sobriety of my youth.
I shall go out in my slippers in the rain
And pick flowers in other people’s gardens
And learn to spit.
You can wear terrible shirts and grow more fat
And eat three pounds of sausages at a go
Or only bread and pickle for a week
And hoard pens and pencils and beermats and things in boxes.
But now we must have clothes that keep us dry
And pay our rent and not swear in the street
And set a good example for the children.
We must have friends to dinner and read the papers.
But maybe I ought to practice a little now?
So people who know me are not too shocked and surprised
When suddenly I am old, and start to wear purple.
Causal versus causal
Today I want to talk about the different ways the word “causal” is thrown around by statisticians versus finance quants, because it’s both confusing and really interesting.
But before I do, can I just take a moment to be amazed at how pervasive Gangnam Style has become? When I first posted the video on August 1st, I had no idea how much of a sensation it was destined to become. Here’s the Google trend graph for “Gangnam” versus “Obama”:

It really hit home last night as I was reading a serious Bloomberg article take on the economic implications of Gangnam Style whilst the song was playing in the background at the playoff game between the Cardinals and the Giants.
Back to our regularly scheduled program. I’m first going to talk about how finance quants think about “causal models” and second how statisticians do. This has come out of conversations with Suresh Naidu and Rachel Schutt.
Causal modeling in finance
When I learned how to model causally, it basically meant something very simple: I never used “future information” to make a prediction about the future. I was strictly using information from the past, or that was available and I had access to, to make predictions about the future. In other words, as I trained a model, I always had in mind a timestamp explaining what the “present time” is, and all data I had access to at that moment had timestamps of availability for before that present time so that I could use this information to make a statement about what I think would happen after that present time. If I did this carefully, then my model was termed “causal.” It respected time, and in particular it didn’t have great-looking predictive power just because it was peeking ahead.
Causal modeling in statistics
By contrast, when statisticians talk about a causal model, they mean something very different. Namely, they mean whether the model shows that something caused something else to happen. For example, if we saw certain plants in a certain soil all died but those in a different soil lived, then they’d want to know if the soil caused the death of the plants. Usually to answer this kind of questions, in an ideal situation, statisticians set up randomly chosen experiments where the only difference between the treatments is that one condition (i.e. the type of soil, but not how often you water it or the type of sunlight it gets). When they can’t set it up perfectly (say because it involves people dying instead of plants) they do the best they can.
The differences and commonalities
On the one hand both concepts refer and depend on time. There’s no way X caused Y to happen if X happened after Y. But whereas in finance we only care about time, in statistics there’s more to it.
So for example, if there’s a third underlying thing that causes both X and Y, but X happens before Y, then the finance people are psyched because they have a way of betting on the direction of Y: just keep an eye on X! But the statisticians are not amused, since there’s no way to prove causality in this case unless you get your hands on that third thing.
Although I understand wanting to know the underlying reasons things happen, I have a personal preference for the finance definition, which is just plain easier to understand and test, and usually the best we can do with real world data. In my experience the most interesting questions relate to things that you can’t set up experiments for. So, for example, it’s hard to know whether blue-collar presidents would be impose less elitist policy than millionaires, because we only have millionaires.
Moreover, it usually is interesting to know what you can predict for the future knowing what you know now, even if there’s no proof of causation, and not only because you can maybe make money betting on something (but that’s part of it).
Gaming the Google mail filter and the modeling feedback loop
The gmail filter
If you’re like me, a large part of your life takes place in your gmail account. My gmail address is the only one I use, and I am extremely vigilant about reading emails – probably too much so.
On the flip side, I spend quite a bit of energy removing crap from my gmail. When I have the time and opportunity, and if I receive an unwanted email, I will set a gmail filter instead of just deleting. This is usually in response to mailing lists I get on by buying something online, so it’s not quite spam. For obvious spam I just click on the spam icon and it disappears.
You see, when I check out online to pay for my stuff, I am not incredibly careful about making sure I’m not signing up to be on a mailing list. I just figure I’ll filter anything I don’t want later.
Which brings me to the point. I’ve noticed lately that, more and more often, the filter doesn’t work, at least on the automatic setting. If you open an email you don’t want, you can click on “filter messages like these” and it will automatically fill out a filter form with the “from” email address that is listed.

More and more often, these quasi-spammers are getting around this somehow. I don’t know how they do it, because it’s not as simple as changing their “from” address every time, which would work pretty well. Somehow not even the email I’ve chosen to filter is actually deleted through this process.
I end up having to copy and paste the name of the product into a filter, but this isn’t a perfect solution either, since then if my friend emails me about this product I will automatically delete that genuine email.
The modeling feedback loop
This is a perfect example of the feedback loop of modeling; first there was a model which automatically filled out a filter form, then people in charge of sending out mailing lists for products realized they were being successfully filtered and figured out how to game the model. Now the model doesn’t work anymore.
The worst part of the gaming strategy is how well it works. If everybody uses the filter model, and you are the only person who games it, then you have a tremendous advantage over other marketers. So the incentive for gaming is very high.
Note this feedback loop doesn’t always exist: the stars and planets didn’t move differently just because Newton figured out his laws, and people don’t start writing with poorer penmanship just because we have machine learning algorithms that read envelopes at the post office.
But this feedback loop does seem to be associated with especially destructive models (think rating agency models for MBS’s and CDO’s). In particular, any model which is “gamed” to someone’s advantage probably exhibits something like this. It will work until the modelers strike back with a better model, in an escalation not unlike an arms race (note to ratings agency modelers: unless you choose to not make the model better even when people are clearly gaming it).
As far as I know, there’s nothing we can do about this feedback loop except to be keenly aware of it and be ready for war.
The investigative mathematical journalist
I’ve been out of academic math a few years now, but I still really enjoy talking to mathematicians. They are generally nice and nerdy and utterly earnest about their field and the questions in their field and why they’re interesting.
In fact, I enjoy these conversations more now than when I was an academic mathematician myself. Partly this is because, as a professional, I was embarrassed to ask people stupid questions, because I thought I should already know the answers. I wouldn’t have asked someone to explain motives and the Hodge Conjecture in simple language because honestly, I’m pretty sure I’d gone to about 4 lectures as a graduate student explaining all of this and if I could just remember the answer I would feel smarter.
But nowadays, having left and nearly forgotten that kind of exquisite anxiety that comes out of trying to appear superhuman, I have no problem at all asking someone to clarify something. And if they give me an answer that refers to yet more words I don’t know, I’ll ask them to either rephrase or explain those words.
In other words, I’m becoming something of an investigative mathematical journalist. And I really enjoy it. I think I could do this for a living, or at least as a large project.
What I have in mind is the following: I go around the country (I’ll start here in New York) and interview people about their field. I ask them to explain the “big questions” and what awesomeness would come from actually having answers. Why is their field interesting? How does it connect to other fields? What is the end goal? How would achieving it inform other fields?
Then I’d write them up like columns. So one column might be “Hodge Theory” and it would explain the main problem, the partial results, and the connections to other theories and fields, or another column might be “motives” and it would explain the underlying reason for inventing yet another technology and how it makes things easier to think about.
Obviously I could write a whole book on a given subject, but I wouldn’t. My audience would be, primarily, other mathematicians, but I’d write it to be readable by people who have degrees in other quantitative fields like physics or statistics.
Even more obviously, every time I chose a field and a representative to interview and every time I chose to stop there, I’d be making in some sense a political choice, which would inevitably piss someone off, because I realize people are very sensitive to this. This is presuming anybody every read my surveys in the first place, which is a big if.
Even so, I think it would be a contribution to mathematics. I actually think a pretty serious problem with academic math is that people from disparate fields really have no idea what each other is doing. I’m generalizing, of course, and colloquiums do tend to address this, when they are well done and available. But for the most part, let’s face it, people are essentially only rewarded for writing stuff that is incredibly “insider” for their field. that only a few other experts can understand. Survey of topics, when they’re written, are generally not considered “research” but more like a public service.
And by the way, this is really different from the history of mathematics, in that I have never really cared about who did what, and I still don’t (although I’m not against name a few people in my columns). The real goal here is to end up with a more or less accurate map of the active research areas in mathematics and how they are related. So an enormous network, with various directed edges of different types. In fact, writing this down makes me want to build my map as I go, an annotated visualization to pair with the columns.
Also, it obviously doesn’t have to be me doing all this: I’m happy to make it an open-source project with a few guidelines and version control. But I do want to kick it off because I think it’s a neat idea.
A few questions about my mathematical journalism plan.
- Who’s going to pay me to do this?
- Where should I publish it?
If the answers are “nobody” and “on mathbabe.org” then I’m afraid it won’t happen, at least by me. Any ideas?
One more thing. This idea could just as well be done for another field altogether, like physics or biology. Are there models of people doing something like that in those fields that you know about? Or is there someone actually already doing this in math?
Philanthropy can do better than Rajat Gupta
Last night I was watching a YouTube video in between playoff games (both of which disappointed). Conan O’Brien was accepting an honorary patronage at the philosophical society of the University of Dublin. His speech was hilarious, and there was an extended, intimate Q&A session afterwards.
One thing he mentioned was an amended version of the (to me, very moving) words he had closed his last NBC Tonight Show with, “If you work really hard and you’re kind then amazing things will happen.” Namely, he wanted to add this sentence: “If you work really hard and you’re a huge asshole, then you can make tons of money on Wall Street.”
These wise words came back to me this morning when I read about Bill Gates and Kofi Annan’s letters to Judge Jed Rakoff regarding Goldman Sachs insider trader Rajat Gupta. The letters were intended to reduce sentencing, considering how unbelievably philanthropical Gupta had been as he was stealing all this money.
I’m not doubting that the dude did some good things with his ill-gotten gains. After all, I don’t have a letter from Bill Gates about how I helped remove malaria from the world.
But wait a minute, maybe that’s because I didn’t steal money from taxpayers like he did to put myself into the position of spending millions of dollars doing good things! Because I’m thinking that if I had the money that Gupta had, I might well have spent good money doing good things.
And therein lies the problem with this whole picture. He did some good (I’ll assume), but then again he had the advantage of being someone in our society who could do good, i.e. he was loaded. Wouldn’t it make more sense for us to set up a system wherein people could do good who are good, who have good ideas and great plans?
Unfortunately, those people exist, but they’re generally poor, or stuck in normal jobs making ends meet for their family, and they don’t get their plans heard. In particular they aren’t huge assholes stealing money and then trying to get out of trouble by hiring hugely expensive lawyers and leaning on their philanthropy buds.
The current system of grant-writing doesn’t at all support the people with good ideas: it doesn’t teach these “social inventors” how to build a charitable idea into a business plan. So what happens is that the good ideas drift away without the important detailed knowledge of how to surround it with resources. And generally the people with really innovative ideas aren’t by nature detail-oriented people who can figure out how to start a business, they’re kind of nerdy.
I’m serious, I think the government should sponsor something like a “philanthropy institute” for entrepreneurial non-revenue generating ideas that are good for society. People could come to open meetings and discuss their ideas for improving stuff, and there’d be full-time staff and fellows, with the goal of seizing upon good ideas and developing them like business plans.
Personal privacy and institutional transparency
Ever noticed that it’s vulnerable individuals who are transparent about their data (i.e. public and open on Facebook and the like) whereas it’s for-profit institutions like pharmaceutical companies, charged with being stewards of public health, that get to be as down-low as they want?
Do you agree with me that that’s ass-backwards?
Well, there were two potentially good things mentioned in yesterday’s New York Times to ameliorate this mismatch. I say “potentially” because they are both very clearly susceptible to political spin-doctoring.
The first is that Big Pharma company GlaxoSmithKline has claimed they will be more transparent about their internal medical trials, even the ones that fail. This would be a huge step in the right direction if it really happens.
The second is that Senator John D. Rockefeller IV of West Virginia is spearheading an investigation into data brokers and the industry of information warehousing. A good step towards better legislation but this could just be a call for lobbyists money, so I’ll believe it when I see it.
What with the whole-genome DNA sequencing methods getting relatively cheap, modern privacy legislation is desperately needed so people won’t be afraid to use life-saving techniques for fear of losing their health insurance. Obama’s Presidential Commission for the Study of Bioethical Issues agrees with me.
Columbia Data Science course, week 6: Kaggle, crowd-sourcing, decision trees, random forests, social networks, and experimental design
Yesterday we had two guest lecturers, who took up approximately half the time each. First we welcomed William Cukierski from Kaggle, a data science competition platform.
Will went to Cornell for a B.A. in physics and to Rutgers to get his Ph.D. in biomedical engineering. He focused on cancer research, studying pathology images. While working on writing his dissertation, he got more and more involved in Kaggle competitions, finishing very near the top in multiple competitions, and now works for Kaggle. Here’s what Will had to say.
Crowd-sourcing in Kaggle
What is a data scientist? Some say it’s someone who is better at stats than an engineer and better at engineering than a statistician. But one could argue it’s actually someone who is worse at stats than a statistician. Being a data scientist is when you learn more and more about more and more until you know nothing about everything.
Kaggle using prizes to induce the public to do stuff. This is not a new idea:
- the Royal Navy in 1714 couldn’t measure longitude, and put out a prize worth $6 million in today’s dollars to get help. John Harrison, an unknown cabinetmaker, figured it out how to make a clock to solve the problem.
- In the U.S. in 2002 FOX issued a prize for the next pop solo artist, which resulted in American Idol.
- There’s also the X-prize company; $10 million was offered for the Ansari X-prize and $100 million was lost in trying to solve it. So it doesn’t always mean it’s an efficient process (but it’s efficient for the people offering the prize if it gets solved!)
There are two kinds of crowdsourcing models. First, we have the distributive crowdsourcing model, like wikipedia, which as for relatively easy but large amounts of contributions. Then, there’s the singular, focused difficult problems that Kaggle, DARPA, InnoCentive and other companies specialize in.
Somee of the problems with some crowdsourcing projects include:
- they don’t always evaluate your submission objectively. Instead they have a subjective measure, so they might just decide your design is bad or something. This leads to high barrier to entry, since people don’t trust the evaluation criterion.
- Also, one doesn’t get recognition until after they’ve won or ranked highly. This leads to high sunk costs for the participants.
- Also, bad competitions often conflate participants with mechanical turks: in other words, they assume you’re stupid. This doesn’t lead anywhere good.
- Also, the competitions sometimes don’t chunk the work into bite size pieces, which means it’s too big to do or too small to be interesting.
A good competition has a do-able, interesting question, with an evaluation metric which is transparent and entirely objective. The problem is given, the data set is given, and the metric of success is given. Moreover, prizes are established up front.
The participants are encouraged to submit their models up to twice a day during the competitions, which last on the order of a few days. This encourages a “leapfrogging” between competitors, where one ekes out a 5% advantage, giving others incentive to work harder. It also establishes a band of accuracy around a problem which you generally don’t have- in other words, given no other information, you don’t know if your 75% accurate model is the best possible.
The test set y’s are hidden, but the x’s are given, so you just use your model to get your predicted y’s for the test set and upload them into the Kaggle machine to see your evaluation score. This way you don’t share your actual code with Kaggle unless you win the prize (and Kaggle doesn’t have to worry about which version of python you’re running).
Note this leapfrogging effect is good and bad. It encourages people to squeeze out better performing models but it also tends to make models much more complicated as they get better. One reason you don’t want competitions lasting too long is that, after a while, the only way to inch up performance is to make things ridiculously complicated. For example, the original Netflix Prize lasted two years and the final winning model was too complicated for them to actually put into production.
The hole that Kaggle is filling is the following: there’s a mismatch between those who need analysis and those with skills. Even though companies desperately need analysis, they tend to hoard data; this is the biggest obstacle for success.
They have had good results so far. Allstate, with a good actuarial team, challenged their data science competitors to improve their actuarial model, which, given attributes of drivers, approximates the probability of a car crash. The 202 competitors improved Allstate’s internal model by 271%.
There were other examples, including one where the prize was $1,000 and it benefited the company $100,000.
A student then asked, is that fair? There are actually two questions embedded in that one. First, is it fair to the data scientists working at the companies that engage with Kaggle? Some of them might lose their job, for example. Second, is it fair to get people to basically work for free and ultimately benefit a for-profit company? Does it result in data scientists losing their fair market price?
Of course Kaggle charges a fee for hosting competitions, but is it enough?
[Mathbabe interjects her view: personally, I suspect this is a model which seems like an arbitrage opportunity for companies but only while the data scientists of the world haven’t realized their value and have extra time on their hands. As soon as they price their skills better they’ll stop working for free, unless it’s for a cause they actually believe in.]
Facebook is hiring data scientists, they hosted a Kaggle competition, where the prize was an interview. There were 422 competitors.
[Mathbabe can’t help but insert her view: it’s a bit too convenient for Facebook to have interviewees for data science positions in such a posture of gratitude for the mere interview. This distracts them from asking hard questions about what the data policies are and the underlying ethics of the company.]
There’s a final project for the class, namely an essay grading contest. The students will need to build it, train it, and test it, just like any other Kaggle competition. Group work is encouraged.
Thought Experiment: What are the ethical implications of a robo-grader?
Some of the students’ thoughts:
- It depends on how much you care about your grade.
- Actual human graders aren’t fair anyway.
- Is this the wrong question? The goal of a test is not to write a good essay but rather to do well in a standardized test. The real profit center for standardized testing is, after all, to sell books to tell you how to take the tests. It’s a screening, you follow the instructions, and you get a grade depending on how well you follow instructions.
- There are really two question: 1) Is it wise to move from the human to the machine version of same thing for any given thing? and 2) Are machines making things more structured, and is this inhibiting creativity? One thing is for sure, robo-grading prevents me from being compared to someone more creative.
- People want things to be standardized. It gives us a consistency that we like. People don’t want artistic cars, for example.
- Will: We used machine learning to research cancer, where the stakes are much higher. In fact this whole field of data science has to be thinking about these ethical considerations sooner or later, and I think it’s sooner. In the case of doctors, you could give the same doctor the same slide two months apart and get different diagnoses. We aren’t consistent ourselves, but we think we are. Let’s keep that in mind when we talk about the “fairness” of using machine learning algorithms in tricky situations.
Introduction to Feature Selection
“Feature extraction and selection are the most important but underrated step of machine learning. Better features are better than better algorithms.” – Will
“We don’t have better algorithms, we just have more data” –Peter Norvig
Will claims that Norvig really wanted to say we have better features.
We are getting bigger and bigger data sets, but that’s not always helpful. The danger is if the number of features is larger than the number of samples or if we have a sparsity problem.
We improve our feature selection process to try to improve performance of predictions. A criticism of feature selection is that it’s no better than data dredging. If we just take whatever answer we get that correlates with our target, that’s not good.
There’s a well known bias-variance tradeoff: a model is “high bias” if it’s is too simple (the features aren’t encoding enough information). In this case lots more data doesn’t improve your model. On the other hand, if your model is too complicated, then “high variance” leads to overfitting. In this case you want to reduce the number of features you are using.
We will take some material from a famous paper by Isabelle Guyon published in 2003 entitled “An Introduction to Variable and Feature Selection”.
There are three categories of feature selection methods: filters, wrappers, and embedded methods. Filters order variables (i.e. possible features) with respect to some ranking (e.g. correlation with target). This is sometimes good on a first pass over the space of features. Filters take account of the predictive power of individual features, and estimate mutual information or what have you. However, the problem with filters is that you get correlated features. In other words, the filter doesn’t care about redundancy.
This isn’t always bad and it isn’t always good. On the one hand, two redundant features can be more powerful when they are both used, and on the other hand something that appears useless alone could actually help when combined with another possibly useless-looking feature.
Wrapper feature selection tries to find subsets of features that will do the trick. However, as anyone who has studied the binomial coefficients knows, the number of possible size 
We don’t have to retrain models at each step of such an approach, because there are fancy ways to see how objective function changes as we change the subset of features we are trying out. These are called “finite differences” and rely essentially on Taylor Series expansions of the objective function.
One last word: if you have a domain expertise on hand, don’t go into the machine learning rabbit hole of feature selection unless you’ve tapped into your expert completely!
Decision Trees

We’ve all used decision trees. They’re easy to understand and easy to use. How do we construct? Choosing a feature to pick at each step is like playing 20 questions. We take whatever the most informative thing is first. For the sake of this discussion, assume we break compound questions into multiple binary questions, so the answer is “+” or “-“.
To quantify “what is the most informative feature”, we first define entropy for a random variable

Note when 

In particular, if either option has probability zero, the entropy is 0. It is maximized at 0.5 for binary variables:

which we can easily compute using the fact that in the binary case, 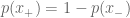
Using this definition, we define the information gain for a given feature, which is defined as the entropy we lose if we know the value of that feature.
To make a decision tree, then, we want to maximize information gain, and make a split on that. We keep going until all the points at the end are in the same class or we end up with no features left. In this case we take the majority vote. Optionally we prune the tree to avoid overfitting.
This is an example of an embedded feature selection algorithm. We don’t need to use a filter here because the “information gain” method is doing our feature selection for us.
How do you handle continuous variables?
In the case of continuous variables, you need to ask for the correct threshold of value so that it can be though of as a binary variable. So you could partition a user’s spend into “less than $5” and “at least $5” and you’d be getting back to the binary variable case. In this case it takes some extra work to decide on the information gain because it depends on the threshold as well as the feature.
Random Forests
Random forests are cool. They incorporate “bagging” (bootstrap aggregating) and trees to make stuff better. Plus they’re easy to use: you just need to specify the number of trees you want in your forest, as well as the number of features to randomly select at each node.
A bootstrap sample is a sample with replacement, which we usually take to be 80% of the actual data, but of course can be adjusted depending on how much data we have.
To construct a random forest, we construct a bunch of decision trees (we decide how many). For each tree, we take a bootstrap sample of our data, and for each node we randomly select (a second point of bootstrapping actually) a few features, say 5 out of the 100 total features. Then we use our entropy-information-gain engine to decide which among those features we will split our tree on, and we keep doing this, choosing a different set of five features for each node of our tree.
Note we could decide beforehand how deep the tree should get, but we typically don’t prune the trees, since a great feature of random forests is that it incorporates idiosyncratic noise.
Here’s what does a decision tree looks like for surviving on the Titanic.
David Huffaker, Google: Hybrid Approach to Social Research
David is one of Rachel’s collaborators in Google. They had a successful collaboration, starting with complementary skill sets, an explosion of goodness ensued when they were put together to work on Google+ with a bunch of other people, especially engineers. David brings a social scientist perspective to the analysis of social networks. He’s strong in quantitative methods for understanding and analyzing online social behavior. He got a Ph.D. in Media, Technology, and Society from Northwestern.
Google does a good job of putting people together. They blur the lines between research and development. The researchers are embedded on product teams. The work is iterative, and the engineers on the team strive to have near-production code from day 1 of a project. They leverage cloud infrastructure to deploy experiments to their mass user base and to rapidly deploy a prototype at scale.
Note that, considering the scale of Google’s user base, redesign as they scaling up is not a viable option. They instead do experiments with smaller groups of users.
David suggested that we, as data scientists, consider how to move into an experimental design so as to move to a causal claim between variables rather than a descriptive relationship. In other words, to move from the descriptive to the predictive.
As an example, he talked about the genesis of the “circle of friends” feature of Google+. They know people want to selectively share; they’ll send pictures to their family, whereas they’d probably be more likely to send inside jokes to their friends. They came up with the idea of circles, but it wasn’t clear if people would use them. How do they answer the question: will they use circles to organize their social network? It’s important to know what motivates them when they decide to share.
They took a mixed-method approach, so they used multiple methods to triangulate on findings and insights. Given a random sample of 100,000 users, they set out to determine the popular names and categories of names given to circles. They identified 168 active users who filled out surveys and they had longer interviews with 12.
They found that the majority were engaging in selective sharing, that most people used circles, and that the circle names were most often work-related or school-related, and that they had elements of a strong-link (“epic bros”) or a weak-link (“acquaintances from PTA”)
They asked the survey participants why they share content. The answers primarily came in three categories: first, the desire to share about oneself – personal experiences, opinions, etc. Second, discourse: people wanna participate in a conversation. Third, evangelism: people wanna spread information.
Next they asked participants why they choose their audiences. Again, three categories: first, privacy – many people were public or private by default. Second, relevance – they wanted to share only with those who may be interested, and they don’t wanna pollute other people’s data stream. Third, distribution – some people just want to maximize their potential audience.
The takeaway from this study was this: people do enjoy selectively sharing content, depending on context, and the audience. So we have to think about designing features for the product around content, context, and audience.
Network Analysis
We can use large data and look at connections between actors like a graph. For Google+, the users are the nodes and the edges (directed) are “in the same circle”.
Other examples of networks:
- nodes are users in 2nd life, interactions between users are possible in three different ways, corresponding to three different kinds of edges
- nodes are websites, edges are links
- nodes are theorems, directed edges are dependencies
After you define and draw a network, you can hopefully learn stuff by looking at it or analyzing it.
Social at Google
As you may have noticed, “social” is a layer across all of Google. Search now incorporates this layer: if you search for something you might see that your friend “+1″‘ed it. This is called a social annotation. It turns out that people care more about annotation when it comes from someone with domain expertise rather than someone you’re very close to. So you might care more about the opinion of a wine expert at work than the opinion of your mom when it comes to purchasing wine.
Note that sounds obvious but if you started the other way around, asking who you’d trust, you might start with your mom. In other words, “close ties,” even if you can determine those, are not the best feature to rank annotations. But that begs the question, what is? Typically in a situation like this we use click-through rate, or how long it takes to click.
In general we need to always keep in mind a quantitative metric of success. This defines success for us, so we have to be careful.
Privacy
Human facing technology has thorny issues of privacy which makes stuff hard. We took a survey of how people felt uneasy about content. We asked, how does it affect your engagement? What is the nature of your privacy concerns?
Turns out there’s a strong correlation between privacy concern and low engagement, which isn’t surprising. It’s also related to how well you understand what information is being shared, and the question of when you post something, where does it go and how much control do you have over it. When you are confronted with a huge pile of complicated all settings, you tend to start feeling passive.
Again, we took a survey and found broad categories of concern as follows:
identity theft
- financial loss
digital world
- access to personal data
- really private stuff I searched on
- unwanted spam
- provocative photo (oh shit my boss saw that)
- unwanted solicitation
- unwanted ad targeting
physical world
- offline threats
- harm to my family
- stalkers
- employment risks
- hassle
What is the best way to decrease concern and increase undemanding and control?
Possibilities:
- Write and post a manifesto of your data policy (tried that, nobody likes to read manifestos)
- Educate users on our policies a la the Netflix feature “because you liked this, we think you might like this”
- Get rid of all stored data after a year
Rephrase: how do we design setting to make it easier for people? how do you make it transparent?
- make a picture or graph of where data is going.
- give people a privacy switchboard
- give people access to quick settings
- make the settings you show them categorized by things you don’t have a choice about vs. things you do
- make reasonable default setting so people don’t have to worry about it.
David left us with these words of wisdom: as you move forward and have access to big data, you really should complement them with qualitative approaches. Use mixed methods to come to a better understanding of what’s going on. Qualitative surveys can really help.
Live and let live, motherfuckers
It’s high time I tell you guys about my favorite blog, Effing Dykes.
Why now? Well, I’ve wanted to write a post about body image like Effing Dykes’ The Body Electric ever since I started this blog (ever since I turned 10, actually). But I couldn’t get it right. Not in a million years could I have written something so beautiful or so right. So I’m really grateful she has written it. Please read and enjoy.
That url again: http://effingdykes.blogspot.com/2012/09/the-body-electric.html
Note: I’ve stolen the catchy phrase “live and let live, motherfuckers” (can you say “phrase of the week”?) from that post, as well as this picture, which reminds me of my wordpress profile pic as well as all of my friends from high school:
 p.s. I had a wardrobe crisis last week when I realized I only owned one ugly plaid flannel shirt, but luckily Old Navy has an ugly plaid flannel shirt sale going on.
Neil Barofsky on the Fed Stress Test
I recently started using Twitter, and I only follow 8 people, one of them being Neil Barofsky, author of Bailout, which I blogged about here (Twitter is a useful way to stalk your crushes, as Twitter users already know).
I’m glad I do follow him, because yesterday he tweeted (twatted?) about an article he wrote on LinkedIn which I never would have found otherwise. It’s called “Banks Rule While the Rest of us Drool,” and he gave credit to his daughter for that title, which is crushworthy in itself. It’s essentially a bloggy rant against a Wall Street Journal article which I had just read and was thinking of writing a ranty blog post against myself.
But now I don’t have to write it! I’ll just tell you about the WSJ article, quote from it a bit (and complain about it a bit since I can’t help myself), and then quote Barofsky’s awesome disgust with it. Here goes.
The Fed conducts stress tests on the banks, and they are making them secret, so the banks can’t game them, as well as requiring more frequent and better quality data. All good. From the WSJ article:
The Fed asks the big banks to submit reams of data and then publishes each bank’s potential loan losses and how much capital each institution would need to absorb them. Banks also submit plans of how they would deploy capital, including any plans to raise dividends or buy back stock.
After several institutions failed last year’s tests and had their capital plans denied, executives at many of the big banks began challenging the Fed to explain why there were such large gaps between their numbers and the Fed’s, according to people close to the banks.
Fed officials say they have worked hard to help bankers better understand the math, convening the Boston symposium and multiple conference calls. But they don’t want to hand over their models to the banks, in part because they don’t want the banks to game the numbers, officials say.
Just to be clear, when they say “large gaps”, I’m pretty sure the banks mean they are perfectly safe when the Fed thinks they’re undercapitalized. I am pretty sure the banks are arguing they should be giving huger bonuses to their C*O’s whereas the Fed thinks not. I’m just guessing on the direction, but I could be wrong, it’s not spelled out in the article.
Here’s another thing that drives me up the wall, from the WSJ article:
Banks say the Fed has asked them for too much, too fast. Some bankers, for instance, have complained the Fed now is demanding they include the physical address of properties backing loans on their books, not just the billing address for the borrower. Not all banks, it turns out, have that information readily available.
Daryl Bible, the chief risk officer at BB&T Corp., a Winston-Salem, N.C.-based bank with $179 billion in assets, challenged the Fed’s need for all of the data it is collecting, saying in a Sept. 4 comment letter to the regulator that “the reporting requirements appear to have advanced beyond the linkage of risk to capital and an organization’s viability,” burdening banks without adding any value to the stress test exercise. BB&T declined further comment.
Oh really? Can you, Daryl Bible, think of no reason at all we might want to know the addresses of the houses you gave bad mortgages to? Really? Do you really think you deserve to be a Chief Risk Officer of a firm with $179 billion in assets if your imagination of how to calculate risk is so puny?
But the most infuriating part of the article is at the end, and I’m going to let Neil take it away:
… at the end of the article the reporters reveal that the Fed recently “backed off” a requirement that the CFOs of the banks actually confirm that the numbers they are providing are accurate. The reason? The banks argued, and the Fed apparently agreed, that providing data about what’s going on in the banks is simply too “confusing for any CFO to be able to be sure his bank had gotten it right.” In other words, rather than demand personal accountability, the Fed seems to be content with relying on unverified and potentially inaccurate data. If this does not prove both the inherent unreliability of these tests and that the banks are still so hopelessly complex that their executives do not know what’s going on inside of them (See Whale, London), I’m not sure what would.
Suresh Naidu: analyzing the language of political partisanship
I was lucky enough to attend Suresh Naidu‘s lecture last night on his recent work analyzing congressional speeches with co-authors Jacob Jensen, Ethan Kaplan, and Laurence Wilse-Samson.
Namely, along with his co-authors, he found popular three-word phrases, measured and ranked their partisanship (by how often a democrat uttered the phrase versus a republican), and measured the extent to which those phrases were being used in the public discussion before congress started using them or after congress started using them.
Note this means that phrases that were uttered often by both parties were ignored. Only phrases that were uttered more by one party than the other like “free market system” were counted. Also, the words were reduced to their stems and small common words were ignored, so the phrase “united states of america” was reduced to “unite.state.america”. So if parties were talking about the same issue but insisted on using certain phrases (“death tax” for example), then it would show up. This certainly jives with my sense of how partisanship is established by politicians, and for the sake of the paper it can be taken to be the definition.
The first data set he used was a digitized version of all of the speeches from the House since the end of the Civil War, which was also the beginning of the “two-party” system as we know it. Third party politicians were ignored. The proxy for “the public discussion” was taken from Google Book N-grams. It consists of books that were published in English in a given year.
Some of the conclusions that I can remember are as follows:
- The three-word phrases themselves are a super interesting data set; their prevalence, how the move from one side of the aisle to the other over time, and what they discuss (so for example, they don’t discuss international issues that much – which doesn’t mean the politicians don’t discuss international issues, but that it’s not a particularly partisan issue or at least their language around this issue is similar).
- When the issue is economic and highly partisan, it tends to show up “in the public” via Google Books before it shows up in Congress. Which is to say, there’s been a new book written by some economist, presumably, who introduces language into the public discussion that later gets picked up by Congress.
- When the issue is non-economic or only somewhat partisan, it tends to show up in Congress before or at the same time as in the public domain. Members of Congress seem to feel comfortable making up their own phrases and repeating them in such circumstances.
So the cult of the economic expert has been around for a while now.
Suresh and his crew also made an overall measurement of the partisanship of a given 2-year session of congress. It was interesting to discuss how this changed over time, and how having large partisanship, in terms of language, did not necessarily correlate with having stalemate congresses. Indeed if I remember correctly, a moment of particularly high partisanship, as defined above via language, was during the time the New Deal was passed.
Also, as we also discussed (it was a lively audience), language may be a marker of partisan identity without necessarily pointing to underlying ideological differences. For example, the phrase “Martin Luther King” has been ranked high as a partisan democratic phrase since the civil rights movement but then again it’s customary (I’ve been told) for democrats to commemorate MLK’s birthday, but not for republicans to do so.
Given their speech, this analysis did a good job identifying which party a politician belonged to, but the analysis was not causal in the sense of time: we needed to know the top partisan phrases of that session of Congress to be able to predict the party of a given politician. Indeed the “top phrases” changed so quickly that the predictive power may be mostly lost between sessions.
Not that this is a big deal, since of course we know what party a politician is from, but it would be interesting to use this as a measure of how radical or centered a given politician is or will be.
Even if you aren’t interested in the above results and discussion, the methodology is very cool. Suresh and his co-authors view text as its own data set and analyze it as such.
And after all, the words historical politicians spoke is what we have on record – we can’t look into their brain and see what they were thinking. It’s of course interesting and important to have historians (domain experts) inform the process as well, e.g. for the “Martin Luther King” phrase above, but barring expert knowledge this is lots better than nothing. One thing it tells us, just in case we didn’t study political history, is that we’ve seen way worse partisanship in the past than we see now, although things have consistently been getting worse since the 1980’s.
Here’s a wordcloud from the 2007 session; blue and red are what you think, and bigger means more partisan:

The Neighbors
When I was a senior in high school, my parents moved house to the outskirts of Lexington, Massachusetts, from the center of town where I’d grown up. The neighborhood had a totally different feel, even though it was the same town. In particular it had a kind of prissiness that we didn’t understand or care for.
My best friend Becky ran away from home to live with my family during this year, so most of my memories of that house involve her. Our good friend Karen often visited as well; she drove her beat-up old VW van up the hill and parked it right across from our house on the street. This was totally legal, by the way, and there were plenty of people who parked on the street nearby.
Just to describe the van a bit more: it had about 5 different color paints on it, but not in any kind of artistic way. It was just old. And it had a million, possibly more than a million, memories of teenage sex hanging on to it- at some point there had even been a mattress installed in the back of the van. I remember this from earlier in high school, when the van had been owned by Karen’s older half-sister and had been parked out behind the high school.
Just in case this is getting too seedy for you, keep in mind we were the freaks and geeks of high school (J-House), we talked about D&D and always used condoms. I don’t even know why I’m saying “we” because I personally never got any action in the legendary van, but I was certainly aware of it.
So anyway, Karen would drive up the hill and park her ugly-but-legendary van there, and every time she’d do it, she’d get a nasty note on her windshield by the time she left, something along these lines:
“Please don’t part your van in front of our window. It is an eyesore. – the Neighbors”
I remember laughing hysterically with Karen and Becky the first time Karen got such a note and bringing it to my mom, who, in her characteristically nerdy way, said something about how it’s perfectly legal to park on the street and to ignore it.
What was awesome about this was how, from then on, Karen would very carefully park her van from then on right in front of the window of the Neighbors (their last name was actually “Neighbors”). Sometimes she’d pull up a bit, then pull back, then get it settled just so. And she always got the note, even though we never actually saw them leave the house. They were like magical prissy elves.
One more story about the Neighbors which is too good to resist. There was a swimming pool in the back of the house, which my mom hated with all her heart because she was in charge of the upkeep and it kept mysteriously turning green. And Becky and I were going through a back-to-nature phase, which meant we were planning to go hiking up in the White Mountains. So one day we were testing our tent out in the front yard, learning how to open and close it, and we happened to be wearing swimming suits, since we’d been swimming.
The Neighbors called my house (this is back when there were things called “telephone books” and you could find someone’s phone number without asking them) and complained to my grandma, who happened to answer the phone, and who also happened to be wearing nothing but a swimming suit, that “there are skimpily clad young ladies cavorting on the front lawn in an obscene manner.”
Now, my grandma had arthritis and couldn’t comfortably walk or stand for very long, but this phone call seemed to give her extra strength. She walked to the front door and stood there, arms crossed, looking defiantly out at the neighborhood for five minutes. After about four minutes I asked her if everything was all right and she said, “perfectly fine.”


