Team Turnstile: how do NYC neighborhoods recover from extreme weather events?
I wanted to give you the low-down on a data hackathon I participated in this weekend, which was sponsored by the NYU Institute for Public Knowledge on the topic of climate change and social information. We were assigned teams and given a very broad mandate. We had only 24 hours to do the work, so it had to be simple.
Our team consisted of Venky Kannan, Tom Levine, Eric Schles, Aaron Schumacher, Laura Noren, Stephen Fybish, and me.
We decided to think about the effects of super storms on different neighborhoods. In particular, to measure the recovery time of the subway ridership in various neighborhoods using census information. Our project was inspired by this “nofarehikes” map of New York which tries to measure the impact of a fare hike on the different parts of New York. Here’s a copy of our final slides.
Also, it’s not directly related to climate change, but rather rests on the assumption that with climate change comes more frequent extreme weather events, which seems to be an existing myth (please tell me if the evidence is or isn’t there for that myth).
We used three data sets: subway ridership by turnstile, which only exists since May 2010, the census of 2010 (which is kind of out of date but things don’t change that quickly) and daily weather observations from NOAA.
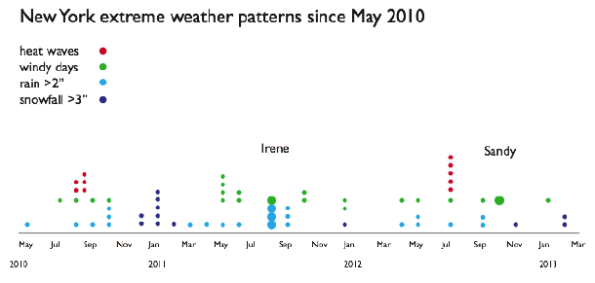
Using the weather map and relying on some formal definitions while making up some others, we came up with a timeline of extreme weather events:
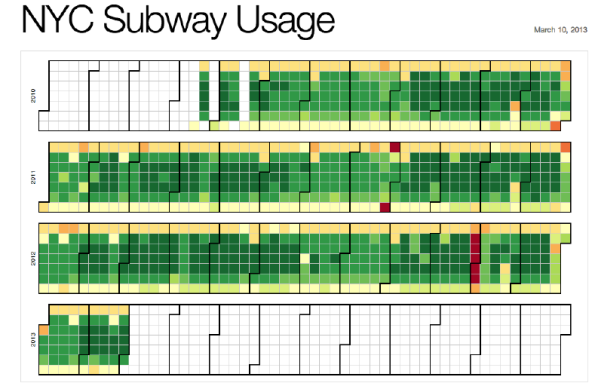
Then we looked at subway daily ridership to see the effect of the storms or the recovery from the storms:
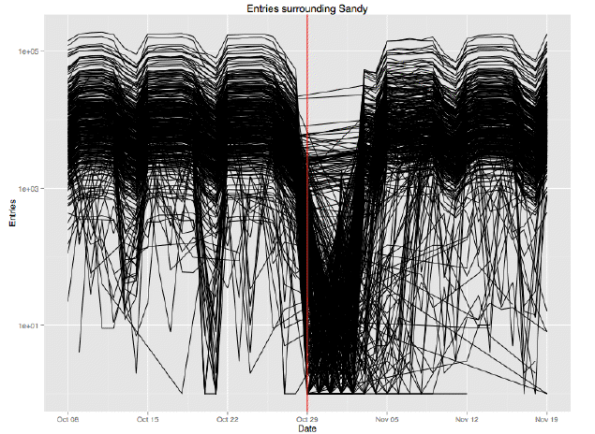
 We broke it down to individual stations. Here’s a closeup around Sandy:
Then we used the census tracts to understand wealth in New York:
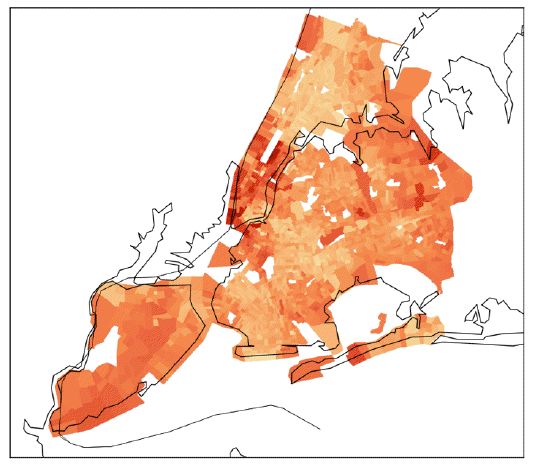 And of course we had to know which subway stations were in which census tracts. This isn’t perfect because we didn’t have time to assign “empty” census tracts to some nearby subway station. There are on the order of 2,000 census tracts but only on the order of 800 subway stations. But again, 24 hours isn’t alot of time, even to build clustering algorithms.
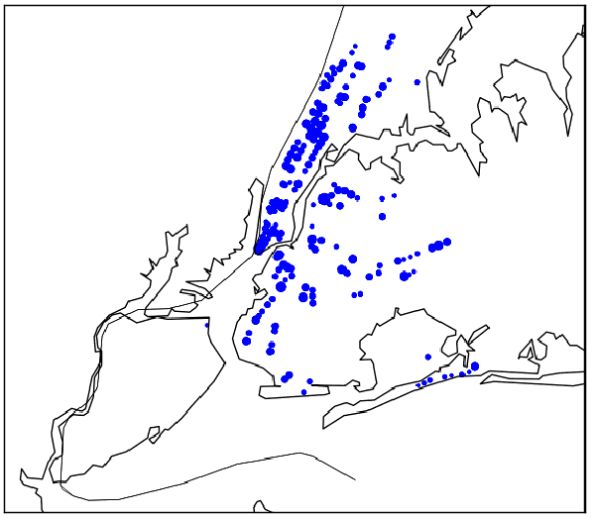
Finally, we attempted to put the data together to measure which neighborhoods have longer-than-expected recovery times after extreme weather events. This is our picture:
Interestingly, it looks like the neighborhoods of Manhattan are most impacted by severe weather events, which is not in line with our prior [Update: I don’t think we actually computed the impact on a given resident, but rather just the overall change in rate of ridership versus normal. An impact analysis would take into account the relative wealth of the neighborhoods and would probably look very different].
There are tons of caveats, I’ll mention only a few here:
- We didn’t have time to measure the extent to which the recovery time took longer because the subway stopped versus other reasons people might not sure the subway. But our data is good enough to do this.
- Our data might have been overwhelmingly biased by Sandy. We’d really like to do this with much longer-term data, but the granular subway ridership data has not been available for long. But the good news is we can do this from now on.
- We didn’t have bus data at the same level, which is a huge part of whether someone can get to work, especially in the outer boroughs. This would have been great and would have given us a clearer picture.
- When someone can’t get to work, do they take a car service? How much does that cost? We’d love to have gotten our hands on the alternative ways people got to work and how that would impact them.
- In general we’d have like to measure the impact relative to their median salary.
- We would also have loved to have measured the extent to which each neighborhood consisted of salary versus hourly wage earners to further understand how a loss of transportation would translate into an impact on income.


More violent storms from climate change is not a myth. It is a prediction based on our knowledge of heat in weather systems now. Heat works like the fuel for storms, in a sense, because their ferocity has to do with temperature gradients. It is possible that weather will behave fundamentally differently in a world 10 degrees fahrenheit warmer than our current one; however, operating on the assumption that weather will work similarly to how it does now, additional heat in the system will make more powerful storms.
LikeLike
Great thanks.
LikeLike
I should also add that “superstorms” or large tropical storms will not be the main threat, according to climate scientists – that honor belongs to drought. Which may well be widespread and catastrophic. But a warmer atmosphere with more water vapor in it, and a higher and hotter ocean, is going to make some tremendous tropical storms if what we now see in their genesis and development holds.
LikeLike
Well, you can start reading about extreme weather in:
http://www.realclimate.org/index.php/archives/2011/11/the-ipcc-report-on-extreme-climate-and-weather-events/
But yes, Savanarola is right. More heat is more energy which can cause more destruction.
LikeLike
I think that what you’ve ended up with is a map of where people live who worked in that part of lower Manhattan that was without power for a prolonged period following Sandy. So, yes, it’s likely that your data was biased by Sandy. But you’re not measuring just the recovery of transit, either.
LikeLike
Or something like that. Regardless of where people live, once they get to the city they take the subway and/or bus to get to work (unless they’re quite wealthy and use cabs / car services, in which case can assume outside of the scope of concern for this analysis) — and the jobs are mostly in Manhattan. I don’t think there was an attempt to remove suburbanites from the analysis.
LikeLike