The Models Were Telling Us Trump Could Win
This is a post by Eugene Stern, originally posted on his blog sensemadehere.wordpress.com.
Nate Silver got the election right.
Modeling this election was never about win probabilities (i.e., saying that Clinton is 98% likely to win, or 71% likely to win, or whatever). It was about finding a way to convey meaningful information about uncertainty and about what could happen. And, despite the not-so-great headline, this article by Nate Silver does a pretty impressive job.
First, let’s have a look at what not to do. This article by Sam Wang (Princeton Election Consortium) explains how you end up with a win probability of 98-99% for Clinton. First, he aggregates the state polls, and figures that if they’re right on average, then Clinton wins easily (with over 300 electoral votes I believe). Then he looks for a way to model the uncertainty. He asks, reasonably: what happens if the polls are all off by a given amount? And he answers the question, again reasonably: if Trump overperforms his polls by 2.6%, the election becomes a toss-up. If he overperforms by more, he’s likely to win.
But then you have to ask: how much could the polls be off by? And this is where Wang goes horribly wrong.
The uncertainty here is virtually impossible to model statistically. US presidential elections don’t happen that often, so there’s not much direct history, plus the challenges of polling are changing dramatically as fewer and fewer people are reachable via listed phone numbers. Wang does say that in the last three elections, the polls have been off by 1.3% (Bush 2004), 1.2% (Obama 2008), and 2.3% (Obama 2012). So polls being off by 2.6% doesn’t seem crazy at all.
For some inexplicable reason, however, Wang ignores what is right in front of his nose, picks a tiny standard error parameter out of the air, plugs it into his model, and basically says: well, the polls are very unlikely to be off by very much, so Clinton is 98-99% likely to win.
Always be wary of models, especially models of human behavior, that give probabilities of 98-99%. Always ask yourself: am I anywhere near 98-99% sure that my model is complete and accurate? If not, STOP, cross out your probabilities because they are meaningless, and start again.
How do you come up with a meaningful forecast, though? Once you accept that there’s genuine uncertainty in the most important parameter in your model, and that trying to assign a probability is likely to range from meaningless to flat-out wrong, how do you proceed?
Well, let’s look at what Silver does in this article. Instead of trying to estimate the volatility as Wang does (and as Silver also does on the front page of his web site, people just can’t help themselves), he gives a careful analysis of some possible specific scenarios. What are some good scenarios to pick? Well, maybe we should look at recent cases of when nationwide polls have been off. OK, can you think of any good examples? Hmm, I don’t know, maybe…
Aiiieeee!!!!
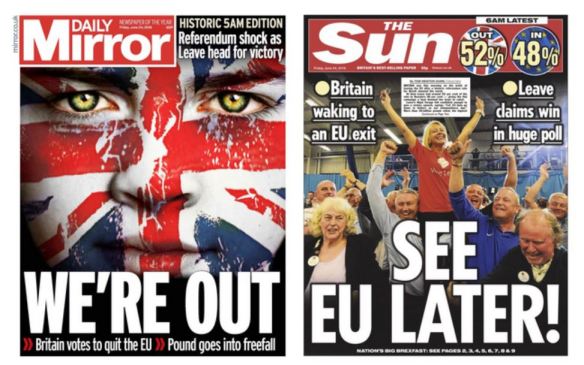
Look at the numbers in that Sun cover. Brexit (Leave) won by 4%, while the polls before the election were essentially tied, with Remain perhaps enjoying a slight lead. That’s a polling error of at least 4%. And the US poll numbers are very clear: if Trump overperforms his polls by 4%, he wins easily.
In financial modeling, where you often don’t have enough relevant history to build a good probabilistic model, this technique — pick some scenarios that seem important, play them through your model, and look at the outcomes — is called stress testing. Silver’s article does a really, really good job of it. He doesn’t pretend to know what’s going to happen (we can’t all be Michael Moore, you know), but he plays out the possibilities, makes the risks transparent, and puts you in a position to evaluate them. That is how you’re supposed to analyze situations with inherent uncertainty. And with the inherent uncertainty in our world increasing, to say the least, it’s a way of thinking that we all better start becoming really familiar with.
The models were plain as day. What the numbers were telling us was that if the polls were right, Clinton would win easily, but if they were underestimating Trump’s support by anywhere near a Brexit-like margin, Trump would win easily. Shouldn’t that have been the headline? Wouldn’t you have liked to have known that? Isn’t it way more informative than saying that Clinton is 98% or 71% likely to win based on some parameter someone plucked out of thin air?
We should have been going into this election terrified.


Another issue with the polls and the news:
LikeLike
Polls also rely on honest, or relatively honest answers. Otherwise you end up with a garbage in, garbage out scenario. And to be honest polls and stats are rather pointless at any rate. You may as well say that Trump has a good chance to win the election. That’s far more important than trying to thumb suck some random meaningless percentage. All that you example said is that if Trump did well he could win…. You don’t need maths for that kind of statement….
LikeLike
Don’t take this as smug, some news outlets did report that many did not say they were voting for Trump for fear of being publically shamed. As Mathbabe pointed out, the echo chamber has got to go away. And Politically Correctness did go too far. Remember all that talk of the “Silent Majority.”
LikeLike
For whatever it’s worth, I was worried about this before the election. I’d read something which said there wasn’t much evidence, based on previous polling and elections, of people misrepresenting how they were going to vote. But I thought that even if this was true of previous elections, there was good reason to believe it wouldn’t be true of this one.
There were many articles and statements about how racist, xenophobic, and sexist Trump and many of his supporters are. I thought if I were a Trump supporter (which I wasn’t) and a pollster asked me what I planned to do on election day, I might not be so happy about telling the pollster I was going to vote for the guy everyone is calling a racist, etc.
Then we had the tape of Trump’s vile comments about women come out, as well as several women coming forward to say that he’d assaulted them. I became even more worried about the lying factor then. Because at that point if you told someone you were voting for Trump, it also looked like you might be voting for a sex offender.
So by a few days before the election, I was looking at the polls, wondering about the effects of the FBI stuff, and thinking about the lying factor; I thought Clinton would still win but I thought it would be a very narrow victory. Because I was thinking that if people had misrepresented who they were voting for, the polls were showing such a close election that that could make the difference. I haven’t seen any post election analysis of how much a factor this was. But before the election, it was definitely a worry for me.
LikeLike
If to have accurate polls, people need to not feel ashamed of voting for Trump, then I’ll take the inaccurate polls.
LikeLike
The math(s) helps, as long as you don’t ask for a random meaningless percentage, as you say. What the math tells you is that if something that happened very recently (Brexit-scale poling error) happens again, then Trump is very likely to win. (It’s not especially hard math, but it’s still math, a model, you have to set it up properly, etc.) The math *doesn’t* tell you how likely Brexit-scale error is, but if you think it’s at least a plausible scenario, as you probably should, then you know you should worry. It’s an order of magnitude calculation, if you like. Most people I know were totally blindsided by Trump winning, and if you ran through a plausibility analysis like this in your head, you wouldn’t be.
LikeLike
There’s another interpretation, well known as the problem which spooks many usage of machine learning: It’s possible the calibration or training set or population is NOT representative of the forecasted one. This always plagues political polling: You have past elections and polls, but for them to be applicable to an election means assuming they are representative of the population which actually turns out to vote. I imagine there are nonparametric ways of assessing this uncertainty, but it’s hard to know how to use them for forecasting and decision-making. About all you can do is announce the quite possibly multimodal posterior distribution.
LikeLike
This is a good take
LikeLike
I think the human element was also play: for many of the pollsters, a Trump victory was literally unthinkable, so it’s possible that they interpreted their models in that light. A pre-election article in the Huffington Post about why Nate Silver was wrong, and questioning “538’s professional competence and responsibility in reality checking the output of their model”, reads particularly badly in hindsight:
http://www.huffingtonpost.com/entry/whats-wrong-with-538_us_581ffe18e4b0334571e09e74
LikeLike
I think that the Comey effect in the last week of the campaign was a significant factor that the polling and models did not adequately take into account. We know that the polling showed a clear tightening of the race after the last announcement that they had more emails to look at, and this change could have continued as a trend. I heard that there was inadequate polling in the states that flipped from expectations in the weekend preceding the election, and the trend may have gone undetected. Comey’s “oh never mind” announcement on a Sunday two days before the election probably had little or no effect on the trend, and Clinton certainly had no time to recover. This well executed “dirty trick” by Comey was typical Republican tactic and was perfectly executed, giving Comey a plausible “out” at the very last moment after the damage was done. Now that Republicans completely control the government, you can bet that there will be no investigations of this, and the media is already dropping the story. There will, however, be more endless investigations of the Clintons.
LikeLike
Some of us were going into the election terrified. The Malheur occupiers verdict to me was a stark warning that things were not as they seemed.
LikeLike
Unfortunately due to an extremely urgent matter I was overseas during the elections and did not cast a vote. But as I read all the excuses of why the polls were wrong I cannot help but be reminded of the financial models of 2007-2008 and how, they too, were also very wrong. More than a little pollster mea culpa would be quite appropriate.
LikeLike
Indeed, the Ivy League “economist” #BadMath rears its ugly head again. Aggregation of so-called normal curve concepts (averages, arithmetic mean, median, “volatility”, standard deviations, etc.) have no valid scientific basis in human behavior and never have. The fraudulent “only once in a thousand years” is a relentless fairy tale of “tails” that will continue to surprise the gullible with Black Swans until frequentist nonsense can finally be mediated with bayesian sensibility.
LikeLike
I went in to this election very worried and it’s because I had been reading Nate Silver.
LikeLike
Something to keep in mind here, though, when comparing this to Brexit, is that that 52%-48% is a real aggregate popular vote breakdown. If you think of the overall national polls that, as far as I can remember had Clinton leading by about 1-2%, once the final ballots in California are counted, that will be about spot on. Obviously, we have a ‘special’ system which means that you have to take into account other peculiar factors when trying to forecast the electoral winner. But it seems to me that national-level polls of likely voters will have gotten their numbers right. It was the translation of state-level data into likelihood estimates of electoral college outcomes that failed. I have less faith in Silver than I used to but I do give him credit for having put a focus on the real chance that we would see a popular vote/electoral college split.
LikeLike
Exactly. The media-touted “win” for Hillary in the popular vote is highly misleading given the concentration of her supporters.
A candidate needs only 50% + 1 to win, but that has to be the margin in each electoral college district. The surplus in NYC or SF is irrelevant.
Since 2008 Democratic Party strategists misjudged how to use their data. Resources were concentrated on the swing voters in the swing districts. It was great narrow targeting.
However, little to no attention was paid to downballot races that could have helped turnout from the bottom. The strategy was exclusively top down, overemphasizing those few voters who “mattered.”
This narrowcasting ended up with campaign volunteers at the local level were dedicated to calling out of state swing voters. This too-clever-by-half strategy gutted resources for local and state races that can strongly motivate get out the vote. (I was a campaign treasurer for a state rep candidate in 2012 red state and we couldn’t get volunteers. The national campaign took everyone for calls out of state, completely gutting our local races. And donations – DNC and MoveOn mostly.
Cathy’s chapter on the Targeted Citizen describes the “nefarious feedback loop.” This is it, writ large. The lack of enthusiasm for Hillary is directly attributable to the consequences of ignoring not just voters (quantitative) but supporters (qualitative).
Volunteers and voters are crushed when they don’t matter. Why vote when your solid red or solid blue district won’t affect who’s President? Why put your name on the ballot for a local race when the party ignored you and sucked out your resources?
Big data. Stupid data. Data with real-life consequences.
LikeLike
The AFLAC duck of “uncertainty” that’s been screaming for attention for many years is the level of democracy present in American elections.
If I am not mistaken, polling analysis only models the interaction that occurs between a voter and a voting booth (or absentee ballot). This interaction stands squarely in the chronological middle of a process that includes so many other factors, to put one’s faith in modeling just the voter-voting-booth interaction represents a sort of denial in my opinion.
During his campaign Donald Trump occasionally used his unprecedented oratory freedom to say things that were downright brilliant. One of them was his preemptive complaint that elections are “rigged.”
By the way, the DNC totally deserved everything it got in this election. It especially deserved the red-state suppression of minority voting that occurred, but more than that, it simply deserved to lose. Even though I did vote for Hillary (because it was the obvious thing to do), part of me delights in the fact that the Democratic party lost the election (there is at least SOME justice in this world).
LikeLike
Oh and by the way, AFLAC stands for “Afraid For Loss of Advanced Civilization.”
Actually no, that’s not true—just trying to cover up my spelling mistake with an attempt at some humor. It turns out that Aflac is indeed an acronym, but it’s not spelled like one.
While I’m in correction mode here, scratch “oratory freedom” and replace it with “oratorical freedom.”
LikeLike
Great post. I was definitely not surprised he won. Just so shocked at the implications of his victory in terms of our fellow citizens and the trumpian future.
LikeLike
So now that we’ve had fun with the numbers, when are we going to ask WHY so many voted for Trump?
Will half the nation be written off as a bunch of backwater rednecks?
If there are so many racists in this country, where were they when Obama first ran for POTUS?
More importantly, where were they the SECOND TIME Obama ran?
Why did so many blue states flip red? Are we truly willing to assume half the nation’s population turned racist over night?
Or did Trump speak to things that were important to them that Clinton did not?
The USA brings in over 1 million immigrants every year. How does that affect local economies after so many years?
JamesNT
LikeLike
These are good questions. They may be hard for those who voted for Clinton (and I’m one of them) to face, but I think these are among the ones we should be asking. I have no doubt that some of those who voted for Trump are racists. But I’m equally doubtful that all of them are. I don’t think there’s an easy way for any of us to know for sure the ratio of racists to non-racists among Trump voters. But I suspect many of those who voted for him did so in disgust. They just may have been more disgusted by Clinton.
Now although I’m not a huge fan of Clinton, I’m no where near as turned off by her as I am of Trump (to put it mildly). But that doesn’t mean those who came to a different conclusion about that than I did are necessarily racists, misogynists, etc.
LikeLike
I voted for Trump. But believe me, I held my nose the entire time. As I have always said, we had no good choices this time around.
For those who really want to know why Trump won, fall back on the one tried and true saying we’ve all heard all our lives: Follow the money. And by God, talk to people. Get off the “We are all Activists” shtick and talk to people. Like this guy did:
http://www.glennbeck.com/2016/11/10/what-a-gay-muslim-pakistani-american-immigrant-learned-traveling-to-rural-alaska-the-week-before-the-election/?utm_source=iHeart&utm_campaign=iHeart-post20161110&utm_medium=post
That being said, are their racist in this country? Yes, yes there are. And when Trump started on this thing about immigration, those racists were happy enough to tag along for the ride because Trump’s goals at list partially aligned with theirs.
Bringing in over 1 million new immigrants every year is a problem. It sounds great at first until one realizes:
They have to live somewhere.
They have to eat somewhere.
They have to have healthcare somewhere.
They have to work somewhere.
That means more competition for already limited resources.
What does it mean for a small town 4,740 people (Mt. Olive, NC) when there is a line of illegals/legals at the Piggly Wiggly grocery store sending thousands of dollars to Mexico via Western Union every week and this goes on for years?
http://www.dailymail.co.uk/news/article-2271455/Revealed-How-immigrants-America-sending-120-BILLION-struggling-families-home.html
How much money is spent by the local economy in free healthcare (mostly via the ER) to immigrants who can’t afford it because they are here illegally?
As the local economy gets drained, WHAT IS THE EXPECTED REACTION OF THE LOCAL PEOPLE?
This Presidential Election was the struggles of the small town versus the “enlightenment” of the big city.
I’ve lived most of my life in small towns. Most of the people on this blog seem to be from big cities. And I have most certainly felt that “looked down upon from on high” feeling from some here.
It’s no wonder Trump won.
JamesNT
LikeLike
The LA Times poll always had Trump winning…every week for the past year despite all the other polls being for Clinton. They were constantly being ridiculed by everyone. Has anyone looked into their methodology? Maybe there is something in there that details why they got it right.
LikeLike
There were a few articles about that, I think including one by Nate Silver. But… if we’re talking about the binary outcome of “Hillary or Trump”, a coin has a 50% chance of getting it right.
LikeLike
IIRC, the LA Times was a tracking poll, so it contacted the same group of respondents repeatedly over time. It also weighted by very narrow demographic categories. Their sample group happened to have one young black Trump supporter; because of their weighting system, that heavily moved the poll towards Trump. So it looks more like “lucky guess” than “clever analysis” — Trump certainly didn’t have an unforeseen surge of black voters in his favour.
LikeLike
When Nate Silver was saying that Clinton’s chances were 75%, a couple of weeks before the election, I felt pretty comfortable about it, even though my head said that I was being irrational and that a one in four chance was horribly high for such a disastrous outcome. So I decided to toss a coin twice and see whether it came up heads twice. It did.
LikeLike
I definitely went into the election terrified. But I notice that no one is mentioning Allan Lichtman. Is he a well-known crank or something? His arguments sounded scarily convincing to me, because (due to Brexit and others), I am very suspicious of poll results, which are skewed due to lack of control of the selected population and to people’s embarrassment or desire for privacy and much more likely to believe predictions not based on polls at all.
LikeLike
Not really; he showed up more after-the-fact, even though he has been around. I wrote a bit about this though: https://wrossmorrow.com/2016/11/11/heuristics-vs-538-do-we-need-big-data-to-predict-elections/
LikeLike
@calcroteaus I have read this http://www.nytimes.com/2016/10/13/upshot/how-one-19-year-old-illinois-man-is-distorting-national-polling-averages.html?_r=0 article on the poll you mentioned. Thought the article was very interesting.
LikeLike
If the pollsters are relying on phone calls to get their samples, there is an immediate bias. Many, many people I know do not answer their phones if the number they see is not one they know. Many other people do not have listed phone numbers. This is a bias that is increasing with the decreasing use of land lines. I suspect it’s as bad as the election in which Dewey was predicted as the winner over Truman.
LikeLike
Thanks for tackling the mechanics of polling. My knee jerk reaction has been to agree that it’s oversimplifying to say that the polls were simply wrong (and 538’s seemingly anomalous forecast confirms that).
But in light of the recent obsession with polling during the campaign season, something for which we may have to blame 538 even though it’s not Silver’s fault, I wonder if there is another question we should be asking about feedback. When I read “The Quants” after the financial collapse, one of the things that struck me was the way quantitative traders seem to think they could take advantage of marginal fluctuations in prices using models that assumed traditional trading methods. They seemed not to consider what widescale automatic trading based on the same assumptions would do to those underlying models.
Similarly, the ubiquity of information about polling results along with the near constant stream of reporting and prognosticating based on them cannot possibly have no affect on voters. To what extent did the results of polls and reporting saying Clinton would win suppress Clinton voter turnout and energize Trump voter turnout? To what extent did Trump voters hide their intentions from pollsters not because they feared being called a racist but simply because they did not want to claim to be in a minority? Or did pollsters themselves over-correct in the pro-Clinton direction? (Milliken’s oil drop experiment comes to mind with respect to confirmation bias.) I haven’t seen too much, if any, rigorous discussion about how the fixation on polling information itself must be accounted for in election projections…but I can’t think of a better forum for discussing it than this one. I wish I were enough of a subject matter expert on this matter to contribute much to the discussion, but I would love to read more if you learn of anything.
LikeLike
I haven’t read “The Quants,” as I don’t think he’s the first author to write about something he doesn’t really understand, but you raise an important parallel between Wall Street quants and pollsters. With a few exceptions of lone wolf traders, most quant traders look for confirmation of the validity of their arbitrage model by seeing other traders put on the same trade – hopefully after the trader has first put on hers. Many pollsters seem to look at what other polls are showing and then adjust their numbers based on what other polls are showing. Crowd sourcing at its worst. I would not even be surprised if some pollsters aren’t even conducting real polls and just reporting some adjusted consensus of other polls.
LikeLike
Cathy,
You’ve FINALLY come out and stated that statistics is about modeling uncertainty. I never understood that until now. But how can anyone model uncertainty, or “error”? Polling was supposed to do that, so now I distrust both statistics and polling even more.
LikeLike
The short answer is that it varies tremendously by application. I’m trained as a physicist, and there are well-understood distributions for modeling uncertainty for some types of measurements. But that becomes increasingly difficult when you start trying to interpret results from large numbers of measurements…and even more so when you are aggregating aggregations of measurements (common when analyzing detector data).
538’s methodology tries to empirically model systematic uncertainty (they have detailed explanations for how they do this). But they fully admit that there are limitations to this method. It’s admittedly very tough because you can’t really include what you don’t know in your model. You can slap on some arbitrary fudge factor, but it’s meaningless and doing so unfairly would make you seem more accurate than you actually are.
LikeLike
There may be “there are well-understood distributions for modeling uncertainty for some types of measurements,” but this makes certain epistemological assumptions and presuppositions, right? Okay, what are they?
LikeLike
Guest2,
As a start, try to find an accessible piece online which covers confidence and Bayesian credible intervals.
LikeLike
This is exactly the problem: credibility and confidence intervals purport to measure measurement error. But how can this be done without knowing apriori true values? All measurements involve some margin of error.
LikeLike
Guest2: uncertainties and errors both have numbers associated with them. Statisticians use these terms differently from their common use: “error” = “mistake”, and “uncertainty” = “I don’t know”.
LikeLike
What about measurement error? Every measurement includes some error by which it deviates from the actual, true value.
https://en.wikipedia.org/wiki/Observational_error
LikeLike
Guest2: uncertainty and error have numbers associated with them, when they are used by statisticians. This is different from their common use, where “error” = mistake” and “uncertainty” = “I don’t know”. For example, in common use “Is it 5?”. “I don’t know”. is an expression of uncertainty. “Is it 5?” “That’s the most likely, but it could be anywhere from 3 to 7”. is the modeling use. Trump rolled a 3.
LikeLike
Here is a statistical article on error(s), where the term has an established meaning.
https://en.wikipedia.org/wiki/Errors_and_residuals
LikeLike
“The models were plain as day. What the numbers were telling us was that if the polls were right, Clinton would win easily, but if they were underestimating Trump’s support by anywhere near a Brexit-like margin, Trump would win easily. Shouldn’t that have been the headline? Wouldn’t you have liked to have known that? Isn’t it way more informative than saying that Clinton is 98% or 71% likely to win based on some parameter someone plucked out of thin air?”
Yes. What we are essentially talking about is how “robust” the prediction is to small changes in the poll numbers. In this case, “not very.”
The “probability” that Silver and others provide as output from their models is not even a real probability, which makes it very funny that that is what Silver is now using to make the argument that “he was not wrong”
He may not have been wrong, but not for the reason he claims.
LikeLike
If I understand Sam Wang’s results correctly, his >99% headline figure was for Clinton winning the national popular vote — which, in fact, she did by a clear margin. For some idiosyncratic reason, Wang didn’t publish a probability of winning the electoral college (EC) — but if you download his results and sum over EC totals, he had a final prediction of 6% probability for an EC win by Trump.
Having noted this, I pointed out before the election that we should in fact be terrified: http://blog.iainroberts.com/2016/11/reasons-to-be-afraid.html
So I think Wang’s mistake was one of presentation, more than analysis.
LikeLike