Gerrymandering algorithms
I’ve been thinking about gerrymandering recently, specifically how to design algorithms to gerrymander and to detect gerrymandering.
Whence “Gerrymander”?
First thing’s first. According to wikipedia (and my friend Michael Thaddeus), the term “Gerrymander” is a mash-up of a dude named Elbridge Gerry and the word “salamander.” It was concocted when Gerry got made fun of for his crazy districting of Massachusetts back in 1812 to push out the power of the Federalists:
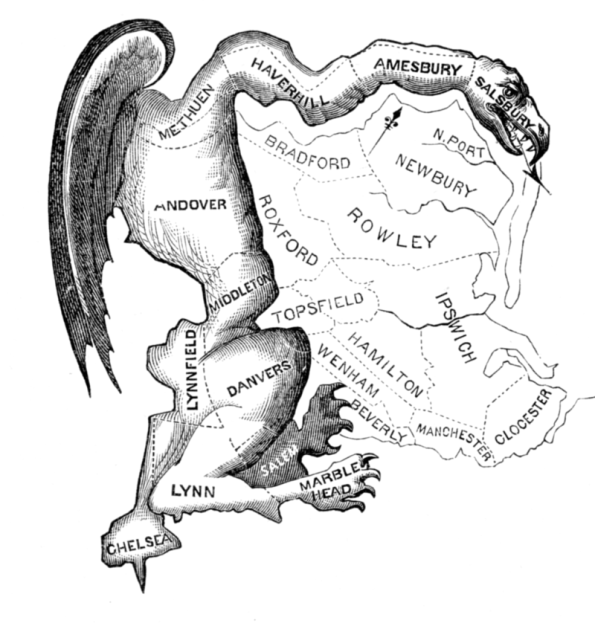
It’s true, this is depicted as a dragon. But believe me, someone thought it looked like a salamander.
How To Gerrymander
Think about it. In this crazy pseudo-democratic world of ours, we’re still voting locally and asking delegates to ride their horses to a centralized location to cast a vote for the group. The system was invented well before the internet, and it is a ridiculous and unnecessary artifact from the days when information didn’t travel well. In particular, it means you can manipulate voting at the local level, by gaming the definition of the district boundaries.
So, let’s imagine you’re in charge of drawing up districts, and you want to rig it for your party. That means you’d like your party to win as often as possible and lose as seldom as possible per district. If you think about it for a while, you’ll come up with the following observation: you should win by a thin margin but lose huge.
Theoretically that would mean building districts – a lot of them – that are 51% in your favor, and then other districts that are 100% against you.
In reality, you can’t count on anything these days, so you might want to create slightly wider margins, of maybe 55% your party, and there might be rules about how connected districts must be, so you’ll never achieve 100% loss districts.
Although clearly not very hard and fast rules.
How Not To Gerrymander
On the other side of the same question, we might ask ourselves, is there a better way? And the answer is, absolutely yes. Besides just counting all votes equally, we could draw up districts to contain similar numbers of voters and to be more or less “compact.”
If you don’t know what that really means, you can go look at the work of a computer nerd named Brian Olsen, who built a program to do just this.

Before and after Brian Olsen gets his hands on Pennsylvania
Detecting Gerrymandering
The concept of compactness is pretty convincing, and has led some to define gerrymandering to be, in effect, a measurement of the compactness of districts. More formally, there’s a so-called “Gerrymander Score” that is defined as the ratio of the perimeter to the area of districts, with some fudge factor which allows for things like rivers and coastlines.
Another approach is a “Gerrymander statistical bias” test, namely the difference between the mean and the median. Here you take the results of an election by district, and you rank them from lowest to highest for your party. So there might be a district that only voted 4% for your party, and it might go on the left end, and on the other end the district that voted 95% for your party would be on the other end. Now look at the “middle” district, and see how much that district voted for your party. Say it’s 47%. Then, if your party won 55% of the vote overall in the state – the mean in this case is 55% – there’s a big difference between 55 and 47, and you can perhaps cry foul.
I mean, this seems like a pretty good test, since if you think back to what we would do to gerrymander, in the ideal world (for us) we’d get a bunch of districts with 45% for the other side and then a few with 99% for the other side, and the median would be 45% even if the other side had way more voters overall.
Problems With Gerrymandering Detection
There’s a problem, though, which was detected by, among other people, political scientists Jowei Chen and Jonathan Rodden. Namely, if you run scenarios on non-gerrymandered, compact districts, you don’t get very “fair” results as defined by the above statistical bias test.
This is because, in reality, Democrats are more clustered than Republicans. Democrats are quite concentrated in cities and college towns, and then they are more sparse elsewhere. They, in essence, gerrymander themselves.
Said another way, if you build naive districts that are compact (so their Gerrymander Scores are good) then there will be automatic “Gerrymander statistical bias” problems. Oy vey.
Which is not to say that there isn’t actual effective and nasty Gerrymandering going on. There is, in North Carolina, Florida, Pennsylvania, Texas and Michigan for the Republicans and in California, Maryland and Illinois for the Democrats.
But what it means overall is that there’s no reason to believe we’ll ever get out of this stupid districting system, because it gives an inherent advantage to Republicans. So why would they agree to tossing it?


Yeah, it’s worse than I imagined… when NC had to re-do its gerrymandered districts because they were based on race, the legislators admitted they re-did them based on party affiliation. It was explained to me that while race-based (or any other minority-based) districting is illegal, party-based districting is NOT! Duhh!
LikeLike
My favorite — MI-14
LikeLike
There is an easier fix (at least for the house of representatives) – raise the numbers of reps we send to DC. Shrinking the size of the districts should make it more difficult to effectively gerrymander – or at least make any gerrymandering much more “brittle”.
LikeLike
I’m sure you’ve seen this:
http://www.slate.com/articles/news_and_politics/map_of_the_week/2013/08/gerrymandering_jigsaw_puzzle_game_put_the_congressional_districts_back_together.html
LikeLike
This actually does a good job of also explaining why Trump has garnered so much support among the populace. Most of the people that don’t like Trump tend to be academia, those on welfare, and so on that are found in cities. Those that like Trump tend to be blue collar workers, farmers, and so on that are found in small towns.
Some of my run-ins with people that hang out on this blog are because I used to be one of those blue collar workers. It’s understandable.
JamesNT
LikeLike
To be fair, in today’s world, gerrymandering tend to favor rural parties. In the South, that was once the Democrats. Parties pick constituents to court.
LikeLike
A salamander was originally a mythical animal having the power to endure fire without harm (Webster’s).
LikeLike
Rather than judging gerrymandering by geographic considerations, judge it by how much vote wastage there is:
http://www.dailykos.com/story/2016/04/11/1513964/-Major-redistricting-lawsuit-could-spell-the-end-of-unfair-partisan-gerrymanders
The last time the SCOTUS considered gerrymandering questions, they said “come back to us when you can quantify it”. Now it’s being quantified. So as to your question why Republicans would give it up, maybe the SCOTUS will force them?
I’m astonished that you bring up Eldridge Gerry but don’t take the opportunity to reference his dick joke at the Constitutional Convention: “A standing army is like a standing member. It’s an excellent assurance of domestic tranquility, but a dangerous temptation to foreign adventure.”
LikeLike
My bad.
LikeLike
“you should win by a thin margin but lose huge”
This strategy is also optimal in handicapped league play when the handicap fails to reward player strength. One example is a bowling league where the handicap is 100% of the difference between a player’s average and some high score like 300 (to reward skill, bowling handicaps are usually set at 85% or 90% of this difference).
Decades ago I competed in a 100%-handicap singles (one-person teams) junior bowling league that attracted about thirty of Seattle’s best high school bowlers. Many had averages much higher than mine, but those who did were more concerned with their raw scores than with the intricacies of the league structure. Not moi…I quietly applied the optimal strategy and won both halves of the season, thus rendering the championship playoff moot.
LikeLike
By the way this strategy also has a compound-word name, albeit a less exotic one: sandbag. My Macbook’s cheap dictionary defines it as “deliberately underperforming in a race or competition to gain an unfair advantage.” Wikipedia’s “Glossary of cue sports terms” says “Sandbagging is a form of hustling, and in handicapped leagues, considered a form of cheating, as it is used to obtain a low handicap so that a skilled player can later use this rating to improper advantage in more important competitions.”
The conclusion of my comment was probably a little overstated—I actually don’t remember how much I may have “sandbagged” in that league if at all. (Wish I had the data set!) Intention can be difficult to pin down: considering the importance of the “mental game,” without any conscious intent to sandbag, the mere knowledge of the strategy’s existence might have induced a higher frequency of errant shots during lopsided blowouts than during closely-contested matches.
It’s also interesting to note that in the hypothetical scenario where everyone tries to “outsandbag” everyone else, the 100% bowling handicap that was theoretically supposed to factor skill out no longer does. For not only do the strongest players have the widest range of scores at their disposal to sandbag with, they are also better at achieving any given pin count on any given shot (in tenpins for example, it probably takes more skill to knock down say five pins on the first shot than all ten).
LikeLike
Cathy,
You might want to check out Meredith Richard’s work on Gerrymandering school districts. She’s one of the leaders in geo-located detection algorithms, and puts forward some really strong suggestions for the courts.
The Gerrymandering of School Attendance Zones and the Segregation of Public Schools A Geospatial Analysis
http://aer.sagepub.com/content/51/6/1119.short
LikeLike
This approach based on “wasted voted” seems quite interesting (and is recent): https://newrepublic.com/article/118534/gerrymandering-efficiency-gap-better-way-measure-gerrymandering.
LikeLike
The problem with the efficiency gap approach is that it fails completely if districts were divided with equal distributions according to the overall population. In my opinion equal distributions is the most unbiased and fairest approach of all. Yes, I know that means those in the minority won’t have representation but that’s a math problem, not a fairness problem.
Any system attempting to measure whether gerrymandering is occurring should have to pass the equal distribution test or its an utterly meaningless measure. For the efficiency gap statistic, if 51% of the population supported party A and 49% supported party B. A true non-gerrymandered system would not result in 51% of the districts being won by party A and 49% being won by party B. Instead, a truly non-gerrymandered system would result in 100% of the districts won by party A and 0% by party B. In this example, the efficiency gap statistic would claim that clearly gerrymandering has occurred to the largest degree possible. When the fact is that you can’t achieve less bias than the approach used for dividing the districts as was done here. Thus, the efficiency gap statistic is absolutely meaningless in every regard because it utterly falls flat on its face when compared to true non-gerrymandered data.
This also points out another fact. You can’t create districts without gerrymandering unless you are willing to accept that the minority will have almost no representation.
LikeLike
I think it’s a mistake to characterize minority representation as “a math problem not a fairness problem”. Fairness is about deciding on what the appropriate objective of voting should be; an assertion that the efficiency gap should be small is simply an assertion that one should use efficiency gap as the measure of fairness, which is just as arbitrary as deciding that one should use similarity between voter proportions and winner proportions (which I think is a better goal).
LikeLike
*any* districting where the election is far from unanimous is gerrymandered from the perspective of that minority. In red states, even without gerrymandering the Republicans are likely to sweep all districts leaving a large Democrat minority unrepresented, and vice versa for blue states. We’ve specifically identified certain historically under-represented groups that we protect from this, but we can’t protect everyone. And since our population is mixed, any effort to enforce geographic coherence will be subject to the same problem.
Really the only way around this problem is to elect more than one representative per district (but give each voter only one vote). E.g. if there are 2 people elected out of 3 running then at most 1/3 of people won’t get their first choice, instead of the 49% losers that we see in many elections today.
LikeLike
We should adopt the system the Aussies use for their Senate, and apply it to our House — proportional representation off a ranked ballot. Aside from the fact that it wipes out the gerrymander problem, it likely also would lead to seeing minor parties actually win a few seats (I’d expect a small number of Libertarians and Greens to be elected out of CA).
LikeLike
I agree that once you see the logic of proportional representation, anything else seems absurd. One can do it without a ranked ballot, though. The two obvious ways are
(1) Parties announce ranked slates. Voters vote for parties and each party gets a number of representatives from the top of its slate proportional to its votes. (But this is bad when a party which is generally good is controlled by a local jerk.)
(2) People simply vote for one candidate, and the top k vote getters are elected. This creates strategic voting issues, but I’m not sure they are any worse than in the present system.
I don’t think that these are better in the abstract, but they would feel less radical as changes to the current system.
LikeLike
Shouldn’t the gerrymander score be related to the ratio of perimeter squared to area (that is, an isoperimetric ratio)? Otherwise it won’t be scale invariant, and will make rural districts look better than urban districts of the same shape.
LikeLike
That’s 100% true.
LikeLike
Other issues with Olson’s approach, at least from what I’ve seen:
First: It’s not clear to me that he’s made any effort to address standing law about creating districts that allow minority groups that make up enough of a community that they CAN elect a candidate, to do so. (I have mixed feelings about this law, because it kind of encourages the majority to pack a district to be 95% that minority group, rather than giving them influence in a larger number of districts.)
Second: I’d build an algorithm to try to respect existing political lines (counties and cities) where possible, to nest districts where population ratios allow, and generally to make the boundaries for various offices line up as much as possible.
Third: Area and distance metrics don’t work unless you first distort your map to make “distance” line up with travel time. An algorithm that tries to put everyone as close to the center of the district as possible may build a district that looks compact, but in fact is riven down the center by a body of water, or a mountain ridge that can only be crossed via a narrow, windy, minor road. If you first distort your map (possibly into 3D space) to optimize the degree to which distance represents travel time, and then you use population density to define the “density” of the “material” of the map, then “average distance to center of mass” and perimeter:area ratio will probably be more useful.
LikeLike
There is a very interesting article in the New Republic by Nicholas Stephanapoulos on ways to quantitatively measure the degree of gerrymandering:
Here’s How We Can End Gerrymandering Once and for All
https://newrepublic.com/article/118534/gerrymandering-efficiency-gap-better-way-measure-gerrymandering, and the detailed paper:
http://papers.ssrn.com/sol3/papers.cfm?abstract_id=2457468
I’ll reproduce their summary of the general approach, which focuses on developing an “efficiency gap”.
“The efficiency gap is simply the difference between the parties’ respective wasted votes in an election, divided by the total number of votes cast. Wasted votes are ballots that don’t contribute to victory for candidates, and they come in two forms: lost votes cast for candidates who are defeated, and surplus votes cast for winning candidates but in excess of what they needed to prevail. When a party gerrymanders a state, it tries to maximize the wasted votes for the opposing party while minimizing its own, thus producing a large efficiency gap. In a state with perfect partisan symmetry, both parties would have the same number of wasted votes.”
It’s a very innovative and useful approach.
LikeLiked by 1 person
I propose we require all delegates to use horse transportation to get to Philadelphia and Cleveland.
LikeLike
Love it.
LikeLike
All sorts of funny business possible. Saw article some years go, when Nebraska had two U.S. Representatives.
Details a bit foggy after all these years but here goes.
Split the state down the middle one way, you got two reps of the same party.
Split the state the other way, you got one rep of each party.
LikeLike
That hardly comes as a surprise to me. I would expect that engineering to minimize Gerrymander statistical bias (GSB) is itself an act of gerrymandering, one with historical precedent (under court order, of course). I would think there exists a well-defined procedure for calculating the expected value of GSB, but statistical learning is so thorougly atrophied in my case that I wouldn’t know where to start. So maybe the proper test for gerrymandering is the measurement not of bias, but of “artificiality.” I also entertain the thought experiment (which hopefully can be more than a thought experiment for someone who actually learned some statistics) that a political actor might set up redistricting as a multiple-objective optimization in which margins of victory (MOV) are minimized, margins of defeat (MOD) maximized (the recipe described under “How to Gerrymander” above) and, as an added design criterion, perimeter-to-area (PTA) is minimized. The addition of the third objective wouldn’t magically transform this into an exercise in “How Not To Gerrymander.” By how much it would diminish the effectiveness of gerrymandering relative to the earlier two-objective problem sounds like an interesting statistics problem. Another question I have no idea how to tackle: Does optimization of (min MOV, max MOD, min PTA) outperform (min MOV, max MOD, min |GSB-Exp(GSB)|)?
LikeLike
http://www.eaudrey.com/myth/salamander.htm
LikeLike