Guest post: Useful Math Tools
This is a guest post by Maxwell Feiner, a New York City high school kid interested in math. Maxwell and I have been having fun math conversations on Friday afternoons for a while now, and I’ve been impressed by the tools he uses, so I asked him to write up a description of them for mathbabe.
When I am doing math in my spare time there are three tools that I use heavily to aid in the process. These three being Desmos.com and Wolframalhpa.com for the aid in solving problems, and Brilliant.org for finding great problems to solve.
Brilliant
![]()
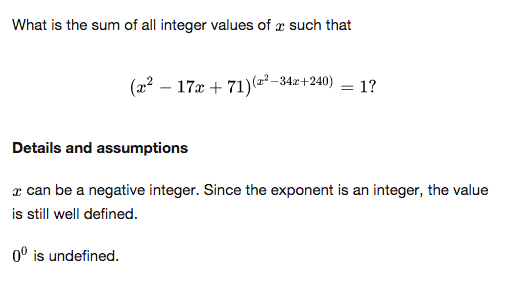
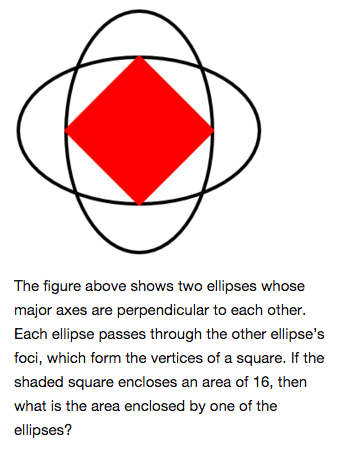
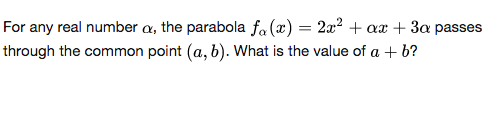
Brilliant is a fantastic site for users to obtain unique challenging problems, as well as to post solutions to problems posed by others. Think of it as a social site for math. Most of the problems are math, but there are some physics and chemistry problems as well. I like the problems a lot because they require insight beyond what is taught in school classes. They normally cannot be solved using one formula or pre-learned method, but instead require deeper thought and a combination of different concepts in order to be solved. Signing up is required to use the site. It is free. Some sample problems are shown below.
Desmos
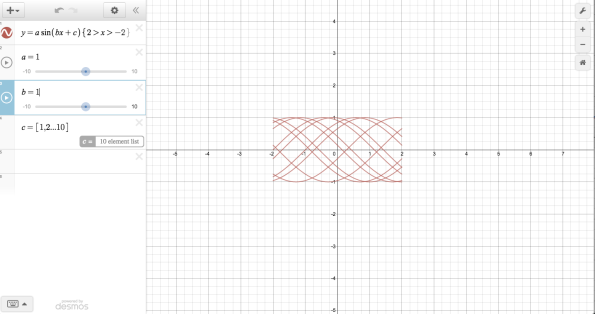
Desmos is a great, free, and interactive online graphing calculator. It is simple to use, but at the same time very powerful. Besides just graphing equations, the user can put in adjustable values of variables and watch how the graph changes as the variables do. For example, the user could enter the equation y=a*sin(bx+c) and create adjustable values for a,b, and c, then see how changing them affects the graph of the function.

To change the values of the variables, the user can use either sliders (shown), manually input values, or put in a set of numbers or range, such as c=[1,2], where two graphs will be displayed for c=1 and c=2, or c=[1,2,…10](also shown), where 10 graphs will be displayed, for every integer from 1 to 10. The sliders can also be used to make animations by continually and smoothly incrementing the value of one of the variables. In the graph pictured below I also used the restrictions capability, allowing me to only show a certain part of the graph.
Another cool feature is movable points, which is demonstrated in two of my own graphs which have links to them below. There are so many features that it would be very hard to explain them all here, so I have provided a link to some of their tutorials on their website and a few examples of some interactive graphs I created. You can create an account and publish your work too.
Here’s a tutorial, and here are some examples of my work:
WolframAlpha

WolframAlpha is a powerful computational knowledge engine that can be used for many purposes, both math and non-math related. One thing it is particularly helpful for is graphing 3-D equations. Just type in an equation,1-D,2-D, or 3-D and it will be graphed. Once on the site, some interesting queries to try include the ones pictured below.
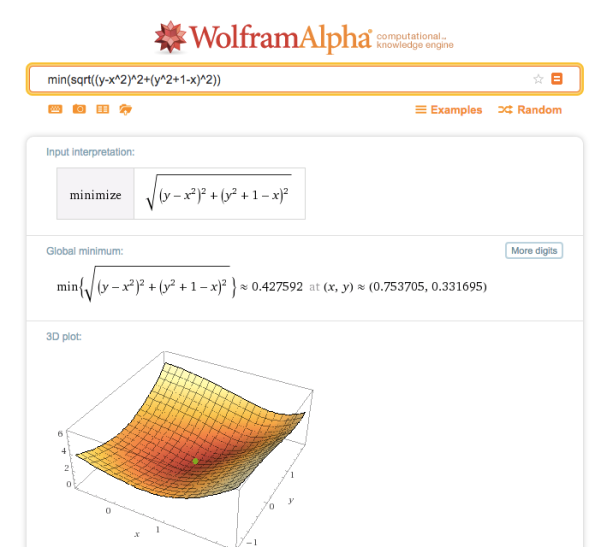
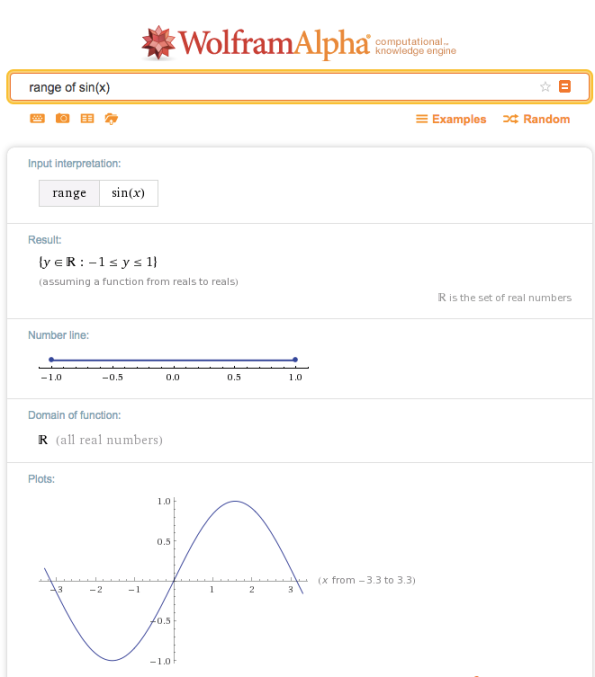


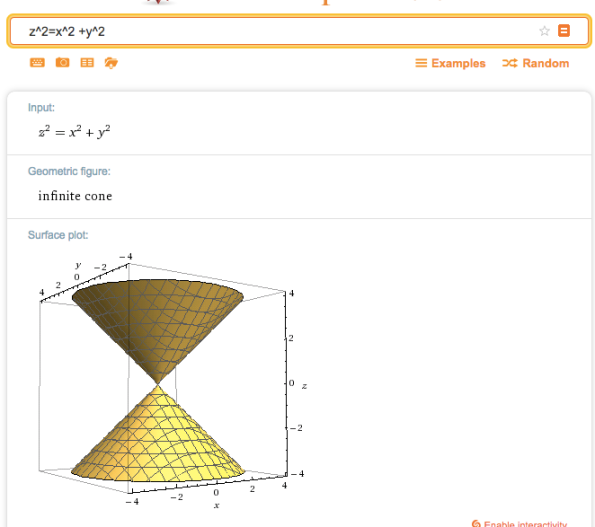

Other ones to try (just copy and paste into WolframAlpha or click on the links below)
- area under
from 1 to 2
- rotation of 45 degrees
- Parabola vs hyperbola
- (Population of China)/(Population of U.S.)

![\sqrt[2]{2i}](https://s0.wp.com/latex.php?latex=%5Csqrt%5B2%5D%7B2i%7D&bg=ffffff&fg=555555&s=0&c=20201002)
This is just barely scratching the surface of what can be done with the powerful tool.
Conclusion
After working with these three tools for a while, I, and many others have benefitted so much from using them. If you are looking for aids in solving problems, or more problems to solve, I highly recommend checking them out.


I’ve used Wolfram before, very helpful to see the steps to solve calculus problems. I really like the Desmos ability to see what happens with varying values. I generally use matlab to plot stuff like that but it looks very helpful and easier to use. Thank you for sharing 🙂
LikeLike
Wow! Thank you for sharing, Maxwell.
LikeLike
LikeLike
Three excellent choices! I’d recommend – because you seem from this like you’d really love – geogebra.org and sagemath.org as well.
LikeLike
Brilliant.org is, well, brilliant. 🙂 We also resort to desmos when we get lazy producing graphs (as in this post on inverse functions), but above all, Wolfram is our swiff knife of choice, and these days we use it to solve definite integrals that takes too much time to be solved, or has to be evaluated numerically.
LikeLike
A fine and useful posting, Maxwell, thank you! In return, you may find interesting the effort in Cambridge UK, Arizona, and Japan to recast mathematics in terms of geometric algebra. I would like to promote on these sites a challenge by another brilliant high-schooler — from Singapore — the use of quaternions and factoring tools on Wolfram to break asymmetric encryption!
LikeLike
You may not be aware, if you use OS X, that there is an application hidden away in Applications/Utilities called Grapher. Look at some of the selections under the Examples menu.
LikeLike
When someone else’s software becomes too constricting and you need to create your own … especially with a slant towards 3D visualization then teach yourself threejs … http://threejs.org/examples/#webgl_geometry_extrude_splines
LikeLike
Richard, thank you for the suggestion of Grapher.
There is an obvious bug in Wolfram Alpha that makes me suspect of other problems with the software as well as the testing.
Asking for the distance from Jerusalem to Bethlehem (according to the New Testament is the birthplace of Jesus and comes up first in a Google search of “Bethlehem”).
Google: 7.1 km
Wolfram Alpha: 5770 miles (the distance to Bethlehem PA in the USA).
LikeLike