Intentionally misleading data from Scott Hodge of the Tax Foundation
Scott Hodge just came out with a column in the Wall Street Journal arguing that reducing income inequality is way too hard to consider. The title of his piece is Scott Hodge: Here’s What ‘Income Equality’ Would Look Like, and his basic argument is as follows.
First of all, the middle quintile already gets too much from the government as it stands. Second of all, we’d have to raise taxes to 74% for the top quintile to even stuff out. Clearly impossible, QED.
As to the first point, his argument, and his supporting data, is intentionally misleading, as I will explain below. As to his second point, he fails to mention that the top tax bracket has historically been much higher than 74%, even as recently as 1969, and the world didn’t end.
Hodge argues with data he took from a report from the CBO called The Distribution of Federal Spending and Taxes in 2006. This report distinguishes between transfers and spending. Here’s a chart to explain what that looks, before taxes are considered and by quintile, for non-elderly households (page 5 of the report):
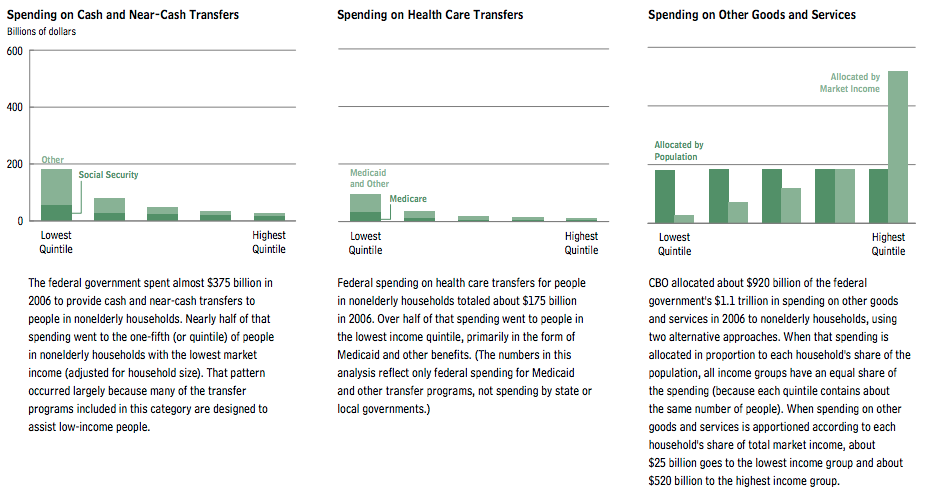
The stuff on the left corresponds to stuff like food stamps. The stuff in the middle is stuff like Medicaid. The stuff on the right is stuff like wars.
Here are a few things to take from the above:
- There’s way more general spending going on than transfers.
- Transfers are very skewed towards the lowest quintile, as would be expected.
- If you look carefully at the right-most graph, the light green version gives you a way of visualizing of how much more money the top quintile has versus the rest.
Now let’s break this down a bit further to include taxes. This is a key chart that Hodge referred to from this report (page 6 of the report):

OK, so note that in the middle chart, for the middle quintile, people pay more in taxes than they receive in transfers. On the right chart, for the middle quintile, which includes all spending, the middle quintile is about even, depending on how you measure it.
Now let’s go to what Hodge says in his column (emphasis mine):
Looking at prerecession data for non-elderly households in 2006 in “The Distribution of Federal Spending and Taxes in 2006,” the CBO found that those in the bottom fifth, or quintile, of the income scale received $9.62 in federal spending for every $1 they paid in federal taxes of all kinds. This isn’t surprising, since people with low incomes pay little in taxes but receive a lot of transfers.
Nor is it surprising that households in the top fifth received 17 cents in federal spending for every $1 they paid in all federal taxes. High-income households hand over a disproportionate amount in taxes relative to what they get back in spending.
What is surprising is that the middle quintile—the middle class—also got more back from government than they paid in taxes. These households received $1.19 in government spending for every $1 they paid in federal taxes.
In the first paragraph Hodge intentionally conflates the concept of “transfers” and “spending”. He continues to do this for the next two paragraphs, and in the last sentence, it is easy to imagine a middle-quintile family paying $100 in taxes and receiving $119 in food stamps. This is of course not true at all.
What’s nuts about this is that it’s mathematically equivalent to complaining that half the population is below median intelligence. Duh.
Since we have a skewed distribution of incomes, and therefore a skewed distribution of tax receipts as well as transfers, then in the context of a completely balanced budget, we would expect the middle quintile – which has a below-mean average income – to pay slightly less than the government spends on them. It’s a mathematical fact as long as our federal tax system isn’t regressive, which it’s not.
In other words, this guy is just framing stuff in a “middle class is lazy and selfish, what could rich people possibly be expected do about that?” kind of way. Who is this guy anyway?
Turns out that Hodge is the President of the Tax Foundation, which touts itself as “nonpartisan” but which has gotten funding from Big Oil and the Koch brothers. I guess it’s fair to say he has an agenda.


Intentionally misleading? You don’t know that.
LikeLike
Sure I do. He read the report and knows the difference between spending and transfers but wrote his piece as though they were equivalent.
LikeLike
…and did you see this piece of tripe from yesterday ($4 minimum wage):
http://tinyurl.com/kjnqsg8
LikeLike
I guess the overall message is that we live in a stratified society, and each SES “class” interacts differently with the government.
But why is this news? It has always been the case.
LikeLike
I think the message is those on the top deserve to stay there and do everything possible to keep those on the bottom in their place… because we know WE are makers and THEY are takers…
LikeLike
Yes — but that is a moral assessment that is attached to the social reality of wealth stratification, and like all moral assessments, it is open to debate.
I chose to view it differently, and to question the morality of extreme wealth and extreme poverty.
LikeLike
While I agree with the second part of your post, can you (and everyone else) please stop mentioning the top marginal rate in the 60s as an argument? People don’t pay the marginal rate, but the effective rate; the effective rate was never much higher than 50%, if this website is to be believed: http://qz.com/74271/income-tax-rates-since-1913/
Also, people don’t pay taxes on their income; AGI, MAGI, or some other crap — I am not an accountant. What I do know is that the deductions matter, and, while I’m too busy to google this right now, people in the 60s had donkey-loads of those. Let me deduct the full costs of my rent, my health insurance (I pay out-of-pocket), and my childcare expenses, and then feel free to triple my marginal tax rate to 90%.
LikeLike
Great point. I wish I had a graph of effective tax rates over time. Still think it’d be higher in 1969.
LikeLike
74% or 50% with yesteryear’s tax shelters is actually lower than today’s rates. Accountants, lawyers and brokers benefited immensely by getting paid big $$ to help their clients to avoid paying taxes.
LikeLike
In the website linked above, there is a little section that says “(not including capital gains)”. This is where most of the “revenue leak” is, and always was, in the US and everywhere else in the world including high tax countries like Sweden or France. A 74% capital gains tax has NEVER been applied anywhere and anytime.
For instance, France is currently trying to reach a 60% level, but with introducing loopholes which defeats completely the purpose, such as tax exemption for owners of company who retires or reinvest more that 80% of their capital gains in another company (think about it for a minute : is there another alternative ?), or exemption for the resale of the main residence or exemption for retirement funds. The loopholes are of the essence, the top rate is just for show. Any democratic government who would try to remove them would be replaced promptly.
LikeLike
Boris – I tried your link, plugged in a 10,000,000 income and looked at the effective tax rates since 1913. It showed effective rates of 89% during the 50s that have fallen dramatically since. Looks like pretty strong evidence that US Federal income taxes were far more progressive and redistributive in the 50s and 60s than today. The UK taxman left one for you, and took 19 if I remember correctly.
LikeLike
Ah, I think I used 400,000 or so for my example (the lowest income in the current highest tax bracket; they had way more brackets back in the 50′s — in 1955, top bracket of 91% started at over 3.4MM in 2013 dollars. Here’s the document with the history: http://www.scribd.com/doc/190500966/Federal-Individual-Individual-Income-Tax-Rate-Adjusted-for-Inflation)
My second point stands though: these rates apply to adjusted (and reported) income; people had way more ways to adjust (or not report) income back in those days, from what I understand. (Credit card interest was deductible???) The relevant quantity is the total tax collected from each quantile over total amount of money they reported. For some reason I am thinking that number has been about 35%+-10% for the top 1% earners pretty much constantly since the 50s, but I can’t find that data. This might be what I am looking for (but it does not go that far back): http://www.taxpolicycenter.org/taxfacts/displayafact.cfm?Docid=456, and http://www.cbo.gov/sites/default/files/cbofiles/attachments/Trends_in_household_income_forposting.pdf (slide 10).
LikeLike
Yes — a reason many left the UK, apparently.
http://econlog.econlib.org/archives/2014/01/marginal_tax_ra_3.html
LikeLike
Hm …. try this libertarian approach to the Beatles song:
http://econlog.econlib.org/archives/2014/01/marginal_tax_ra_3.html
LikeLike
I can’t say this often enough (and have been for years): Who gets how much money is just as important as who gets taxed by how much. If you go out to lunch with the boss and he brags about how he picked up three quarters of the tab without mentioning that his share of the bill came to 80% and you had to loan him the money for that, well, that’s just a little bit deceptive isn’t it?
LikeLike
Agreed. A better measure would be “total taxes paid / total dollars made”. Here’s some historical data on that (best I could find, see “Tax share” and “Share of total income”):
http://www.theatlantic.com/business/archive/2010/04/how-to-think-about-taxes-and-the-rich/38947/
LikeLike
This was a good link — but it raised more questions in the comments than before. I thought the point about the impact of adding 5% population increase due to immigration on the tax distribution was a valid question.
And my question is: What happens when you add in state income and city and county sales and income taxes?
LikeLike
I think it’s worth mentioning that given that your hypothesis of “a completely balanced budget” is obviously not the case for the federal government, the intellectual dishonesty in that article is even worse.
LikeLike
Cathy I would be interested in one about income inequality.
Clearly income inequality has gone up in the US, but has it also gone up worldwide? We know that we can increase dispersion of two sets without changing anything in their union.
What about purchasing power of disposable income? To me that is a better measure of “wealth” than income or gdp per capita.
I am guessing that income and wealth has increased in most of the world outside of middle class in the west. Most of this income increase has been because of middle class in India and China taking away middle class jobs in the west.
I am also guessing that in the west the increase in wealth of the 1% and the 0.1% has coincided with the decrease in taxes on capital.
LikeLike