The Stacks Project gets ever awesomer with new viz
Crossposted on Not Even Wrong.
Here’s a completely biased interview I did with my husband A. Johan de Jong, who has been working with Pieter Belmans on a very cool online math project using d3js. I even made up some of his answers (with his approval).
Q: What is the Stacks Project?
A: It’s an open source textbook and reference for my field, which is algebraic geometry. It builds foundations starting from elementary college algebra and going up to algebraic stacks. It’s a self-contained exposition of all the material there, which makes it different from a research textbook or the experience you’d have reading a bunch of papers.
We were quite neurotic setting it up – everything has a proof, other results are referenced explicitly, and it’s strictly linear, which is to say there’s a strict ordering of the text so that all references are always to earlier results.
Of course the field itself has different directions, some of which are represented in the stacks project, but we had to choose a way of presenting it which allowed for this idea of linearity (of course, any mathematician thinks we can do that for all of mathematics).
Q: How has the Stacks Project website changed?
A: It started out as just a place you could download the pdf and tex files, but then Pieter Belmans came on board and he added features such as full text search, tag look-up, and a commenting system. In this latest version, we’ve added a whole bunch of features, but the most interesting one is the dynamic generation of dependency graphs.
We’ve had some crude visualizations for a while, and we made t-shirts from those pictures. I even had this deal where, if people found mathematical mistakes in the Stacks Project, they’d get a free t-shirt, and I’m happy to report that I just last week gave away my last t-shirt. Here’s an old picture of me with my adorable son (who’s now huge).

Q: Talk a little bit about the new viz.
A: First a word about the tags, which we need to understand the viz.
Every mathematical result in the Stacks Project has a “tag”, which is a four letter code, and which is a permanent reference for that result, even as other results are added before or after that one (by the way, Cathy O’Neil figured this system out).
The graphs show the logical dependencies between these tags, represented by arrows between nodes. You can see this structure in the above picture already.
So for example, if tag ABCD refers to Zariski’s Main Theorem, and tag ADFG refers to Nakayama’s Lemma, then since Zariski depends on Nakayama, there’s a logical dependency, which means the node labeled ABCD points to the node labeled ADFG in the entire graph.
Of course, we don’t really look at the entire graph, we look at the subgraph of results which a given result depends on. And we don’t draw all the arrows either, we only draw the arrows corresponding to direct references in the proofs. Which is to say, in the subgraph for Zariski, there will be a path from node ABCD to node ADFG, but not necessarily a direct link.
Q: Can we see an example?
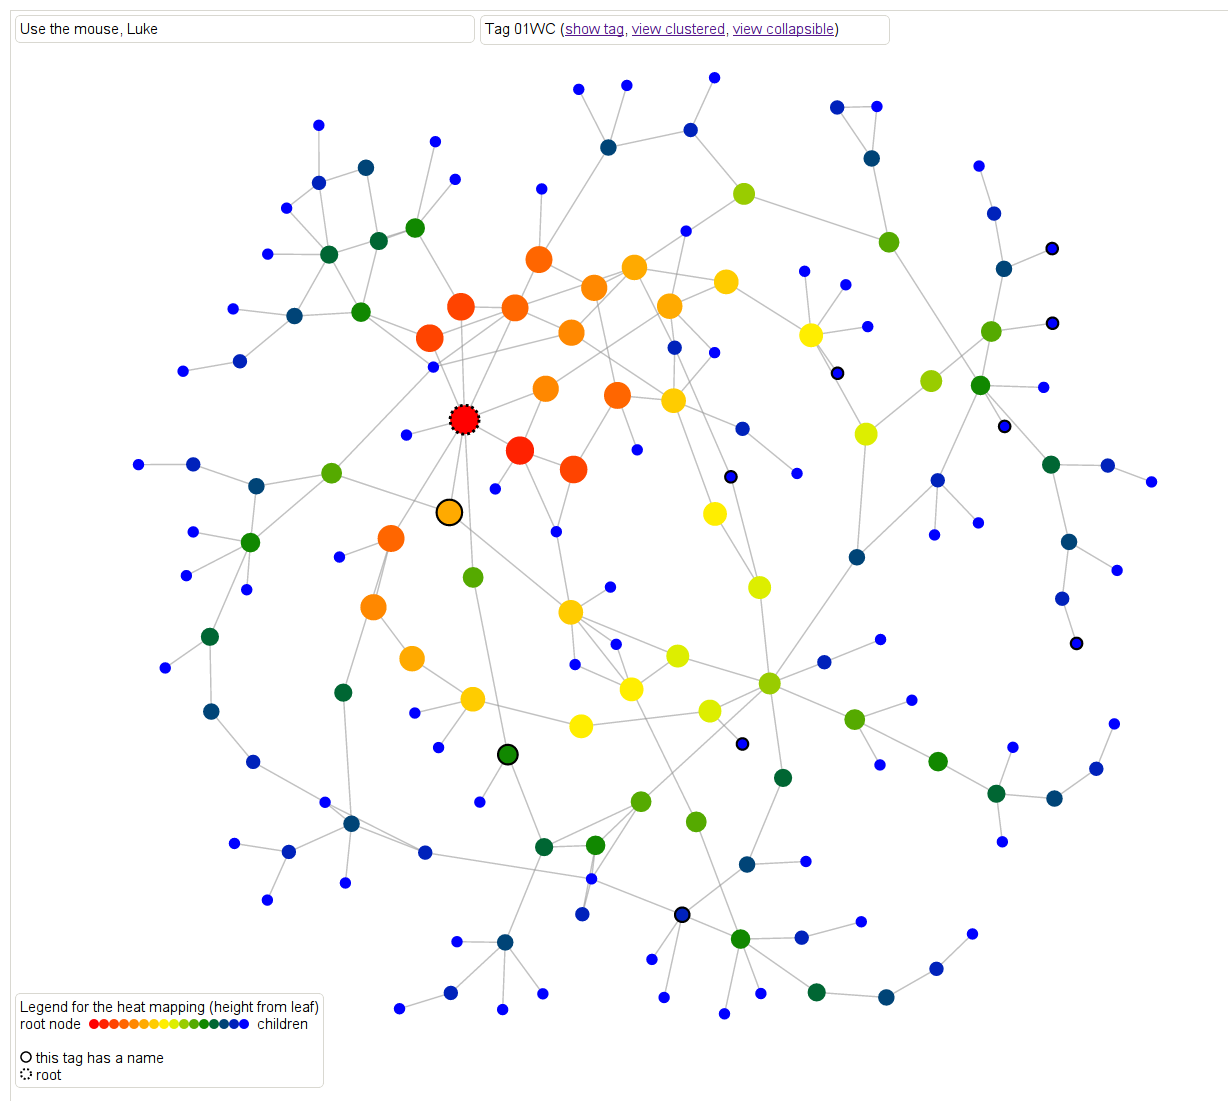
Let’s move to an example for result 01WC, which refers to the proof that “a locally projective morphism is proper”.
First, there are two kinds of heat maps. Here’s one that defines distance as the maximum (directed) distance from the root node. In other words, how far down in the proof is this result needed? In this case the main result 01WC is bright red with a black dotted border, and any result that 01WC depends on is represented as a node. The edges are directed, although the arrows aren’t drawn, but you can figure out the direction by how the color changes. The dark blue colors are the leaf nodes that are farthest away from the root.
Another way of saying this is that the redder results are the results that are closer to it in meaning and sophistication level.
Note if we had defined the distance as the minimum distance from the root node (to come soon hopefully), then we’d have a slightly different and also meaningful way of thinking about “redness” as “relevance” to the root node.
This is a screenshot but feel free to play with it directly here. For all of the graphs, hovering over a result will cause the statement of the result to appear, which is awesome.

Next, let’s look at another kind of heat map where the color is defined as maximum distance from some leaf note in the overall graph. So dark blue nodes are basic results in algebra, sheaves, sites, cohomology, simplicial methods, and other chapters. The link is the same, you can just toggle between the different metric.
Next we delved further into how results depend on those different topics. Here, again for the same result, we can see the extent to which that result depends on the different on results from the various chapters. If you scroll over the nodes you can see more details. This is just a screenshot but you can play with it yourself here and you can collapse it in various ways corresponding to the internal hierarchy of the project.

Finally, we have a way of looking at the logical dependency graph directly, where result node is labeled with a tag and colored by “type”: whether it’s a lemma, proposition, theorem, or something else, and it also annotates the results which have separate names. Again a screenshot but play with it here, it rotates!

Check out the whole project here, and feel free to leave comments using the comment feature!


Wow! I’m checking it out now. I’m always looking for great resources for my children and my students.
LikeLike
FWIW, some things to think about with regard to the relation between Logic and Geometry —
• Theme One Program
LikeLike
Reblogged this on John Pappas's blog.
LikeLike
Fascinating use of node networking! I would be interested in how Prof Hestenes & UK Cambridge, et al.’s Geometric Algebra fits in with this Algebraic Geometry schema?
LikeLike
Seems like you could just as easily use these graphs to depict mathematicians that teach algebraic geometry to their students …. i.e., as a social network.
LikeLike
Time to make new tshirts. The graphs are gorgeous!
LikeLike
Done and done, got one in your size babe.
LikeLike
I think your dependencies “browser” is analogous to a browser for viewing the structure of a class library in C++. In that case one also has a DAG, except the nodes are classes instead of tags. I think there already exist some C++ class browsers out there that are MUCH clearer and more useful than your browser. Sorry, but that is my opinion.
LikeLike
I have to wonder, of course, which category these are diagrams in, and if one can construct stacks on that category…
LikeLike