K-Nearest Neighbors: dangerously simple
I spend my time at work nowadays thinking about how to start a company in data science. Since there are tons of companies now collecting tons of data, and they don’t know what do to do with it, nor who to ask, part of me wants to design (yet another) dumbed-down “analytics platform” so that business people can import their data onto the platform, and then perform simple algorithms themselves, without even having a data scientist to supervise.
After all, a good data scientist is hard to find. Sometimes you don’t even know if you want to invest in this whole big data thing, you’re not sure the data you’re collecting is all that great or whether the whole thing is just a bunch of hype. It’s tempting to bypass professional data scientists altogether and try to replace them with software.
I’m here to say, it’s not clear that’s possible. Even the simplest algorithm, like k-Nearest Neighbor (k-NN), can be naively misused by someone who doesn’t understand it well. Let me explain.
Say you have a bunch of data points, maybe corresponding to users on your website. They have a bunch of attributes, and you want to categorize them based on their attributes. For example, they might be customers that have spent various amounts of money on your product, and you can put them into “big spender”, “medium spender”, “small spender”, and “will never buy anything” categories.
What you really want, of course, is a way of anticipating the category of a new user before they’ve bought anything, based on what you know about them when they arrive, namely their attributes. So the problem is, given a user’s attributes, what’s your best guess for that user’s category?
Let’s use k-Nearest Neighbors. Let k be 5 and say there’s a new customer named Monica. Then the algorithm searches for the 5 customers closest to Monica, i.e. most similar to Monica in terms of attributes, and sees what categories those 5 customers were in. If 4 of them were “medium spenders” and 1 was “small spender”, then your best guess for Monica is “medium spender”.
Holy shit, that was simple! Mathbabe, what’s your problem?
The devil is all in the detail of what you mean by close. And to make things trickier, as in easier to be deceptively easy, there are default choices you could make (and which you would make) which would probably be totally stupid. Namely, the raw numbers, and Euclidean distance.
So, for example, say your customer attributes were: age, salary, and number of previous visits to your website. Don’t ask me how you know your customer’s salary, maybe you bought info from Acxiom.
So in terms of attribute vectors, Monica’s might look like:

And the nearest neighbor to Monica might look like:
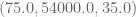
In other words, because you’re including the raw salary numbers, you are thinking of Monica, who is 22 and new to the site, as close to a 75-year old who comes to the site a lot. The salary, being of a much larger scale, is totally dominating the distance calculation. You might as well have only that one attribute and scrap the others.
Note: you would not necessarily think about this problem if you were just pressing a big button on a dashboard called “k-NN me!”
Of course, it gets trickier. Even if you measured salary in thousands (so Monica would now be given the attribution vector 
Another problem is redundancy – if you have a bunch of attributes that are essentially redundant, i.e. that are highly correlated to each other, then including them all is tantamount to multiplying the scale of that factor.
Another problem is not all your attributes are even numbers, so you have string attributes. You might think you can solve this by using 0’s and 1’s, but in the case of k-NN, that becomes just another scaling problem.
One way around this might be to first use some kind of dimension-reducing algorithm, like PCA, to figure out what attribute combinations to actually use from the get-go. That’s probably what I’d do.
But that means you’re using a fancy algorithm in order to use a completely stupid algorithm. Not that there’s anything wrong with that, but it indicates the basic problem, which is that doing data analysis carefully is actually pretty hard and maybe should be done by professionals, or at least under the supervision of a one.


You’re assuming that management actually cares about having a robust analysis and an honest picture of their business. Generally, I suspect the CEO will be most happy, and therefore promote, those who bring simple stories that show wild succe$$. Those are the stories that drive the stock price upwards and bring in the big bonuses for the C-level crowd. And we all know the market price includes a rational determination of every factor imaginable, according to the mystic priests of the Efficient Market Hypothesis. Thus all is aligned and right with the universe.
As for the honest data scientist who demands truth through robust models and intellectually honest assumptions and valuations, the will likely be barred from the boardroom upon first uttering the words, “But, we really can’t say that because ….” Either they’ll be pushed out of the company, or they’ll be relegated to the status of “pesky nerd who is best ignored”. Pooping in the punchbowl only upsets the market, the stock price, the bonuses, and the crystal spheres of the Efficient Market Mystics.
LikeLike
Even the most sincere CEO won’t know which factors deserve the most weight or how to properly scale the factors, etc. They’ve turned to the quants for data/math-driven answers because they are looking for guidance outside their area of expertise.
Is $55000 a useful number? Ask the data. Experiment. Compare results, feedback, and iterate.
But don’t ask the user. S/He doesn’t know.
LikeLike
You haven’t worked in industry, have you? 🙂
No, in my experience (nearly 20 years in patent practice in Silicon Valley, including the dot-com boom), most CEO’s don’ care about those details. Why Because it’s not their job! CEO’s are paid to drive the company’s stock value; that’s the mantra of the Chicago School of economics that took over the civilized world in the ’80s. Asking detailed question of experts rarely drives stock prices, but good, simple success stories will. The fastest way to make yourself a pariah at most tech companies is to demand intellectual honesty and ask discomforting questions.
LikeLike
moosesnsquirrels,
You are exactly correct! I fight that battle everyday, and make most of my money shorting the stock market due to this type of thinking! And my promotability has been zero, even though i have more finance experience than my political science boss who is a director of finance. . . LOL!
sportsguy
LikeLike
Fun. I am doing a master’s in applied math (and decided I was going to veer away from applied stats to other stuff) but I still followed the argument with only a semester of linear models as background.
More substantive comment, your point is akin (though perhaps more valid) than something my linear models textbook said about how model evaluation couldn’t be automated in a program. I’m not actually sure that’s true (my background actually is in software). Definitely what we did as students could probably be automated, though the crucial part is how people make choices when the get to the “branch in the flow chart”, i.e. those places where some judgement and sophistication are essential. But there are not that many branch points, there are not that many alternatives (it is my guess that professionals use a relative handful of techniques a very high proportion of the time).
Now that I think about it, the problem is not that you can’t automate something and gently guide the user through supplying a series of inputs, the problem is that in the end, if you used a type of “sophisticated” automation, they will have not one but a series of models/results and the tendency will be to cherry pick the most advantageous one. So what automation would do, especially when it works well, is that it would take the “ethical” dimension out of it, the one that hopefully the professional (e.g. the d.s.) supplies.
LikeLike
COSIGN pjm’s otm and important second paragraph.
LikeLike
Yes, this! Clustering is so, so interesting and rich and hard — in fact, it was thinking about clustering that first made me, once a pure math snob, realize just how deep these questions went. It’s bad enough to mindlessly do linear regression, but mindless clustering is more dangerous still.
LikeLike
I totally think you should start a data science company.
LikeLike
But even a dumb piece of software wouldn’t be *this* dumb, would it? Obviously, the software would do some mumbo jumbo (e.g. mindless best fit regressions) to figure out reasonable scalings and spit out some measurement of confidence to go with the results. I concede that doing the mumbo jumbo right is nontrivial and certainly not one-size-fits-all. But you haven’t convinced me that a one-size-fits-all algorithm won’t give half-decent results. It certainly wouldn’t spit out the kind of trash you’re describing in this post. And for a business too small to hire actual data scientists, half-decent data analysis on the cheap is still more valuable than no data analysis at all.
LikeLike
Eh. Someone mentioned automatic rescaling. But that wouldn’t necessarily reflect the actual importance of the factors. So no.
LikeLike
Dan’s got the right idea though. Rescaling + regression + dropping the lowest variance explained terms would basically do it and I’m pretty sure Stata has packages that do that already.
That said, you need to know some facts to do what I just said and K-NN seems stupid for that kind of problem compared with NN, SVM or logit anyway. So point taken.
LikeLike
Point being: you have to understand why you’re doing what you’re doing.
LikeLike
Hopefully it won’t.
Because the most common approach good tools take is to do exactly what you tell it to, because it assumes you know what you’re doing.
The tool’s job is to do precisely what you tell it to do. It’s not the job of a hammer to ask if you’re using the correct nail. That’s the carpenter’s job. It’s not the job of the knife to ask if you should use lemon and not lime. That’s the cook’s job. And it’s not the job of the program to ask if the data is correctly fitted. That is the user’s job. If the user does not even have to do that, I think I won’t go into any data-business. Instead, I will train German Shepherds to push the buttons on the computer, thus saving companies billions in wages for a few millions in dog-food.
LikeLike
Yeah, and a brief note to myself.
KNNs in my experience are often tools of last resort when you think any regression model are not going to catch the correct parameters for whatever reason and neural nets are too costly/unrobust.
For instance, right now, for risk measurement – regressions and bayesian techniques were the *first* that were historically used to measure fin risk. Only now, in the last few years are we using the simplest AI techniques (KNN for various parameters then comparing with previous years and quarters) to measure risk because all prior techniques have proven unsatisfactory.
In general, for business types you want to use the most sophisticated algos that do most of the work for them (like SVM variations) and then work your way down the sophistication chain.
LikeLiked by 1 person
That’s totally ridiculous advice. The more sophisticated algorithms are much harder to understand and can easily be misused.
LikeLike
Terse: See comment #1.
Zen: How many ways can an SVM mislead you about appropriate classifications you given a single sane kernel choice?
How many ways can OLS regression mislead you about appropriate classifications?
How difficult is it to prove “correctness” results about each of these?
LikeLike
“How many ways can OLS regression mislead you about appropriate classifications?”
How much time you got?
LikeLike
EXACTLY my point.
LikeLike
Let’s not forget the importance of validating clustering results with experience.
Here’s my favorite example:
David Wishart clusters single malt whiskies:
http://aqmen.ac.uk/events/DavidWishart
and then follows the presentation of his results with this:
“Following his lecture, David Wishart’s flavour typology will be illustrated by a tasting of fine single malt Scotch whiskies that span his flavour spectrum.”
LikeLike
Very timely post. I just finished my first class in data mining and machine learning, and these are some of the lessons I quickly learned after tinkering with various models and trying to apply them to some well-constrained stock market trading scenarios.
Thanks!
LikeLike
The role of a data scientist includes
1) knowing what questions to ask at the and
2) problem formulation.
Even if you could automate analysis and evaluation, these tasks would be difficult without specialized human modelers. Most organizations can’t
LikeLike
Oops. Meant to say
“knowing what questions to ask at the problem formulation, analysis, design and evaluation stages.”
LikeLike
Software can be simple to use without being dumbed down. It is easier to build an application that lets the user figure how to use it, then it is to build an application that does what the user wants. An application that puts the burden on the user might very well be abused in the way that you’ve described. That is a reason that an application that solves the problem you are describing as well as a good data scientist would be very valuable. You should build that application.
LikeLike
May I suggest that fixing this tool has nothing to do with have better built dimension reduction, or scaling, etc. I think what you’re pointing out is something we’ve all discovered over time; there is no such thing as a “go make results” button. Maybe someday someone will find one and it will be an amazing tool. But how that tool works won’t be summed up in a blog comment.
For me my preferred approach is less optimization and more feedback. Make it really easy to let the tool know what it is you are trying to achieve in simple terms. And constantly have the app respond on how well you’ve achieved that. This means hold out validation happens for free and is easy to see (actual model validation, no hold out one cross validation silliness). Not to self plug but I’ve written about this idea before in http://blog.noblemail.ca/2012/05/analyst-measure-thyself.html
LikeLike
That’s a good example of a very pervasive problem. It gets terrifying when the technique in question gets more complicated.
Although knn is a simple technique. It is my favourite and “first try” technique all the time. Usually fit with a learned Mahalanobis or LMNN, it can often even beat plain SVM too and with very little effort.
LikeLike
I hear you and agree. However, I do think it is fair to take a frequentest approach and ask, of the sets of data that might be pushed through this simple K-NN, on average, and factoring in the cost of deployment etc., would the org be better off making decisions with the results of the model or not. In other words, is it possible that the marginal value of simple K-NN is positive? Sure, its not going to be optimal (at least probably not), but it still, on average, might be worth doing.
LikeLike
I don’t think that’s really the pertinent question. When you have a model you refer to behind your decision, that’s typically considered a much higher authority than just an opinion. In other words “opinion” versus “model output” aren’t comparable. Even if in terms of accuracy they are.
LikeLike
I don’t understand. You have process A, which yields some return. You then have process B, that includes this simple K-NN. Which has a higher expected return? Why wouldn’t that be a pertinent question? I guess you could also ask about risk and the variance of the distribution of possible returns to each, but it is fundamentally the same question. Anyway, feel free to email me directly if you would like to discuss and not junk up your comments section.
LikeLike
Or another classic cock-up when scaling features: Using the *entire* time-series to standardize, and then claiming to be doing out-of-sample backtesting. If you peek into the future to standardize, you are still peeking into the future! Really, really easy mistake to make.
LikeLike
Great point.
LikeLike
Even when you do manage to create a K-NN (or other) data analysis tool that people could use properly, I still think you can’t assume that because the people most similar to Person X tend to be medium spenders, Person X is also going to be a medium spender in the future. People are constantly making causal inferences from correlations, that’s another reason I think you can’t just give people a nice and shiny data analysis tool.
Perhaps any such tool should lead people through the thinking process of solving a problem/answering a question with data.. if such a thing is possible. I’d love to create an ‘experiment in a box’ one day… 🙂
LikeLike
I don’t don’t know how these dashboards are actually used in practice, but I think (or hope) that someone with a business background could come to a reasonably intuitive understanding of how at least the basic data algorithms work, and thus how to correctly use them, without knowing all the technical details. In fact, it seems like most managers would want to have some kind of understanding of what’s going on, whether they’re using a dashboard or reading a report from the data scientists that work for them. (Maybe I’m giving myself away as a hopeless optimist with this last comment.)
I had this in mind when I recently started writing a blog that explains the basics of data analysis from the intuitive perspective of geometry. (Yes, this comment is a shameless plug:
http://shapeofdata.wordpress.com/) I’m hoping that once I get into the more advanced topics, it will also be useful for aspiring data scientists who want to get an overview of the subject before they get into the details of data wrangling, programming etc.
Since I don’t have a lot of experience on the implementation side of these things, I would love to get input from from mathbabe and her readers to make sure I get things right.
LikeLike
Usually just simple normalization is sufficient. My software has an option, -n, for doing it automatically…
LikeLike
Why does the software have to make the business persons job easier to do modeling? Why can’t it help the data scientist do the modeling? If you are a consultant and you can’t spend $$$ on SAS but it’s a pain to have so much setup for R or Python, I think SAAS modeling is a great tool.
But to moosesnsqu point about CEOs not caring, he is 100% correct. But, that isn’t the audience anyway. The model has be packaged for the proper audience. You can’t include management, they never understand.
LikeLike
My understanding is that CEOs hate technical details, but do like results. So, they wouldn’t care if you used KNN, neural nets, or one that you invented yourself, so long as it actually solved a business problem for them. I guess the problem everyone faces is, if the business problem remains, is it because the analysis was lacking or some other reason? If the business is ‘solved’ is it actually solved or did someone just get lucky? That being so, if the business actually needs the classifier to classify correctly, you better hire someone who knows what they’re doing, rather than hoping the software will do it for you.
Presumably you want to sell something to Monica, and the next n Monicas who show up. If your model finds a whole lot of big spenders who then don’t, your technophobe CEO is still liable to think there’s something wrong.
LikeLike
Forgive my ignorance, but wouldn’t normalizing all the values help improve the results?
LikeLike
Great question! And that’s what I hear people say all the time in response. But all that does is assume that all the variables have equal importance, which of course may not be true. In other words, it’s just another prior, and until you know it’s correct it’s no better or worse than any other prior. On the other hand, all things being equal, it’s probably what I’d do if I had no other knowledge whatsoever.
LikeLike
Nice conversation, even given the 2 threads co-occurring here :).
I suppose on the subject of information exchange between stat/DS/quant/etc. there are 2 schools of thought:
1) the conventional point of view that everything must be simplified to nearly the binary (i.e. have a look at The Daily Show reviews on “Good or Bad” in journalism). This is simply doublespeak for ‘dumbing things down’.
2) an emerging point of view that it is important to help educate lay leaders in understanding complexity/uncertainty in their decisions. That is, complexity is not something that should withheld, though the lay leader need not know or understand the faceted details in how an output or an implementable product was derived.
The funny thing is, we *deal* with uncertainty – how is it so many stats/quants/DS’s espouse to be so *certain*? Probability/statistics is the lingua franca for extracting meaning from uncertain processes. The ability to decide upon meaning (assuming the effective communication/recommendations of the quant) is therefore constrained by the decision-maker’s ability to finally decide upon what has been translated to them. It is the leader’s decision to take in the evidence base, integrate it with their current knowledge and experience, and output an action.
Sure this is context dependent. Specifically, who should “care” about improving their savvy in complexity and uncertainty may vary depending on the business; given size, public/private, particular function of a leader – even the CEO – at a given point in time.
What I’m referring to is simply to the ethic and duty to which our crafts are practiced. Sometimes that means diplomatically taking leaders kicking and screaming with us, but that’s a soft-skill that requires an ENTIRELY different discussion thread.
2) On the implicit need to develop a deeper understanding of mathematics and statistics for the stat/quant/DS/etc. I’ve seen MANY comments submitted in other forums that ‘all you need to know is sum baysik descriptive stats and regression’. Gee, so if the object is to extract meaning from data (turn it into information) and develop knowledge from that, is the monkey who can push the button having only cursory statistical understanding the right person for the job? To extract the ‘why’, it helps to understand the ‘why’ of what one is doing to get there. Buttonology and its analogues simply won’t get there. This is one of the quickest ways to bear witness to poor outcomes (of potential large magnitude) based on specious inferences from data – simply keep ignorant of why you are doing what you are doing.
On the k-nn problem:
——————————
The k-nn problem is one of the drawbacks of its use if the data are not prepared appropriately first. There are a number of ways to weight/deweight variables based on normalizing the entire set (each depends on the datum – whether distributional, inverse distributional, min-max, etc,). The end result is unitless, and helps if the training set is normalized to 0.0 – 1.0. Pretty standard for dealing with numeric data of different scales.
If the person doing this work doesn’t understand the underlying principles of what something as lazy as k-nn does, or *at least* picking up on the problem when simply inspecting the data – and instead simply issues the command or pushes the button w/o thinking further, someone could end up taking a beating down the line.
LikeLike
kNN works surprisingly well for classifying a new document by retrieving similar documents, if you use cosine for “distance” between two vectors and the vectors are weighted by TF-IDF (term frequency–inverse document frequency). It was also the best way of querying documents until Google’s page-rank (and probably is still superior to page-rank for pure documents without hyperlinks).
What’s really nice is that the kNN computation can be linear on the size of the document being classified and almost independent of the number of documents being compared against. But normalizing the result is non-trivial (there’s no such thing as a free lunch).
LikeLike
I need suggestion..
I have one scenario and want to know whether KNN is suitable or not for that.
For entity e I am getting varying sentiment result in each iteration. Sentiment result contains two int value which give -ve or +ve polarity. Now +ve and -ve value of sentiment I am taking as (x,y) coordinates to draw graph
To show sentiment result for entity e, I have to show most relevant sentiment value for out of all available values.
Is K-Nearest Neighbor is suitable for this short of case? Any other suggestion is highly appreciated
LikeLike